Randomized Controlled Trial
. 2025 Jan 22;16(1):942.
doi: 10.1038/s41467-025-56084-6.

A legume-enriched diet improves metabolic health in prediabetes mediated through gut microbiome: a randomized controlled trial

Affiliations
Randomized Controlled Trial

A legume-enriched diet improves metabolic health in prediabetes mediated through gut microbiome: a randomized controlled trial

Xiaorong Wu et al. Nat Commun. .

Abstract

Healthy dietary patterns rich in legumes can improve metabolic health, although their additional benefits in conjunction with calorie restriction have not been well-established. We investigated effects of a calorie-restricted, legume-enriched, multicomponent intervention diet compared with a calorie-restricted control diet in 127 Chinese prediabetes participants, living in Singapore. The study was a 16-week, single-blind, parallel-design, randomized controlled trial (n = 63 intervention group (IG), n = 64 control group (CG); mean ± SD age 62.2 ± 6.3 years, BMI 23.8 ± 2.6 kg/m2). Primary outcomes were markers of glycemia and all measurements were taken at 2 or 4-weekly intervals. At the end of 16 weeks, both groups had significantly lower BMI (q(Time) = 1.92 ×10-42, β = -0.02) compared with baseline, with minimal difference between groups. The IG had significantly greater reductions in LDL cholesterol (q(Treatment×Time) = 0.01, β = -0.16), total cholesterol (q(Treatment×Time) = 0.02, β = -0.3) and HbA1c (q(Treatment×Time) = 0.04, β = -0.004) compared with CG, alongside increases in fiber degrading species in IG, mediated through metabolites such as bile acids and amino acids. A legume-enriched, multicomponent intervention diet can improve metabolic health in a prediabetes population, in addition to benefits obtained from calorie restriction alone, partially mediated through changes in gut microbial composition and function. Trial registration: Clinical Trials NCT04745702.


Conflict of interest statement

Competing interests: X.W., K.J.L., V.S.B.V., K.K., X.L., L.H.W., C.P.L.Y. and H.F. are employees of Wilmar International Limited. The remaining authors declare no competing interests. Inclusion & ethics: This study aligns by the guidelines of Nature Portfolio journals, with contributions of each author as disclosed in Author contributions.

Figures
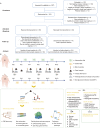
Fig. 1
Fig. 1. Research framework diagram.
A Consort Flow Diagram of the study outlining the participant recruitment, assessment for eligibility, randomization, intervention allocation, and follow-up phases, concluding with the analysis stage. B Study design: The dietary intervention was administered to both groups over a period of up to 16 weeks. Blood samples were collected at baseline, week 4, week 8, week 12, and week 16. Additionally, dietary records were maintained, and both anthropometric measurements and body composition tests were conducted. We also conducted OGTT at baseline, week 8 and week 16. Fecal samples were collected at baseline, week 2, week 4, week 8, week 12, and week 16. We profiled the fecal metagenome on all fecal samples and conducted targeted metabolomics of fecal and serum samples collected at baseline, week 4 and week 16. Lipid profile and glucose homeostasis biomarkers were assessed in all blood samples collected across five time points. For the metagenomic data, we undertook taxonomy annotation and functional characterization. The functional annotation encompassed the construction of non-redundant gene sets, annotation of carbohydrate-active enzymes, and annotation of functional pathways. Created in BioRender. Latypov, O. (2024) https://BioRender.com/w88p289.
Fig. 2
Fig. 2. General response of the clinical outcomes during the study.
Changes from baseline in (A) HbA1c, (B) fasting glucose, (C) insulin, (D) HOMA-IR, (E) LDL-C, (F) HDL-C, (G) TC, (H) TC/HDL-C ratio and (I) TG during the intervention are shown. Data presented as percent changes from week 0 (mean ± standard error). #q (Treatment×Time) < 0.05 denote p-adjusted values for the Treatment × Time interaction coefficient in the LMM model (two-sided; HbA1c: 0.04; LDL-C: W4 0.02; HDL-C: W4 0.02, W8 0.03, W12 0.01, W16 0.01; TC: W4 0.02); *q (Time) < 0.05, **q (Time) < 0.01, and ***q (Time) < 0.001 denote p-adjusted values for the time coefficient within the same group. p-values were adjusted for multiple hypothesis testing using the Benjamini-Hochberg procedure. Number of participants in IG over weeks: week 0, n = 63; week 4, n = 58; week 8, n = 57; week 12, n = 57; week 16, n = 57; number of participants in CG over weeks: week 0, n = 64; week 4, n = 61; week 8, n = 60; week 12, n = 59; week 16, n = 60. HbA1c: glycated hemoglobin A1c; HOMA-IR: Homeostatic Model Assessment of Insulin Resistance; LDL-C: Low-Density Lipoprotein Cholesterol; HDL-C: High-Density Lipoprotein Cholesterol; TC: Total Cholesterol; TG: Triglycerides.
Fig. 3
Fig. 3. Taxonomic alterations of the human gut microbiome during dietary intervention.
A Percentage of fecal microbiome variation explained by time, macronutrient, clinical indicators and anthropometric data by the PERMANOVA model (two-sided) based on Bray-Curtis distances in two groups separately. Red variable names represent significant Treatment × Time interaction effects. *p < 0.05, **p < 0.01, ***p < 0.001. (IG: Time 0.001, Fat 0.01, Energy 0.002, CHO 0.004, Fiber 0.002, Sodium 0.002, TC 0.001, HDL 0.005, LDL 0.001, OGTT 2 h glucose 0.027, OGTT 2 h glucose insulin 0.038, Neck 0.013, Pulse 0.049; CG: Time 0.025, BMI 0.005, Weight 0.007). CHO: Carbohydrate; HbA1c: glycated hemoglobin A1c; HOMA-IR: Homeostatic Model Assessment of Insulin Resistance; LDL-C: Low-Density Lipoprotein Cholesterol; HDL-C: High-Density Lipoprotein Cholesterol; TC: Total Cholesterol; TG: Triglycerides; FG: Fasting Glucose. BC Principal coordinate analysis of Bray-Curtis distances. The axes are labeled with the percent variance explained. R2 values and p-values were calculated from the two-side PERMANOVA test. B Colors are filled according to different groups; C Colors are filled according to fiber intake. D Microbiome pairwise dissimilarity between weeks in each subject based on Bray-Curtis distances. The central line in each box represents the median. The bounds of the box indicate the interquartile range (IQR), with the lower bound at the 25th percentile (Q1) and the upper bound at the 75th percentile (Q3). The whiskers extend to the smallest and largest values within 1.5 × IQR from the box. Data points beyond the whiskers are considered outliers. *p < 0.05, **p < 0.01, ***p < 0.001 denote two-sided T-test p-values performed on every Wx_y to W0_2, where Wx_y represents the Bray-Curtis distance between samples collected at Wx and Wy (W2_4: 0.002; W4_8: 0.021; W8_12: 0.0097; W12_16: 0.014). Number of participants in IG over W0_2, n = 54; W2_4, n = 54; W4_8, n = 54; W8_12, n = 53; W12_16, n = 53; number of participants in CG over W0_2, n = 55; W2_4, n = 55; W4_8, n = 57; W8_12, n = 55; W12_16, n = 55. E Percentage of fecal microbiome variation explained by different time periods in both groups. Two-sided PERMANOVA test, **p(Time) < 0.01, ***p(Time) < 0.001. (W0_W2: IG 0.001, CG 0.009; W2_W16: IG 0.004, CG 0.147). F The taxa that are significantly changed over time in intervention and control groups (q(Treatment×Time) < 0.15 and q(Time) < 0.05). The values represent the Z scores of averages of study weeks and groups calculated per taxa. Change trend: positive responding species are annotated in pink and negative responding species are annotated in green. Upper panel: genus; lower panel: species. G-H Scatterplot of correlation between dietary fiber intake and significantly changed species (G) and genera (H) across all samples. Coefficients and adjusted p-values are derived from two-sided LMM (Eubacterium rectale: q = 6.95×10⁻⁵, β = 0.17; Ruminococcus torques: q = 3.5×10⁻⁴, β = -0.15; Roseburia faecis: q = 2.7×10⁻⁸, β = 0.28; Ruminococcus lactaris: q = 4.7×10⁻⁴, β = -0.15; Roseburia hominis: q = 4.6×10⁻³, β = 0.17; Parabacteroides distasonis: q = 4.7×10⁻⁴, β = -0.13; Lachnospiraceae unclassified: q = 6.95×10⁻⁵, β = 0.17; Bifidobacterium: q = 4.0×10⁻³, β = 0.16; Bilophila: q = 4.0×10⁻³, β = -0.17). p-values were adjusted for multiple hypothesis testing using the Benjamini-Hochberg procedure. The smooth curve represents the trend line fitted using Linear Model, and the shaded area indicates the 95% Confidence Interval.
Fig. 4
Fig. 4. Alterations in gut bacterial fermentation of carbohydrates, SCFA profile and other functions.
A The glycoside hydrolase genes that have significantly different progression profiles in the IG compared with the CG identified by LinDA (q(Treatment×Time) < 0.05 and q(Time) < 0.05). The values represent the Z scores of averages of study weeks and groups calculated per enzyme. B Correlation of blood glucose and lipid levels with intestinal and plasma SCFAs in two groups respectively. *q < 0.05, **q < 0.01, and ***q < 0.001. HbA1c: glycated hemoglobin A1c; HOMA-IR: Homeostatic Model Assessment of Insulin Resistance; LDL-C: Low-Density Lipoprotein Cholesterol; HDL-C: High-Density Lipoprotein Cholesterol; TC: Total Cholesterol; TG: Triglycerides; FG: Fasting Glucose. C Bubble chart of gene enrichment analyses for genes significantly changed in the IG. Size of circle denotes number of genes in the pathway, colored by adjusted p-values. D Changes in genes involved in each step of the histidine degradation pathway. Data presented as mean ± standard error. #q (Treatment×Time) < 0.05, ##q (Treatment×Time) < 0.01 denote q-values for the Treatment × Time interaction coefficient (hutH: W16 0.03; hutU: W16 0.008; hutI: W12 0.01, W16 0.002; hutG: W12 0.01, W16 0.002); *q (Time) < 0.05, **q (Time) < 0.01, and ***q (Time) < 0.001 denote q-values for the time coefficient within the same group. hutH: histidine ammonia-lyase; hutU: urocanate hydratase; hutI: imidazolonepropionase; hutG: formiminoglutamase. Number of participants in IG over weeks: week 0, n = 54; week 2, n = 54; week 4, n = 54; week 8, n = 54; week 12, n = 53; week 16, n = 54; number of participants in CG over weeks: week 0, n = 57; week 2, n = 55; week 4, n = 57; week 8, n = 57; week 12, n = 56; week 16, n = 57. E Changes in histidine degradation pathway abundance annotated by HUMAnN3. Data presented as mean ± standard error. #q (Treatment×Time) < 0.05 denote q-values for the Treatment × Time interaction coefficient; ***q (Time) < 0.001 denote q-values for the time coefficient within the same group. Number of participants in IG over weeks: week 0, n = 54; week 2, n = 54; week 4, n = 54; week 8, n = 54; week 12, n = 53; week 16, n = 54; number of participants in CG over weeks: week 0, n = 57; week 2, n = 55; week 4, n = 57; week 8, n = 57; week 12, n = 56; week 16, n = 57. F Contribution of species to the histidine degradation pathway.
Fig. 5
Fig. 5. Alterations in fecal and blood metabolite levels.
A Principal coordinate analysis of fecal and plasma metabolome based on Bray-Curtis distances. R2 values and p-values were calculated from the two-sided PERMANOVA test. All three time points share the same axes, showing the first two principal coordinates and labeled with the percent variance explained. B, C Heatmap of q-values and beta coefficients of fecal metabolites (B) and plasma metabolites (C) across the whole study period. *q (Time) < 0.05, **q (Time) < 0.01, and ***q (Time) < 0.001 denote p-adjusted values for the time coefficient from the LMM model (two-sided) performed seperately for each group. p-values were adjusted for multiple hypothesis testing using the Benjamini-Hochberg procedure. See Supplementary Data 1 for full names of metabolite abbreviations.
Fig. 6
Fig. 6. Interactions between microbiota, metabolites and blood biomarkers.
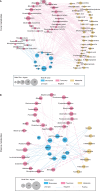
Network diagram illustrating correlations among taxonomy, metabolites, and clinical indicators at all time points in the IG. (A) for fecal metabolites; B for plasma metabolites. Network analysis involving significantly altered taxonomy (species and genera) and metabolites: displaying links with q(Treatment×Time) < 0.25 and q(Time) < 0.05. Node size reflects connection count and colors represent different data types. Line width between nodes signifies correlation strength, and colors indicate correlation direction. See Supplementary Data 1 for full names of metabolite abbreviations and The Human Metabolome Database (HMDB) numbers.
Fig. 7
Fig. 7. Mediation analysis identifies linkages between the species, metabolites and blood biomarkers.
A Parallel coordinates chart showing the 33 mediation effects of the fecal metabolites that were significant at q < 0.05. Shown are taxonomy (left), fecal metabolites (middle) and clinical outcomes (right). The curved lines connecting the panels indicate the mediation effects, with colors corresponding to different metabolites. B Mediation effect of some highlighted fecal metabolites on the levels of HbA1c and TC. C Parallel coordinates chart showing the 14 mediation effects of the plasma metabolites that were significant at q < 0.05. Shown are taxonomy (left), plasma metabolites (middle) and clinical outcomes (right). The curved lines connecting the panels indicate the mediation effects, with colors corresponding to different metabolites. D Mediation effect of some highlighted plasma metabolites on the levels of LDL-C and TC. For (B) and (D), the grey lines indicate the associations between the two factors, with corresponding LMM coefficients and q-values. Direct mediation is shown by a red arrow and reverse mediation is shown by a blue arrow. Corresponding q-values from mediation analysis are shown. See Supplementary Data 1 for full names of metabolite abbreviations and HMDB numbers.

References

    1. Khan, M. A. B. et al. Epidemiology of Type 2 Diabetes - Global Burden of Disease and Forecasted Trends. J. Epidemiol. Glob. Health10, 107–111 (2020). - PMC - PubMed
    1. Saeedi, P. et al. Global and regional diabetes prevalence estimates for 2019 and projections for 2030 and 2045: Results from the International Diabetes Federation Diabetes Atlas, 9th edition. Diabet. Res. Clin. Pract.157, 107843 (2019). - PubMed
    1. Neuenschwander, M. et al. Role of diet in type 2 diabetes incidence: umbrella review of meta-analyses of prospective observational studies. BMJ366, l2368 (2019). - PMC - PubMed
    1. Esposito, K. et al. Which diet for prevention of type 2 diabetes? A meta-analysis of prospective studies. Endocrine47, 107–116 (2014). - PubMed
    1. Kris-Etherton, P. M., Etherton, T. D., Carlson, J. & Gardner, C. Recent discoveries in inclusive food-based approaches and dietary patterns for reduction in risk for cardiovascular disease. Curr. Opin. Lipido.13, 397–407 (2002). - PubMed

Publication types

Associated data