. 2025 Jan 22;16(1):944.
doi: 10.1038/s41467-025-56133-0.

Metabolic interactions underpinning high methane fluxes across terrestrial freshwater wetlands

Affiliations

Metabolic interactions underpinning high methane fluxes across terrestrial freshwater wetlands

Emily K Bechtold et al. Nat Commun. .

Abstract

Current estimates of wetland contributions to the global methane budget carry high uncertainty, particularly in accurately predicting emissions from high methane-emitting wetlands. Microorganisms drive methane cycling, but little is known about their conservation across wetlands. To address this, we integrate 16S rRNA amplicon datasets, metagenomes, metatranscriptomes, and annual methane flux data across 9 wetlands, creating the Multi-Omics for Understanding Climate Change (MUCC) v2.0.0 database. This resource is used to link microbiome composition to function and methane emissions, focusing on methane-cycling microbes and the networks driving carbon decomposition. We identify eight methane-cycling genera shared across wetlands and show wetland-specific metabolic interactions in marshes, revealing low connections between methanogens and methanotrophs in high-emitting wetlands. Methanoregula emerged as a hub methanogen across networks and is a strong predictor of methane flux. In these wetlands it also displays the functional potential for methylotrophic methanogenesis, highlighting the importance of this pathway in these ecosystems. Collectively, our findings illuminate trends between microbial decomposition networks and methane flux while providing an extensive publicly available database to advance future wetland research.


Conflict of interest statement

Competing interests: The authors declare no competing interests.

Figures

Fig. 1
Fig. 1. 9 freshwater wetlands were examined to determine linkages between microbial communities and predictions of methane flux.
a Figure modified from Delwiche et al. shows the mean annual methane (CH4) flux from wetlands included in FLUXNET-CH4. The deviation of the predictions from observations indicates this abiotic variable incompletely represented CH4 flux, especially for the highest emitting wetlands. Colored points represent sites discussed in this study. Methane fluxes vary across an extremely large range, spanning many (3–5) orders of magnitude. For that reason, many statistical analyses of methane flux that compare multiple sites, some with high emissions and some with low emissions, use, and graph methane fluxes at a logarithmic scale. b Wetlands differ by type, size, geography, and climatic factors. In this study, we investigated 5 marsh sites (OWC, PPR P7, PPR P8, LA2, and TWI), 1 swamp (JLA), 1 fen (STM-fen), and 2 bogs (STM-bog and SPRUCE). 7 of the sites were found across the United States and 2 were in northern Sweden. Aerial images of each site were acquired from Google Earth. c Upset plot indicates the total number of 16S rRNA samples (n = 1112 samples) and their distribution across relevant categories including wetland type, sampling month, and sampling depth. Intersection size represents the number of samples found across each combination of wetland type, month, and sample depth scenario and set size represents the total number of samples found within each variable. Source data are provided as a Source Data file.
Fig. 2
Fig. 2. Methane-cycling microbes are conserved across wetlands.
a Wetland type is an important control on microbiome membership and structure, despite differences in sampling strategies and geographic locations. 16S rRNA amplicon data (n = 1112 samples) on soil microbial communities from marsh and swamp samples cluster together (rectangles and diamonds, most right side) and are statistically distinct from fen (triangle, middle, and most left side) and bog (circle, middle) microbial communities. b Core methane-cycling members across distinct wetlands calculated from 16S rRNA data. Heatmap shows the relative abundance of each genus within the methanogen (blue) or methanotroph (red) community across wetlands. To illuminate the metabolic features of these core taxa in high methane-emitting wetlands, we utilized the Multi-Omics for Understanding Climate Change (MUCC) v 2.0.0 database, with 140 MAGs assigned to our core taxa. Genome counts per genus are shown in the bar chart (black). MAGs were identified as methanogens if they encoded any genes of the Methyl Coenzyme Reductase (mcrABG) and/or Heterodisulfide reductase (hdrABCDE) complexes and as methanotrophs if they contain a gene that encodes a methane monooxygenase (Supplementary Data S4). Source data are provided as a Source Data file.
Fig. 3
Fig. 3. Methanogen co-occurrence patterns are related to methane flux.
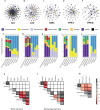
ae Co-occurrence network analysis revealed the network structure of methanogen-associated taxa across wetlands (n = 12 samples per site). Networks depicting site-specific co-occurrence analysis uncovered the network of microorganisms coordinated to methanogens across each site, with nodes representing microbial taxa. Larger nodes represent methanogens, while small nodes represent bacterial taxa. Nodes are colored by the inferred metabolic potential of 16S rRNA-linked MAGs within MUCC. White stars indicate the Methanoregula node in each network. Source data are provided as a Source Data file. fj The Proportion of connections between groups in each network is given in the bar charts and shows conserved patterns in network connections across sites. Missing bars indicate no connections. Correlation between network statistics and CH4 flux measurements derived from the Ameriflux network was measured for k whole community networks and l methanogen networks. Only the number of nodes in the methanogen network was correlated with methane flux. m Additionally, a negative correlation between annual CH4 residual and CH4 flux (from Fig. 1) to the number of methanogens, methanotrophs, and connections between the two were observed.
Fig. 4
Fig. 4. MUCC is a comprehensive cross-wetland database useful for multi-omics wetland studies.
Taxonomy of the 158 genera represented in the networks that are found within the MUCC database. Additionally, 6 methanogens and 9 methanotrophs were identified based on 16S rRNA included in the networks and are shown in the network with reduced opacity at the genus level. Circles around the edge represent inferred metabolic potential and squares represent the sites where the genus had significant co-occurrence with a methanogen.
Fig. 5
Fig. 5. Methanoregula presence and activity are important predictors of methane flux.
a A linear regression comparing the residual values from the methane flux to the temperature trend line showed a significant positive relationship to the relative abundance of Methanoregula within the methanogen community. b Genome tree of Methanoregula MAGs from MUCC (OWC, PPR, STM), plus available MAGS from JGI and GTDB (n = 149 Methanoregula MAGs). A pangenome analysis shows the largely conserved encoding of genes for key physiological features, as well as limited novel metabolic potential (e.g., methylotrophic genes) which may directly or indirectly support high methane fluxes from Methanoregula in wetlands. c Mean transcription of top five most active methanogenic genera at three depths (0–5 cm, 10–15 cm, 20–30 cm) in the mud site type across the 2018 sampling season predictive of CH4 fluxes (n = 43 metatranscriptomes).

References

    1. Poulter, B. et al. Global wetland contribution to 2000–2012 atmospheric methane growth rate dynamics. Environ. Res. Lett.12, 094013 (2017).
    1. Rosentreter, J. A. et al. Half of global methane emissions come from highly variable aquatic ecosystem sources. Nat. Geosci.14, 225–230 (2021).
    1. Bridgham, S. D., Cadillo-Quiroz, H., Keller, J. K. & Zhuang, Q. Methane emissions from wetlands: biogeochemical, microbial, and modeling perspectives from local to global scales. Glob. Chang. Biol.19, 1325–1346 (2013). - PubMed
    1. Laanbroek, H. J. Methane emission from natural wetlands: interplay between emergent macrophytes and soil microbial processes. A mini-review. Ann. Bot.105, 141–153 (2010). - PMC - PubMed
    1. Jackson, R. B. et al. Increasing anthropogenic methane emissions arise equally from agricultural and fossil fuel sources. Environ. Res. Lett.15, 071002 (2020).

LinkOut - more resources