. 2025 Jan 22;15(1):2838.
doi: 10.1038/s41598-024-82438-z.

Microbial carbon oxidation in seawater below the hypoxic threshold

Affiliations

Microbial carbon oxidation in seawater below the hypoxic threshold

Sarah Wolf et al. Sci Rep. .

Abstract

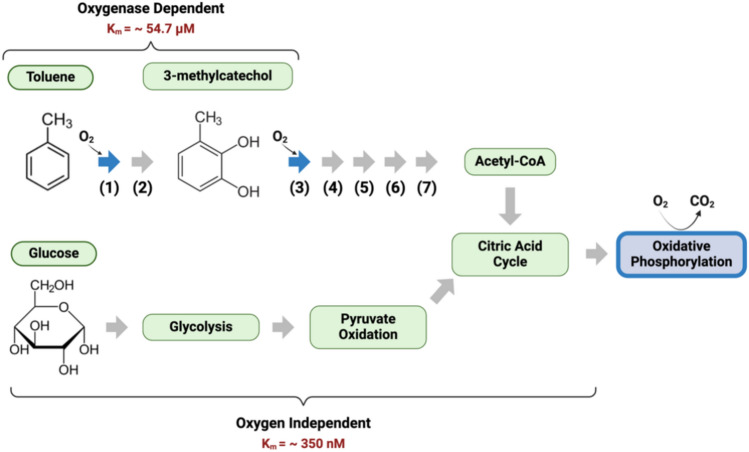
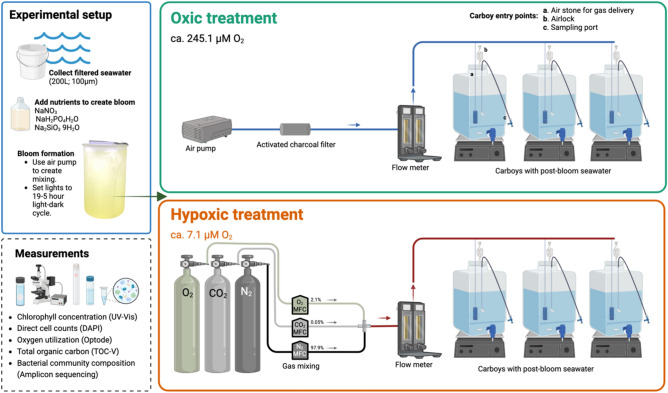
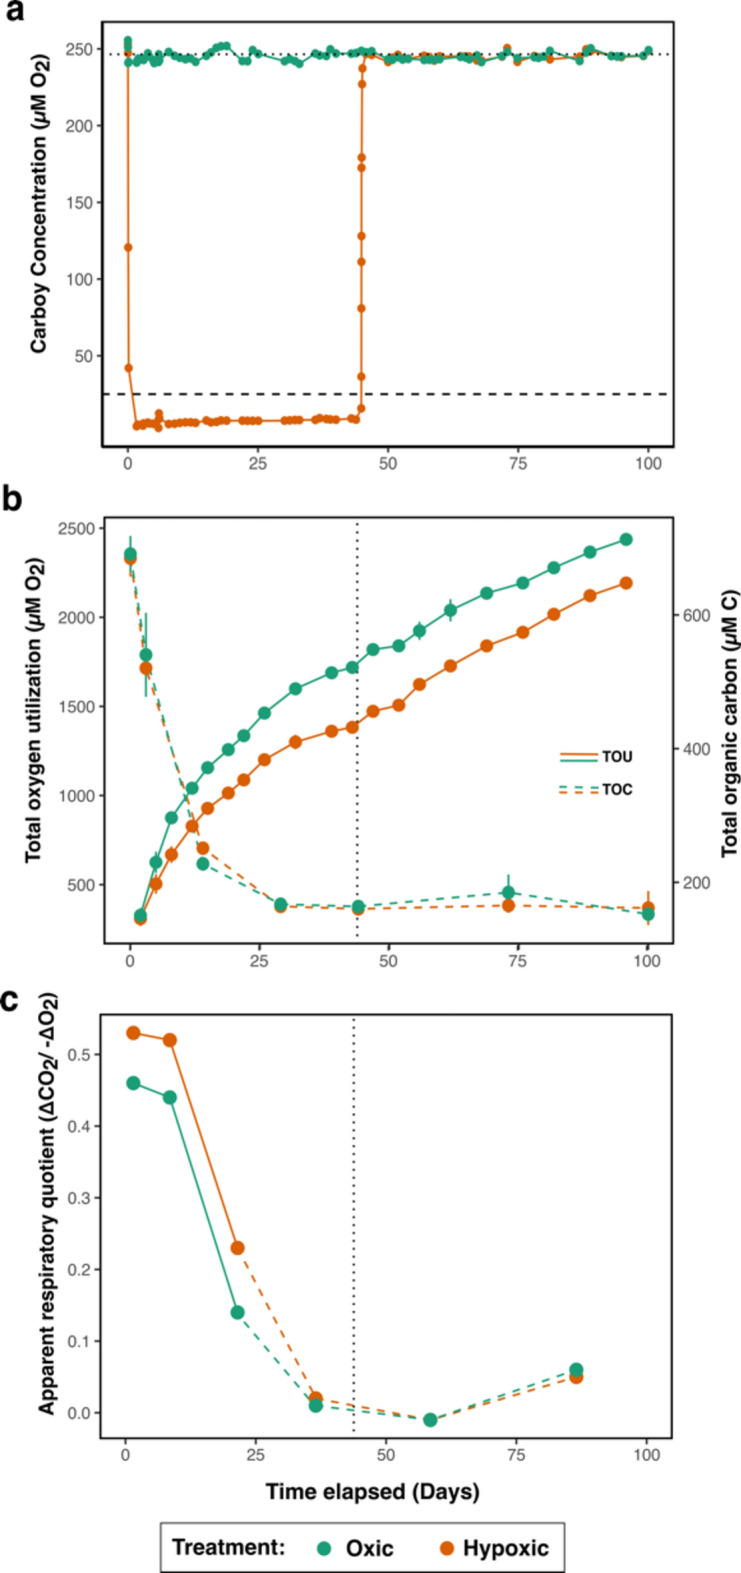
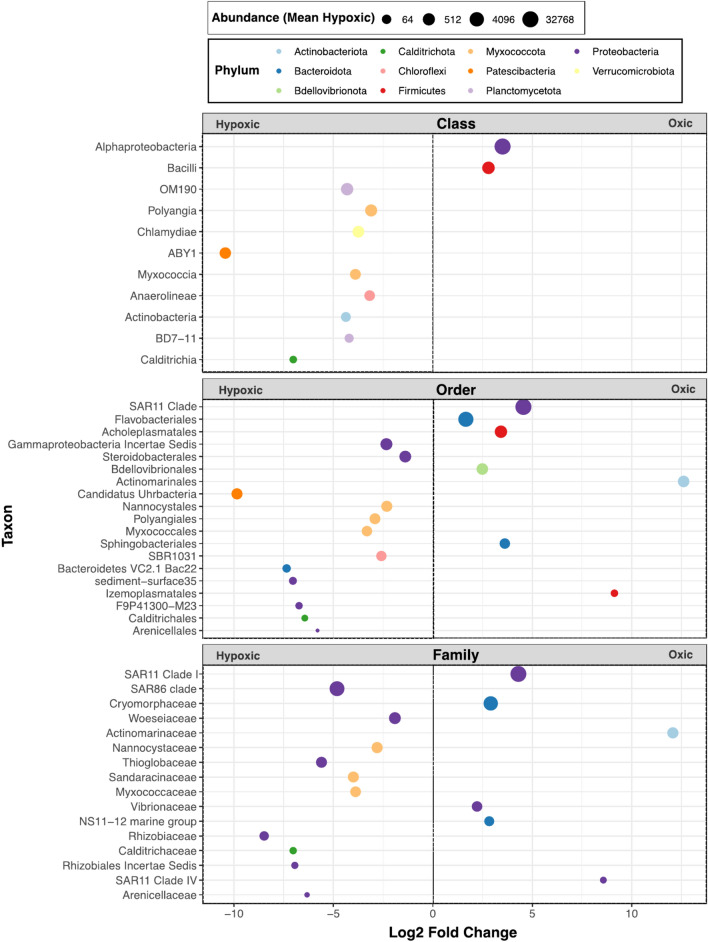
Global oxygen minimum zones (OMZs) often reach hypoxia but seldom reach anoxia. Recently it was reported that Michaelis Menten constants (Km) of oxidative enzymes are orders of magnitude higher than respiratory Km values, and in the Hypoxic Barrier Hypothesis it was proposed that, in ecosystems experiencing falling oxygen, oxygenase enzyme activities become oxygen-limited long before respiration. We conducted a mesocosm experiment with a phytoplankton bloom as an organic carbon source and controlled dissolved oxygen (DO) concentrations in the dark to determine whether hypoxia slows carbon oxidation and oxygen decline. Total oxygen utilization (TOU) in hypoxic treatment (ca. 7.1 µM O2) was 21.7% lower than the oxic treatment (ca. 245.1 µM O2) over the first 43 days of the experiment. In addition, following the restoration of fully oxic conditions to the hypoxic treatment, TOU accelerated, demonstrating that oxidative processes are sensitive to DO concentrations found in large volumes of the ocean. Microbial amplicon-based community composition diverged between oxic treatments, indicating a specialized microbiome that included Thioglobaceae (SUP05 Gammaproteobacteria), OM190 (Planctomycetota), ABY1 (Patescibacteria), and SAR86 subclade D2472, thrived in the hypoxic treatment, while the genus Candidatus Actinomarina and SAR11 alphaproteobacteria were sharply inhibited. Our findings support the hypothesis that oxygenase kinetics might slow the progression of ocean deoxygenation in oxygen-poor regions and be a factor in the evolution of microbial taxa adapted to hypoxic environments.


Conflict of interest statement

Declarations. Competing interests: The authors declare no competing interests.

Figures

Fig. 1
Fig. 1
Example of oxygenase-dependent and oxygenase independent catabolic pathways: toluene and glucose degradation pathway in Pseudomonas putida. Oxygen dependent enzymatic reactions are highlighted in blue (enzyme (1) and enzyme (2) and Terminal Cytochrome Oxidase). Oxygen dependent toluene degradation shown with a limiting Km of ca. 54.7 µM. Toluene dioxygenase and 3-methylcatechol-2,3-dioxygenase both involve the incorporation of oxygen into the substrate. Whole cell Km analysis with toluene as a substrate provided a Km of 23.1 µM for Burkholderia pickettii and a Km of 37.5 µM for Pseudomonas putida. The rate of toluene degradation by Pseudomonas putida has been shown to have a critical oxygen concentration between 20 and 30 µM. Extensive analysis of Km values for 1,2 and 2,3-catechol dioxygenase have been evaluated and shown to utilize 3-methylcatechol as a substrate with 13.36% activity. The average Km value for enzyme specific assays of 1,2-catechol dioxygenase is 61.9 ∓ 42.5 µM and 2,3-catechol dioxygenase is 50.6 ∓ 111.08 µM. Enzymes within toluene degradation pathway: (1) Toluene dioxygenase (2) Toluene-cis-dihydrodiol dehydrogenase (3) 3-methylcatechol 2,3-dioxygenase (4) 2-hydroxy-6-oxohepta-2,4-dienoate hydrolase (5) 2-keto-4-pentenoate hydratase (6) 4-hydroxy 2-oxovalerate aldolase (7) acetaldehyde dehydrogenase. Oxygen independent degradation of glucose when used as a substrate for glycolysis. Oxygen dependent oxidative phosphorylation with a limiting Km of ca. 350 nm. Toluene is an example of a class of dissolved organic matter (DOM) compounds referred to as “oxygenase-dependent DOM (ODDOM)” by Giovannoni et al. for which the rate of catabolism is proposed to slow by the above mechanism in ecosystems as they enter hypoxia.
Fig. 2
Fig. 2
Sample collection and mesocosm experimental design. Surface water from Hatfield Marine Science Center was filtered through 100 µm nylon mesh to remove zooplankton, supplemented with nitrate (441 µM NaNO3), phosphate (18 µM NaH2PO4H2O) silicate (53 µM Na2SiO39H2O), and incubated in the light to stimulate a phytoplankton bloom. After four days of incubation on light/dark cycle, water was transferred to six carboys, three per treatment. Carboys were positioned on stir plates to ensure continuous suspension of particulate organic matter throughout the incubation. The hypoxic carboys received 2.1% oxygen for the first 44 days of the experiment, and atmospheric oxygen thereafter.
Fig. 3
Fig. 3
Oxygen utilization and carbon oxidation. (a) Carboy oxygen was delivered consistently at an average concentration of 7.1 µM O2, which is less than the proposed hypoxic barrier of 25 µM O2 (dashed horizontal line). On day 43, the hypoxic treatment was increased to saturation to observe the response of the microbial community to the intrusion of O2. Horizontal dashed line represents the proposed hypoxic barrier (25 µM O2) and the horizontal dotted line represents 100% oxygen saturation (245.1 µM O2). (b) TOU (solid lines) over time reveals oxygen uptake during DOM degradation in hypoxic treatments is lower than in fully oxygenated water. This difference was not reversed by restoring full oxygenation. Black dotted vertical lines indicate the time of oxygen restoration to the hypoxic treatment. TOC concentrations (dashed lines) in both treatments drop despite a steady increase in TOU, suggesting O2 was potentially used by incomplete oxidation of the remaining DOM. Rates of oxygen utilization for individual dates can be found in Tables S6, S10. (c) Apparent respiratory quotient (ARQ; ∆CO2/− ∆O2). The dashed line indicates ARQ values below the range of commonly reported values.
Fig. 4
Fig. 4
Temporal dynamics of mesocosm microbial communities under hypoxic and oxic treatments. (a) Non-Metric Multidimensional Scaling (NMDS) plot of Bray–Curtis dissimilarities from 16S rRNA amplicon sequences (ASVs). Day -4 represents the initial community derived from a natural seawater inoculum from Yaquina Bay, while day 0 signifies the onset of oxygen delivery. The communities in the hypoxic and oxic treatments exhibit noticeable divergence over time, indicating a specialized microbiome colonized the hypoxic treatment between days 14–100. The divergence is canonically unexpected due to the ample oxygen availability at ca.7.1 µM O2. Stress value for the NMDS analysis was 0.07. (b) Microbial community composition at the family level. Microbial communities in oxic and hypoxic treatments showed initial similarities on day 0 but diverged notably by day 44. On day 44, the oxic treatment was dominated by SAR11 Clade 1, while the hypoxic treatment exhibited an increase in an unclassified SAR86 strain. At the terminal time point, both treatments displayed a predominance of an archaeal population of ammonia-oxidizing Nitrosopumilaceae.
Fig. 5
Fig. 5
Differential abundance of taxa across treatments on day 44. The taxa shown differed significantly (p = 0.05) between seawater exposed to hypoxic and oxic treatments on day 44. Positive values indicate taxa that were more abundant in the oxic treatment. ASVs were aggregated at the family level and categorized based on the most specific taxonomic classification available in the SILVA database. This approach was adopted to provide a comprehensive overview of microbial diversity between treatments across various taxonomic levels.

Similar articles

References

    1. Oschlies, A., Brandt, P., Stramma, L. & Schmidtko, S. Drivers and mechanisms of ocean deoxygenation. Nat. Geosci.11, 467–473. 10.1038/s41561-018-0152-2 (2018).
    1. Keeling, R. E., Kortzinger, A. & Gruber, N. Ocean deoxygenation in a warming world. Ann. Rev. Mar. Sci.2, 199–229. 10.1146/annurev.marine.010908.163855 (2010). - PubMed
    1. Schmidtko, S., Stramma, L. & Visbeck, M. Decline in global oceanic oxygen content during the past five decades. Nature542, 335–339 (2017). - PubMed
    1. Howarth, R. W. Nutrient limitation of net primary production in marine ecosystems. Ann. Rev. Ecol. Syst.19, 89–110 (1988).
    1. Duce, R. A. et al. Impacts of atmospheric anthropogenic nitrogen on the open ocean. Science320, 893–897 (2008). - PubMed

Publication types

LinkOut - more resources