. 2025 Jan 22;10(1):15.
doi: 10.1038/s41541-024-01056-y.

Saponin-based adjuvant uptake and induction of antigen cross-presentation by CD11b+ dendritic cells and macrophages

Affiliations

Saponin-based adjuvant uptake and induction of antigen cross-presentation by CD11b+ dendritic cells and macrophages

Lisa Gm Huis In 't Veld et al. NPJ Vaccines. .

Abstract

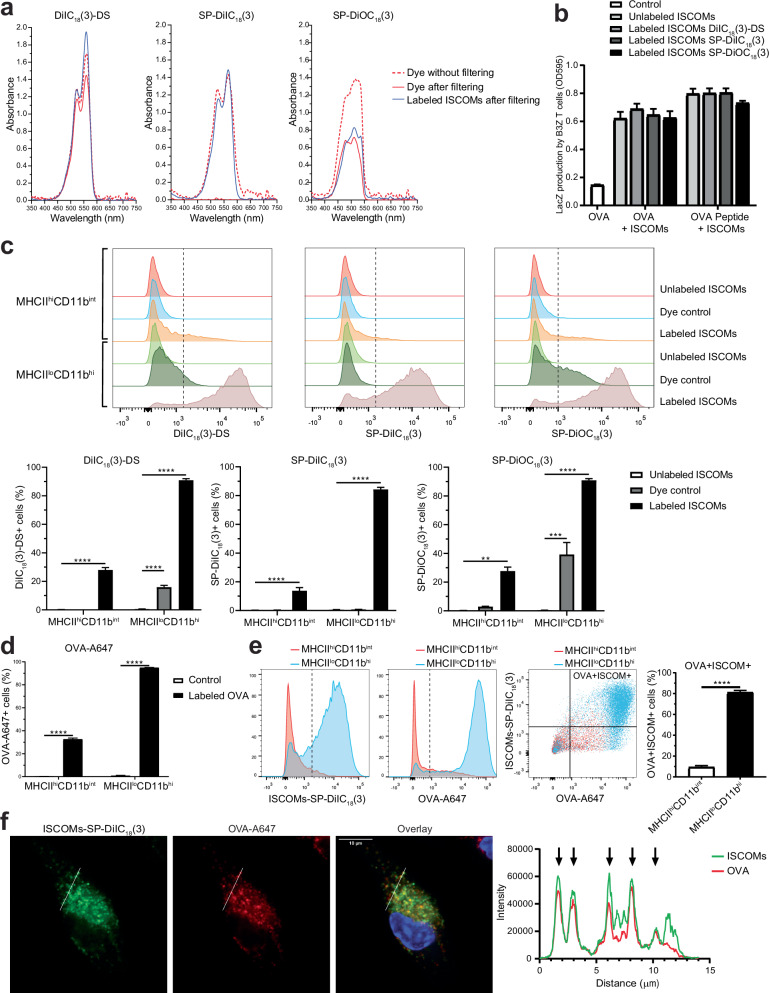
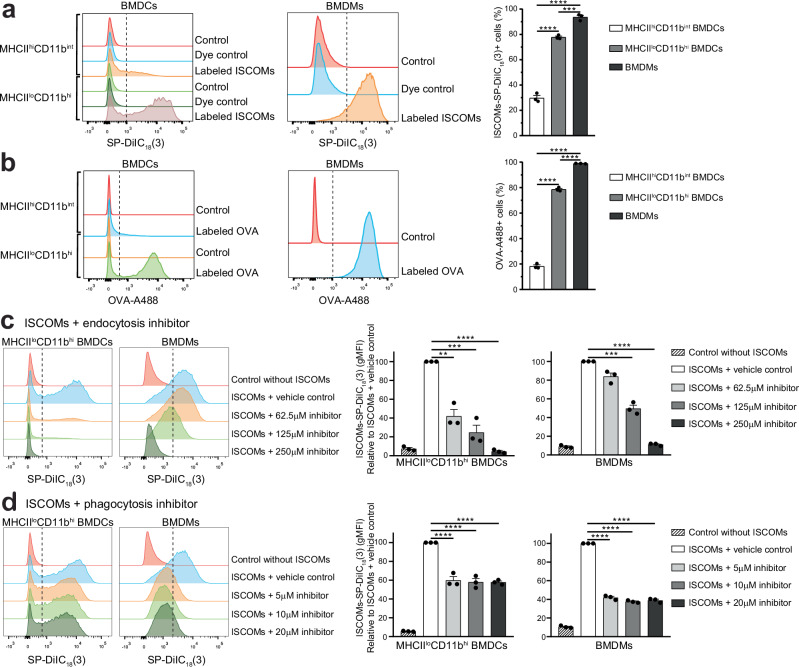
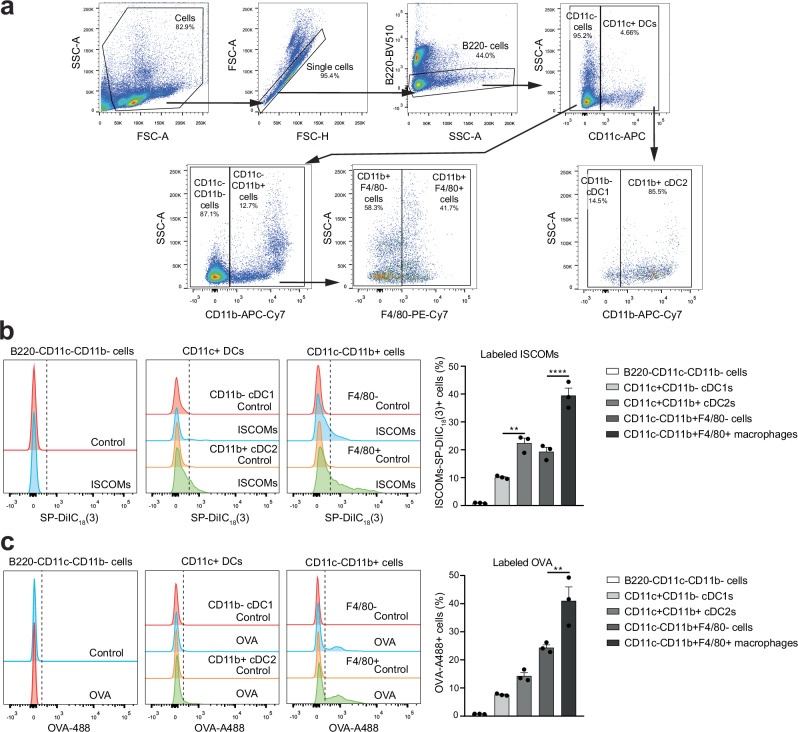
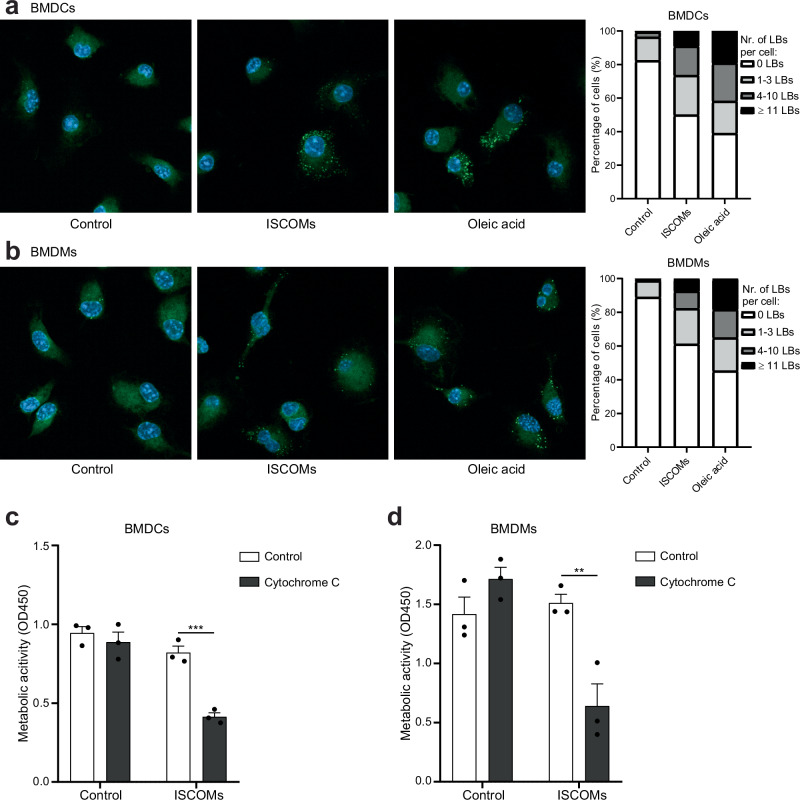
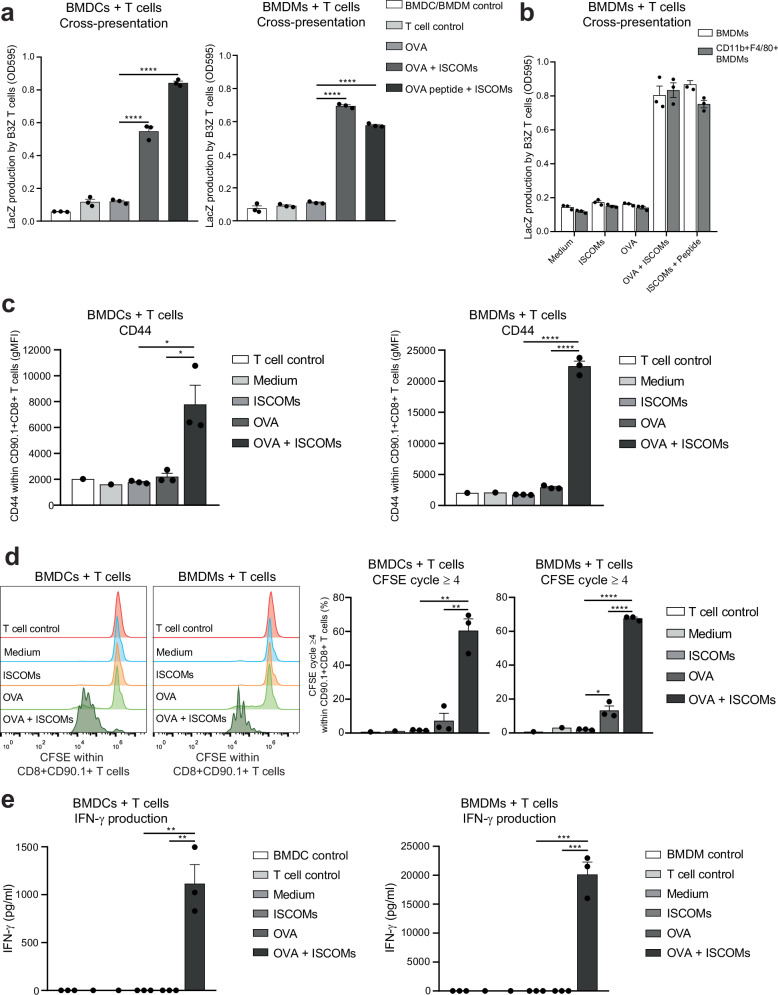
Saponin-based adjuvants (SBAs) distinguish themselves as vaccine adjuvants by instigating a potent activation of CD8+ T cells. Previously, we discovered SBA's ability to induce cross-presentation in dendritic cells (DCs) leading to CD8+ T cell activation. Moreover, the MHCIIloCD11bhi bone marrow-derived DC (BMDC) subset was identified to be the most responsive DC subset to SBA treatment. To further investigate SBA's mode of action, labeling of SBAs was optimized with the fluorescent dye SP-DiIC18(3). Efficient uptake of SBAs occurs specifically by MHCIIloCD11bhi BMDCs and bone marrow-derived macrophages (BMDMs) in vitro and cDC2s and macrophages ex vivo. Furthermore, SBAs are primarily taken up by clathrin-mediated endocytosis and uptake induces lipid bodies and antigen translocation to the cytosol in MHCIIloCD11bhi BMDCs and BMDMs. Importantly, BMDMs treated with SBAs exhibit cross-presentation leading to potent CD8+ T cells activation. Our findings explain the potency of SBAs as vaccine adjuvants and contribute to vaccine development.


Conflict of interest statement

Competing interests: The authors declare no competing interests.

Figures

Fig. 1
Fig. 1. Successful fluorescent labeling of ISCOMs.
Lipophilic fluorescent carbocyanine dyes were incubated with or without ISCOMs for 1 h at 37 °C, filtered using a 0.2 µm filter and absorbance was measured. The dye without filtering (red dotted line), the dye after filtering (red line) and the labeled ISCOMs after filtering (blue line) are shown (a). BMDCs were incubated with OVA protein and with unlabeled ISCOMs or ISCOMs labeled with DiIC18(3)-DS, SP-DiIC18(3) or SP-DiOC18(3) for 5 h and co-cultured with B3Z T cells for 18 h as a read out for cross-presentation. As a positive control, BMDCs were pulsed with OVA peptide for 30 min before co-culture with B3Z T cells (b). BMDCs were incubated for 1 h at 37 °C with ISCOMs labeled with DiIC18(3)-DS, SP-DiIC18(3) or SP-DiOC18(3) and/or OVA-A647, then stained for CD11c, MHCII and CD11b and analyzed using flow cytometry (ce). Uptake of labeled ISCOMs (c) or OVA-A647 (d) or both (e) is shown for MHCIIhiCD11bint and MHCIIloCD11bhi BMDCs. As a control, BMDCs were incubated with unlabeled ISCOMs, the corresponding dye without ISCOMs (Dye control) (c), or without ISCOMs nor OVA (Control) (d). BMDCs were incubated for 1 h at 37 °C with ISCOMs labeled with SP-DiIC18(3) (green) and OVA-A647 (red), stained with DAPI (blue), and analyzed with confocal microscopy. A line was drawn in the confocal images and the intensity of ISCOMs-SP-DiIC18(3) and OVA-A647 is quantified on the right. Each arrow indicates co-localization (f). Absorbance is shown for 1 labeling and is representative for all ISCOM labeling performed (a). Assays were performed with 3 biological replicates. Similar results were obtained in two to three independent experiments. Significance is shown as: not significant p > 0.05, *p ≤ 0.05, **p ≤ 0.01, ***p ≤ 0.001, ****p ≤ 0.0001.
Fig. 2
Fig. 2. ISCOMs are highly taken up by MHCIIloCD11bhi BMDCs and BMDMs primarily via clathrin-mediated endocytosis.
BMDCs and BMDMs were incubated for 1 h at 37 °C with ISCOMs-SP-DiIC18(3) (a) or OVA-A488 (b). As a control, BMDCs and BMDMs were incubated without ISCOMs nor OVA (Control) (ab) or with SP-DiIC18(3) without ISCOMs (Dye control) (a). BMDCs and BMDMs were pre-incubated for 10 min with clathrin-mediated endocytosis inhibitor monodansylcadaverine or with actin polymerization and phagocytosis inhibitor cytochalasin D or the respective vehicle control (concentrations shown in the figure) and subsequent incubation with ISCOMs-SP-DiIC18(3) for 1 h at 37 °C in presence of the specific inhibitor. Quantification is shown relative to cells treated with the vehicle control (c, d). Assays were performed with 3 biological replicates. Flow cytometry histograms are shown for 1 representative replicate and quantification is shown for 3 biological replicates. Similar results were obtained in two to three independent experiments. Significance is shown as: not significant p > 0.05, *p ≤ 0.05, **p ≤ 0.01, ***p ≤ 0.001, ****p ≤ 0.0001.
Fig. 3
Fig. 3. ISCOMs are taken up by cDC2s and macrophages isolated from spleen.
Spleens were isolated, processed to single cells, incubated for 1 h with ISCOMs-SP-DiIC18(3) or OVA-A488, then stained for B220, CD11c, CD11b and F4/80 and measured by flow cytometry (ac). Flow cytometry gating for CD11c+ CD11b- cDC1s, CD11c+CD11b+ cDC2s, B220-CD11c-CD11b- cells, CD11c-CD11b+F4/80- cells, and CD11c-CD11b+F4/80+ macrophages in the spleen (a). ISCOM+ cells or OVA+ cells were analyzed within the different immune subsets in the spleen and quantified (b, c). Percentages of each gate are shown as frequency of the corresponding parent gate. Assays were performed with 3 biological replicates. Flow cytometry histograms are shown for 1 representative replicate and quantification is shown for 3 biological replicates combined. Similar results were obtained in two to three independent experiments. Significance is shown as: not significant p > 0.05, *p ≤ 0.05, **p ≤ 0.01, ***p ≤ 0.001, ****p ≤ 0.0001.
Fig. 4
Fig. 4. ISCOMs induce LBs and antigen translocation in BMDCs and BMDMs.
BMDC and BMDMs were untreated or treated with ISCOMs or oleic acid for 5 h. Confocal images: nuclear DAPI (blue) and BODIPY 493/503 LBs (green). Representative confocal images and the percentage of cells with 0, 1–3, 4–10 or ≥11 LBs per cell are shown (a, b). BMDC and BMDMs were untreated or treated with ISCOMs without or with cytochrome c for 5 h and metabolic activity and cell viability was then measured with a CCK8 assay which acts as a read out for antigen translocation (c, d). For LB stainings, every condition contains >50 cells per replicate. LB staining and antigen translocation assays were performed with 3 biological replicates. Similar results were obtained in two to three independent experiments. Significance is shown as: not significant p > 0.05, *p ≤ 0.05, **p ≤ 0.01, ***p ≤ 0.001, ****p ≤ 0.0001.
Fig. 5
Fig. 5. ISCOMs induce cross-presentation and CD8+ T cell priming in BMDCs and BMDMs.
BMDCs or BMDCs were incubated with OVA protein in combination with or without ISCOMs for 5 h and then co-cultured with B3Z T cells for 18 h. As a positive control, ISCOM-treated BMDCs or BMDMs were pulsed with OVA peptide for 30 min before co-culture with B3Z T cells (a). Total unsorted BMDMs or FACS-sorted CD11b+F4/80+CD11c- BMDMs were incubated with OVA protein with or without ISCOMs for 5 h and then co-cultured with B3Z T cells for 18 h. As a positive control, ISCOM-treated unsorted or sorted BMDMs were pulsed with OVA peptide for 30 min before co-culture with B3Z T cells (b). OT-I T cell activation assay: BMDCs and BMDMs were incubated with OVA and/or ISCOMs, and co-cultured for 72 h with CFSE-labeled CD8+CD90.1+ T cells isolated from OT-I transgenic mice (ce). Marker expression of CD44 is shown within CD8+CD90.1+ T cells after 72 h of co-culture (c). CFSE staining as read out for proliferation within CD8+CD90.1+ T cells (left panel) and the percentage of T cells which proliferated four or more times (right panel) after 72 h of co-culture (d). IFN-γ production measured in the supernatant after 72 h of co-culture (e). Assays were performed with 3 biological replicates. Medium controls and T cell controls (ce) were performed with 1 biological replicate and not used for statistics. Similar results were obtained in two to three independent experiments. Significance is shown as: not significant p > 0.05, *p ≤ 0.05, **p ≤ 0.01, ***p ≤ 0.001, ****p ≤ 0.0001.

Similar articles

Cited by

References

    1. den Brok, M. H. et al. Saponin-based adjuvants create a highly effective anti-tumor vaccine when combined with in situ tumor destruction. Vaccine30, 737–744 (2012). - PubMed
    1. Kensil, C. R., Patel, U., Lennick, M. & Marciani, D. Separation and characterization of saponins with adjuvant activity from Quillaja saponaria Molina cortex. J. Immunol.146, 431–437 (1991). - PubMed
    1. Morein, B., Sundquist, B., Höglund, S., Dalsgaard, K. & Osterhaus, A. Iscom, a novel structure for antigenic presentation of membrane proteins from enveloped viruses. Nature308, 457–460 (1984). - PubMed
    1. den Brok, M. H. et al. Saponin-based adjuvants induce cross-presentation in dendritic cells by intracellular lipid body formation. Nat. Commun.7, 13324 (2016). - PMC - PubMed
    1. Wilson, N. S. et al. ISCOMATRIX vaccines mediate CD8 T-cell cross-priming by a MyD88-dependent signaling pathway. Immunol. Cell Biol.90, 540–552 (2012). - PMC - PubMed

LinkOut - more resources