. 2025 Jan 22;10(1):5.
doi: 10.1038/s41536-025-00393-3.

Cryopreserved human alternatively activated macrophages promote resolution of acetaminophen-induced liver injury in mouse

Affiliations

Cryopreserved human alternatively activated macrophages promote resolution of acetaminophen-induced liver injury in mouse

Maria Elena Candela et al. NPJ Regen Med. .

Abstract

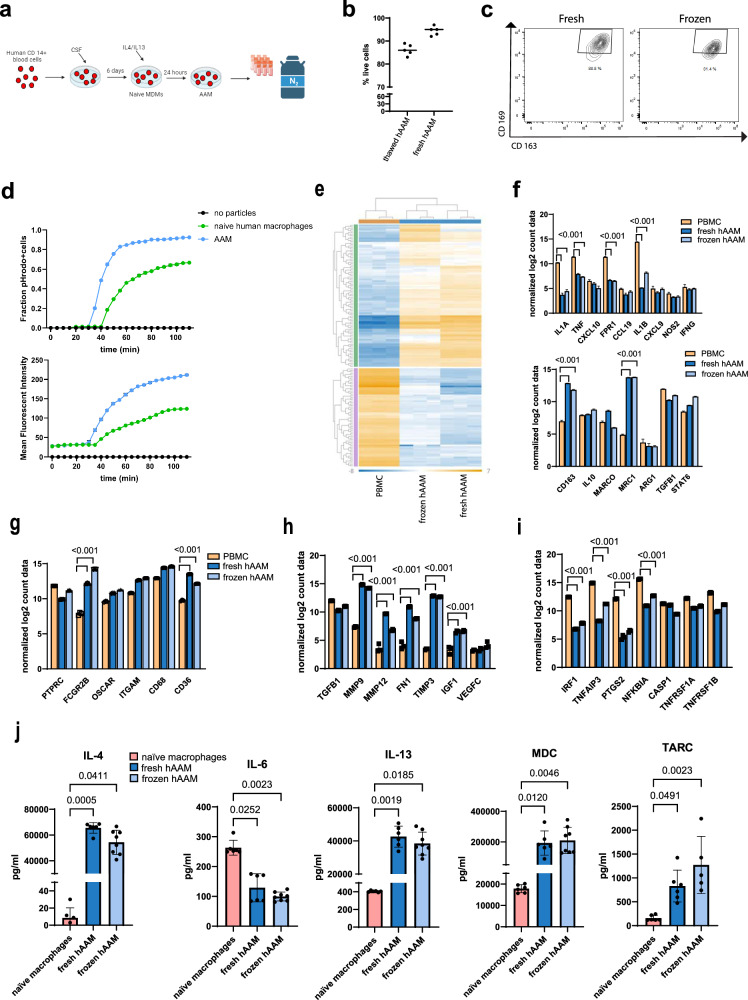
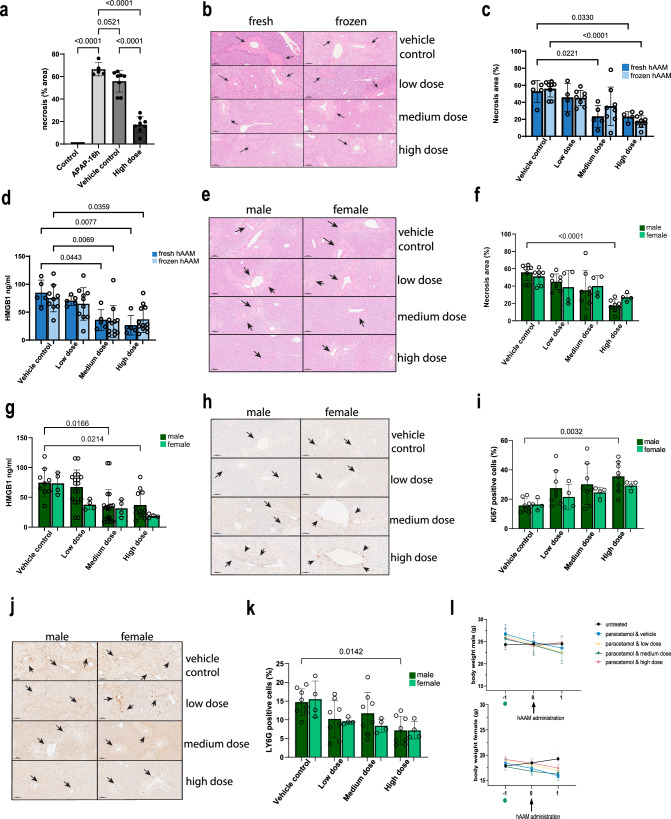
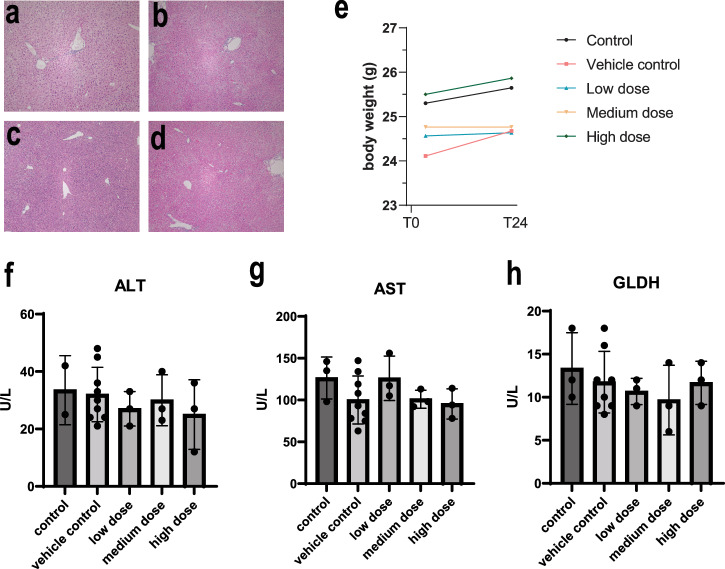
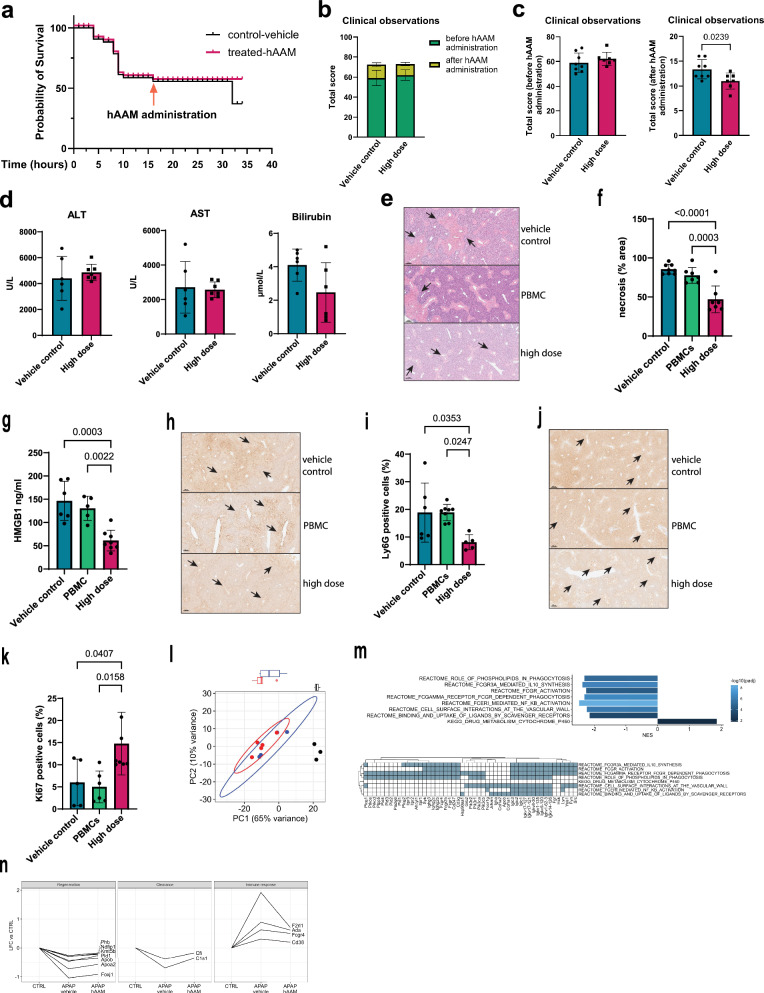
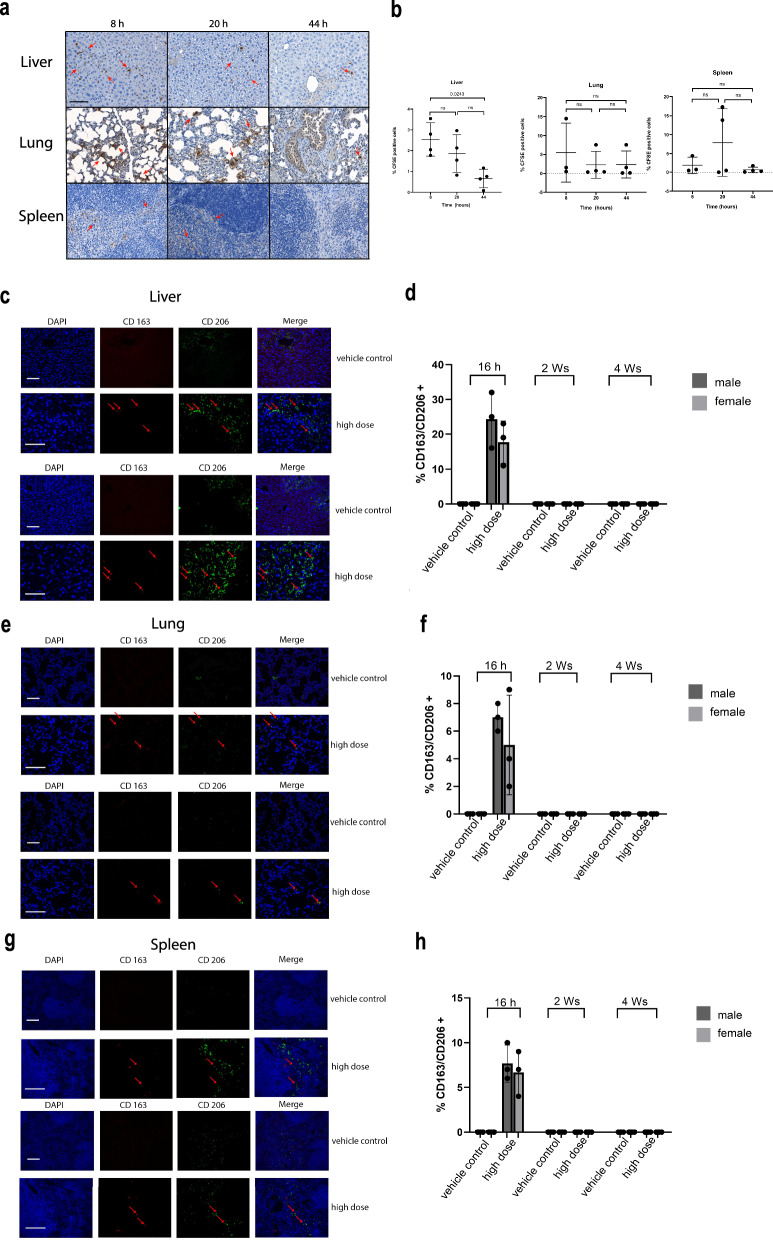
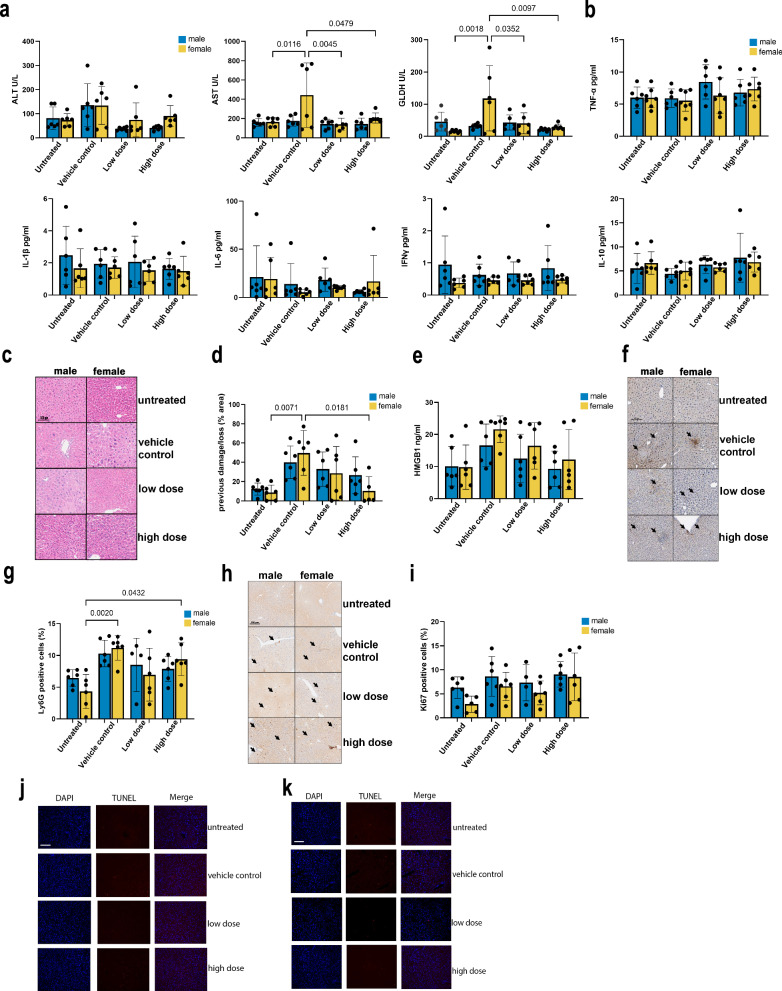
Acute liver failure is a rapidly progressing, life-threatening condition most commonly caused by an overdose of acetaminophen (paracetamol). The antidote, N-acetylcysteine (NAC), has limited efficacy when liver injury is established. If acute liver damage is severe, liver failure can rapidly develop with associated high mortality rates. We have previously demonstrated that alternatively, activated macrophages are a potential therapeutic option to reverse acute liver injury in pre-clinical models. In this paper, we present data using cryopreserved human alternatively activated macrophages (hAAMs)-which represent a potential, rapidly available treatment suitable for use in the acute setting. In a mouse model of APAP-induced injury, peripherally injected cryopreserved hAAMs reduced liver necrosis, modulated inflammatory responses, and enhanced liver regeneration. hAAMs were effective even when administered after the therapeutic window for NAC. This cell therapy approach represents a potential treatment for APAP overdose when NAC is ineffective because liver injury is established.


Conflict of interest statement

Competing interests: S.J.F. and P.J.S.L. are founders of Resolution Therapeutics, which is developing a macrophage cell therapy product to treat patients at risk of liver decompensation; A.M.K. is a consultant to Resolution Therapeutics. The remaining authors declare no competing interests.

Figures

Fig. 1
Fig. 1. Characterization of fresh and cryopreserved hAAMs.
a hMDMs were differentiated from CD14+ cells isolated from healthy volunteer buffy coats before incubation with hCSF-1 for 5 days. hAAMs were generated by stimulating hMDMs 24 h with hIL-4 and hIL-13, resuspended in Plasma-Lyte and stored at ≤−135 °C in liquid nitrogen. Created in BioRender. Candela, M. (2024) https://BioRender.com/y92e341. b Trypan Blue exclusion test performed on thawed and fresh hAAM. c Representative flow cytometry plots showing AAM macrophage markers CD169 and CD163 in fresh and thawed hAAM. d Phagocytosis quantification: pHrodo-positive cell fraction (up) and total cell MFI (down) conducted in human naive macrophages and hAAMs, for 180 min every 5 min. e Heatmap showing gene expression profiles of PBMCs, fresh hAAMs, and frozen hAAMs across a wide range of genes. The data show distinct clustering patterns for the different cell types, with fresh and frozen hAAMs sharing a similar transcriptional profile. f The top panel illustrates the expression level of key genes of pro-inflammatory macrophage markers in PBMCs, fresh hAAMs, and frozen hAAMs; the bottom panel illustrates the expression level of key genes of AAMs markers in PBMCs, fresh hAAMs, and frozen hAAMs. g Expression level of key phagocytosis-related genes in PBMCs, fresh hAAMs, and frozen hAAMs. h Expression of genes associated with regeneration in PBMCs, fresh hAAMs, and frozen hAAMs. i Expression levels of genes involved in apoptosis and cell survival in PBMCs, fresh hAAMs, and frozen hAAMs. j Expression of cytokines (IL-4, IL-6, IL-13, MDC, TARC) in fresh and frozen cell culture medium. Mean ± SD, n = 4–8; comparison was done with one-way ANOVA test or post hoc test, significant diff. among means (P < 0.05).
Fig. 2
Fig. 2. Efficacy of fresh/cryopreserved hAAM in male and female APAP mouse model.
a Necrosis quantification of liver tissues from APAP-ALI mice, injected with vehicle control or high dose of thawed hAAM (1 × 106). b Representative H&E liver staining from APAP-ALI mice receiving indicated treatments of fresh and frozen hAAM (low dose: 0.25 × 106, medium dose 0.5 × 106, and high dose 1 × 106) at 16 h after APAP injury. The black arrows indicate the damaged areas. c Necrosis quantification of liver tissues from APAP-ALI mice, injected with vehicle control or three different doses of fresh and thawed hAAM. d HMGB1 analysis of serum from APAP-ALI mice treated with vehicle control and the three doses of fresh and thawed hAAM. e Representative H&E liver staining from APAP-ALI male and female mice receiving indicated treatments of thawed hAAM (low dose: 0.25 × 106, medium dose 0.5 × 106, and high dose 1 × 106) at 16 h after APAP injury. The black arrows indicate the damaged areas. f Necrosis quantification of liver tissues from APAP-ALI male and female mice, injected with vehicle control or three different doses of thawed hAAM. g HMGB1 analysis of serum from APAP-ALI male and female mice treated with vehicle control and the three doses of thawed hAAM. h Representative Ly6G immunostaining in liver sections from APAP-ALI male and female mice receiving indicated treatments. The black arrows indicate the Ly6G-positive cells. i Quantification of Ly6G immunostaining of liver tissues from APAP-ALI male and female mice, injected with vehicle control or three different doses of thawed hAAM. j Representative Ki67 immunostaining in liver sections from APAP-ALI mice receiving indicated treatments. The black arrows indicate the Ki67-positive cells. k Quantification of Ki67 immunostaining of liver tissues from APAP-ALI mice, injected with vehicle control or three different doses of thawed hAAM. l Body weight of male (top panel) and female (bottom panel) mice measured pre- and post-thawed hAAM administration in all five groups, as shown in the legend. APAP was administrated on day −1 (green dot). Mean ± SD, n = 4–8; comparison was done with one-way ANOVA test or post hoc test, significant diff. among means (P < 0.05).
Fig. 3
Fig. 3. Higher doses of hAAMs do not induce any toxic effect in healthy mice.
Representative H&E staining of liver sections from healthy mice injected with vehicle control (a) and three different doses of thawed hAAM: (b) low dose: 1 × 106, (c) medium dose: 2 × 106, and (d) high dose: 3 × 106, for 24 h. e Mouse body weight was measured at T0, when the cells were injected, and T24, after 24 h. fh Serum ALT, AST, and GLDH activity measured in healthy mice receiving vehicle control and three different doses of thawed hAAM: low dose: 1 × 106, medium dose: 2 × 106 and (d) high dose: 3 × 106, for 24 h. Mean ± SD, n = 3–8; comparison was done with one-way ANOVA test or post hoc test, significant diff. among means (P < 0.05).
Fig. 4
Fig. 4. hAAMs efficacy in a severe model of APAP-ALI.
a Survival curve (32 h) of mice subjected to 500 mg/kg APAP injury, and administrated vehicle control (black line) or high dose of hAAM (1 × 106 cells) (red line) 16 h later, then culled 16 h after the treatment. b Total clinical observations score of mice, measured before and after hAAMs administration. Mice were assessed on five parameters (hunching, piloerection, neurological symptoms, responsiveness to touch, skin paleness, and breathing), with a score ranging from 0 to 3 (see Table 1); the total score represents the cumulative sum of all scores. APAP treatment and vehicle: vehicle control, APAP treatment, and high dose hAAMs: disease induction plus high dose hAAMs (1 × 106). Mean ± SD, n = 7–8. c Total clinical observations score of mice, measured before (left panel) and after (right panel) hAAMs administration. d Serum ALT, AST, and bilirubin levels measured 32 h post-injection in APAP-ALI mice receiving the indicated treatments (high dose of hAAM: 1 × 106 cells) and vehicle control 16 h post-APAP injury. e Representative H&E liver staining from APAP-ALI mice receiving indicated treatments of thawed hAAM (high dose 1 × 106) and PBMCs (high dose 1 × 106), and vehicle control, at 16 h after APAP injury. The black arrows indicate the damaged areas. f Necrosis quantification of liver tissues from APAP-ALI mice, treated with hAAM, PBMCs, and vehicle control. g HMGB1 analysis of serum from APAP-ALI mice treated with hAAM, PBMCs, and vehicle control. h Representative Ly6G immunostaining in liver sections from APAP-ALI mice receiving indicated treatments. The black arrows indicate the Ly6G-positive cells. i Quantification of Ly6G immunostaining of liver tissues from APAP-ALI mice, treated with hAAM, PBMCs, and vehicle control. j Representative Ki67 immunostaining in liver sections from APAP-ALI mice receiving indicated treatments. The black arrows indicate the Ki67-positive cells. k Quantification of Ki67 immunostaining of liver tissues from APAP-ALI mice treated with hAAM, PBMCs, and vehicle control. Mean ± SD, n = 7–8. Comparison was done with one-way ANOVA test or post hoc test, significant diff. among means (P < 0.05). l Principal component analysis of all RNA-seq samples, based on the 500 most variable genes. Ellipses represent 95% confidence for groups with ≥4 samples. Boxplots show the distribution of samples along PC1, split by treatment group. Black dot: CTRL, red dot: APAP-vehicle control, blue dot: APAP-hAAM. m Top panel: bar plot of selected Reactome and KEGG gene sets significantly enriched between APAP-Vehicle control and APAP-hAAM conditions. Normalized enriched score (NES) is plotted for each gene set; bars are colored by significance, adjusted for multiple comparisons. Bottom panel: Matrix of genes associated with ≥2 gene sets identified above. n Plots of log2 fold change (LFC) in APAP-Vehicle control and APAP-hAAM group mice compared to CTRL, for selected genes associated with regeneration, clearance, and immune response. Lines connect results for each gene. All genes have differential expression significant (FDR < 0.05) between CTRL and APAP-Vehicle control, but non-significant between CTRL and APAP-hAAM.
Fig. 5
Fig. 5. Rapid clearance of hAAMs from liver, lung, and spleen within two weeks post-administration.
a Representative staining of liver, lung, and spleen tissues for CFSE-labeled cells of APAP-ALI mice at 8, 20, and 44 h after 1 × 106 mAAMs administration. b Quantification of % CFSE positively stained nuclei in the liver, lung, and spleen tissues of APAP-ALI mice at 8, 20, and 44 h after 1 × 106 mAAMs administration. Mean ± SD, n = 3–4; one-Way-ANOVA with Brown-Forsythe and Welch multiple comparisons correction was performed to analyze for changes across time points within the same organ. c Representative double staining of CD163 (red), CD206 (green), and nuclei (blue) in liver tissue of APAP-ALI male (top panel) and female (bottom panel) mice at 16 h after vehicle control or hAAMs (high dose: 1 × 106) administration. Scale bars—100 μm. d Quantification of double-positive cells in the liver tissue for CD163 and CD206 at 16 h, 2 weeks, and 4 weeks after vehicle control or hAAMs (high dose: 1 × 106) administration in male and female APAP-ALI mice. e Representative double staining of CD163 (red), CD206 (green), and nuclei (blue) in lung tissue of APAP-ALI male (top panel) and female mice (bottom panel) at 16 h after vehicle control or hAAMs (high dose: 1 × 106) administration. Scale bars—100 μm. f Quantification of double-positive cells in the lung tissue for CD163 and CD206 at 16 h, 2 weeks, and 4 weeks after vehicle control or hAAMs (high dose: 1 × 106) administration in male and female APAP-ALI mice. g Representative double staining of CD163 (red), CD206 (green), and nuclei (blue) in spleen tissue of APAP-ALI male (top panel) and female mice (bottom panel) at 16 h after vehicle control or hAAMs (high dose: 1 × 106) administration. Scale bars—100 μm. h Quantification of double positive cells in the spleen tissue for CD163 and CD206 at 16 h, 2 weeks and 4 weeks after vehicle control or hAAMs (high dose: 1 × 106) administration in male and female APAP-ALI mice. Mean ± SD, n = 3; comparison was done with one-way ANOVA test or post hoc test, significant diff. among means (P < 0.05).
Fig. 6
Fig. 6. Efficacy and safety of cryopreserved hAAMs administration after 28 days in APAP-ALI mice.
a Serum ALT, AST, and GLDH activity measured after 28 days of the injection in APAP-ALI male and female mice receiving indicated treatments (hAAM low dose: 0.25 × 106 and high dose 1 × 106) and vehicle control at 16 h after APAP injury. b Serum concentrations of pro-inflammatory cytokines measured in APAP-ALI male and female mice receiving indicated treatments. c Representative H&E liver staining from APAP-ALI male and female mice receiving indicated treatments of thawed hAAM (low and high dose) and vehicle control. The black arrows indicate the damaged areas. d Necrosis quantification of liver tissues from APAP-ALI male and female mice, injected with vehicle control or two different doses (low and high) of thawed hAAM at 16 h after APAP injury. e HMGB1 analysis of serum from APAP-ALI male and female mice treated, after 16 h APAP injury, with vehicle control and the two doses (low and high) of thawed hAAM. f Representative Ly6G immunostaining in liver sections from APAP-ALI male and female mice receiving indicated treatments. The black arrows indicate the Ly6G-positive cells. g Quantification of Ly6G immunostaining of liver tissues from APAP-ALI male and female mice, injected with vehicle control or two different doses of hAAM (low and high) at 16 h of APAP injury. h Representative Ki67 immunostaining in liver sections from APAP-ALI male and female mice receiving indicated treatments. The black arrows indicate the Ki67-positive cells. i Quantification of Ki67 immunostaining of liver tissues from APAP-ALI male and female mice, injected with vehicle control or two different doses (low and high) of thawed hAAM. j, k Representation of Tunel staining of liver tissues from APAP-ALI male (j) and female mice (k), receiving indicated treatments. Mean ± SD, n = 6; comparison was done with one-way ANOVA test or post hoc test, significant diff. among means (P < 0.05).

Similar articles

Cited by

  • Temporal dichotomy of neutrophil function in acute liver injury and repair.
    Cartwright JA, Potey PMD, Livingstone E, Campana L, Starkey Lewis PJ, Oremek MEM, Gachanja NN, Rinaldi G, Aird RE, Man TY, Fernando AJ, Simpson JP, Homer NZM, Barth N, Addison M, Ashmore-Harris C, Candela ME, Kilpatrick AM, Vermeren M, Robb CT, Dorward DA, Lucas CD, Forbes SJ, Rossi AG. Cartwright JA, et al. JHEP Rep. 2025 Apr 11;7(7):101417. doi: 10.1016/j.jhepr.2025.101417. eCollection 2025 Jul. JHEP Rep. 2025. PMID: 40606123 Free PMC article.

References

    1. Arshad, M. A. & Bangash, M. N. Acute liver failure following paracetamol overdose. J. Intensive Care Soc.23, 244–251 (2022). - PMC - PubMed
    1. Lewis, J. H. Drug-induced and toxic liver disease. In: Handbook of Liver Disease. 10.1016/B978-0-323-47874-8.00010-9 (2018).
    1. Tanne, J. Paracetamol causes most liver failure in UK and US. BMJ332, 628.2 (2006).
    1. Plevris, J. N., Schina, M. & Hayes, P. C. Review article: the management of acute liver failure. Aliment. Pharmacol. Ther.12, 405–418 (1998). - PubMed
    1. Lancaster, E. M., Hiatt, J. R. & Zarrinpar, A. Acetaminophen hepatotoxicity: an updated review. Arch. Toxicol. 89, 193–199 (2015). - PubMed