. 2024 Dec 30;2(1):51.
doi: 10.1038/s44259-024-00071-2.

Antibiotic ecotoxicity and resistance risks in resource-constrained chicken and pig farming environments

Affiliations

Antibiotic ecotoxicity and resistance risks in resource-constrained chicken and pig farming environments

Fredrick Gudda et al. NPJ Antimicrob Resist. .

Abstract

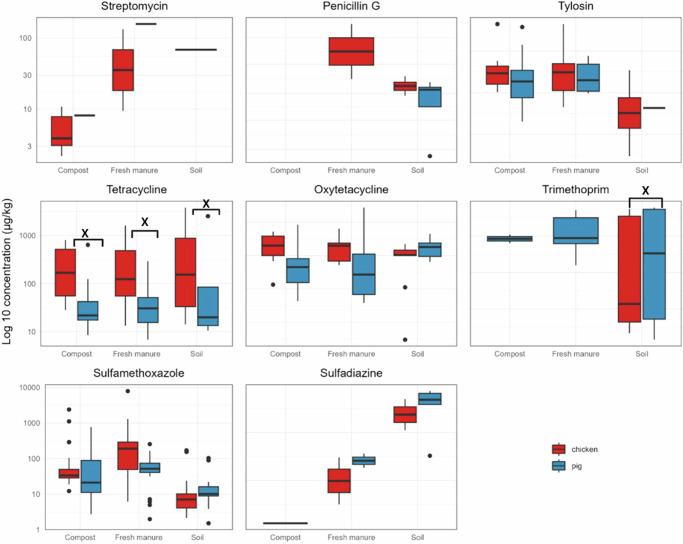
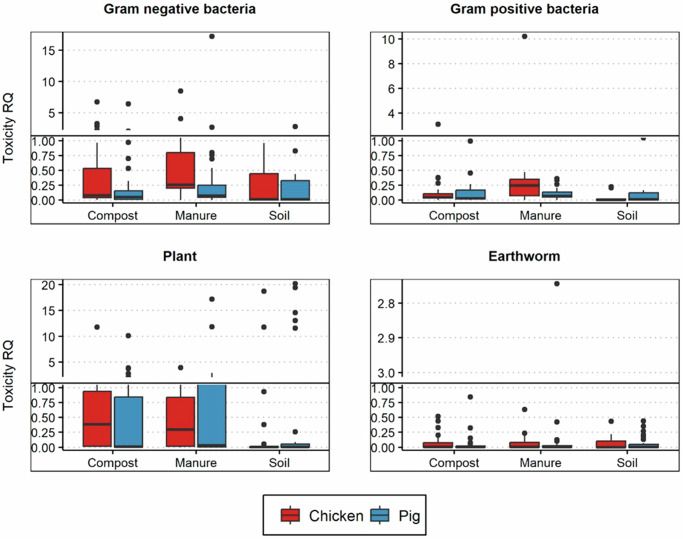
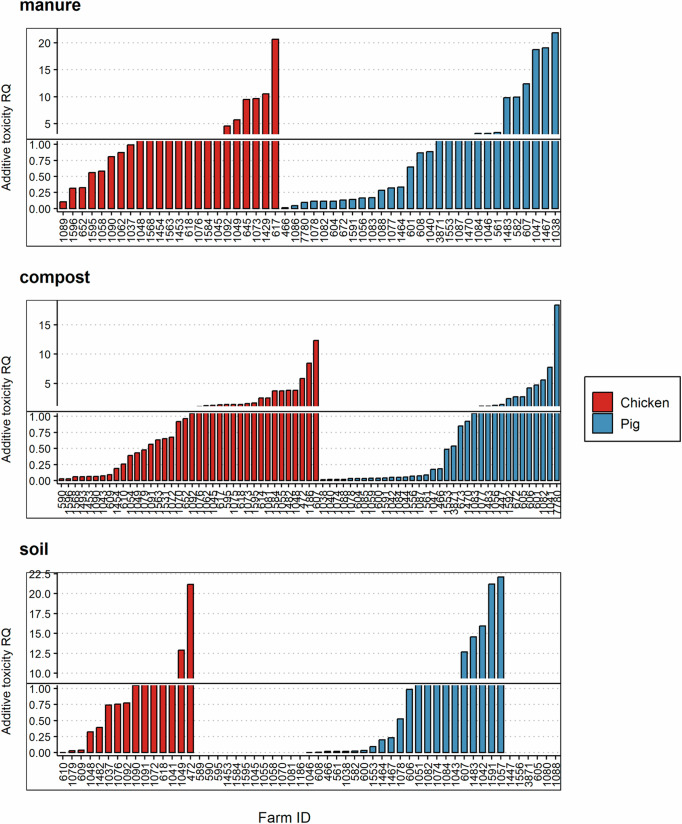
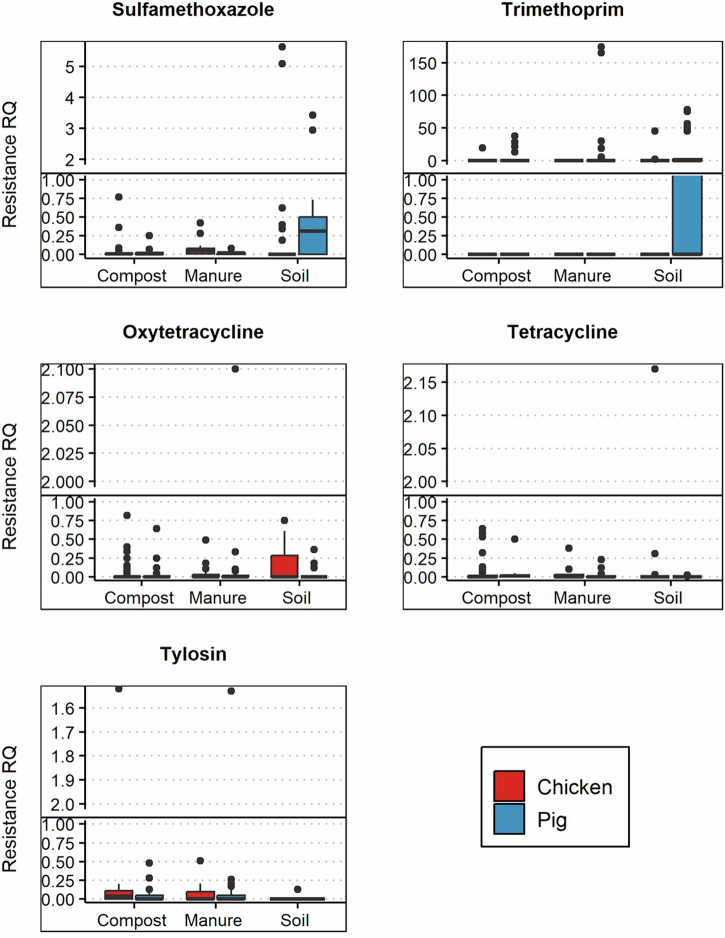
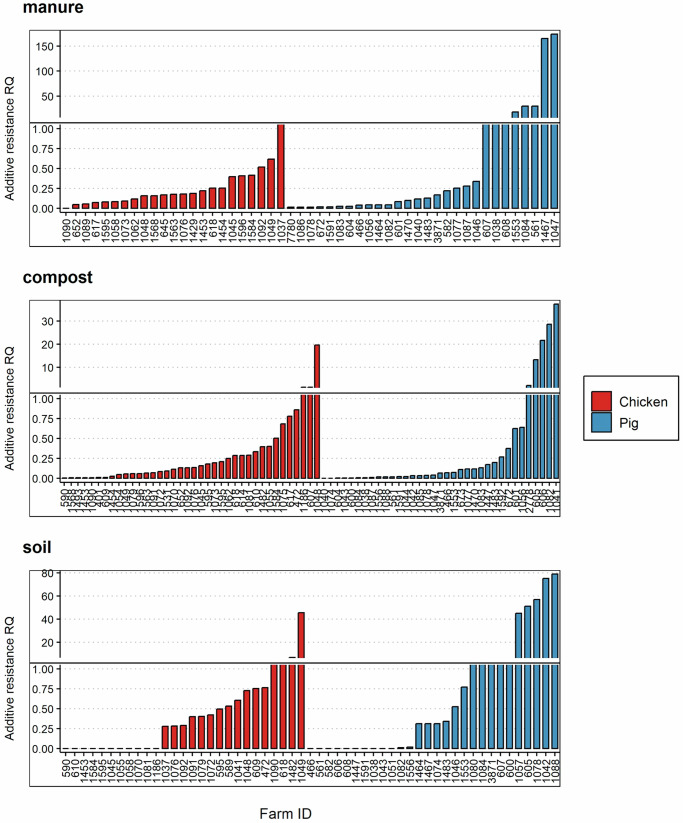
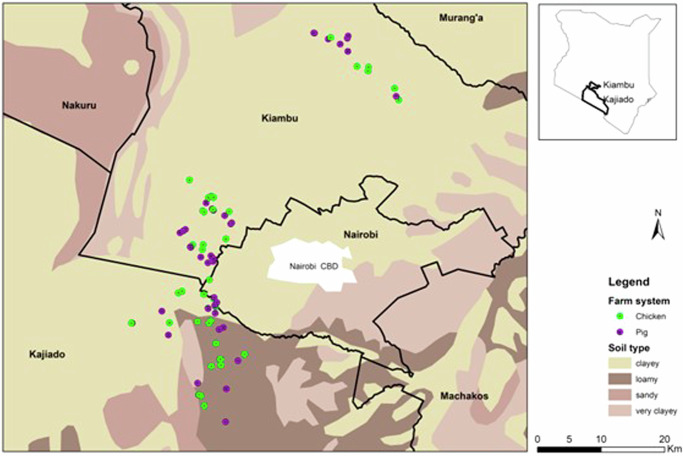
Antimicrobial resistance (AMR) data from agroecosystems in low- and middle-income countries is limited. We surveyed chicken (n = 52) and pig (n = 47) farms in Kenya to understand AMR in animal-environment pathways. Using LC-MS/MS, we validated the methods for analyzing eight common antibiotics and quantified the associated risks. Chicken compost (25.8%, n = 97/376) had the highest antibiotics prevalence, followed by pig manure-fertilized soils (23.1%, n = 83/360). The average antibiotic concentration was 63.4 µg/kg, which is below the environmentally relevant threshold (100 µg/kg), except for trimethoprim (221.4 µg/kg) among antibiotics and pig manure-fertilized soils (129.3 µg/kg) across sample types. Similarly, the average AMR risk quotient (RQ) was low (RQ < 0.1), except for trimethoprim and sulfamethoxazole (RQ ≥ 1). Ecotoxicity and AMR risks increased with flock size and the number of antibiotics used by pigs. Continuous environmental monitoring and large-scale studies on antibiotic contamination are crucial for evidence-based pollution control and the effective mitigation of environmental AMR.


Conflict of interest statement

Competing interests: The authors declare no competing interests.

Figures

Fig. 1
Fig. 1. Mean concentration of the antibiotics.
Relative concentration distribution of streptomycin, Penicillin G, tylosin, tetracycline, oxytetracycline, trimethoprim, sulfamethoxazole and sulfadiazine concentrations in compost, fresh manure, and soil organized by chicken and pig farm system. The horizontal lines inside the box represent the median concentration, upper and lower edges represent the 75th and 25th percentiles, respectively. The whiskers extending from the bottom and top sides of the box represent the lowest and the highest quantified concentrations and [X] above the box plots show significant differences between chicken and pig systems.
Fig. 2
Fig. 2. Ecotoxicity RQ of the antibiotics to gram-negative bacteria, gram-positive bacteria, plant roots, and earthworms.
The h-line denotes RQs above 1, representing high risk.
Fig. 3
Fig. 3. Additive ecotoxicity RQ per farm in manure, compost, and soil.
The results are derived from cumulative RQs of the test organism’s endpoints (earthworm, plant, gram-positive bacteria, and gram-negative bacteria) against the antibiotic (trimethoprim, sulfamethoxazole, tetracycline, oxytetracycline, and tylosin) concentration per farm. The h-line denotes RQs above 1, representing high risk.
Fig. 4
Fig. 4. Distribution of the resistance risk quotients across farms.
Distribution of resistance risk quotients of sulfamethoxazole, trimethoprim, oxytetracycline, tetracycline, and tylosin across environmental samples and production systems. “•” are outlier risk quotients. The h-line denotes RQs above 1, representing high risk.
Fig. 5
Fig. 5. Additive resistance RQ per farm in manure, compost, and soil.
The results are derived from cumulative RQs of all antibiotics quantified in a farm system. The h-line denotes RQs above 1, representing high risk.
Fig. 6
Fig. 6. Map of study area, farms and soil types.
Farm distribution in the selected sub-counties in Kiambu and Kajiado, Kenya. The soil type is also indicated.

Similar articles

References

    1. Yang, L. et al. Distinct increase in antimicrobial resistance genes among Escherichia coli during 50 years of antimicrobial use in livestock production in China. Nat. Food3, 197–205 (2022). - PubMed
    1. Peng, Z. et al. Whole-genome sequencing and gene sharing network analysis powered by machine learning identifies antibiotic resistance sharing between animals, humans and environment in livestock farming. PLoS Comput. Biol.18, e1010018 (2022). - PMC - PubMed
    1. Larsson, D. G. J. & Flach, C.-F. Antibiotic resistance in the environment. Nat. Rev. Microbiol.20, 257–269 (2021). - PMC - PubMed
    1. Lewnard, J. A. et al. Burden of bacterial antimicrobial resistance in low-income and middle-income countries avertible by existing interventions: an evidence reviews and modelling analysis. Lancet403, 2439–2454 (2024). - PubMed
    1. Ikhimiukor, O. O., Odih, E. E., Donado-Godoy, P. & Okeke, I. N. A bottom-up view of antimicrobial resistance transmission in developing countries. Nat. Microbiol.7, 757–765 (2022). - PubMed

LinkOut - more resources