

Molecular diversity and genetic potential of new maize inbred lines across varying sowing conditions in arid environment
- PMID: 39843541
- PMCID: PMC11754663
- DOI: 10.1038/s41598-025-87021-8
Molecular diversity and genetic potential of new maize inbred lines across varying sowing conditions in arid environment
Erratum in
-
Publisher Correction: Molecular diversity and genetic potential of new maize inbred lines across varying sowing conditions in arid environment.Sci Rep. 2025 Mar 14;15(1):8860. doi: 10.1038/s41598-025-93231-x. Sci Rep. 2025. PMID: 40087347 Free PMC article. No abstract available.
Abstract
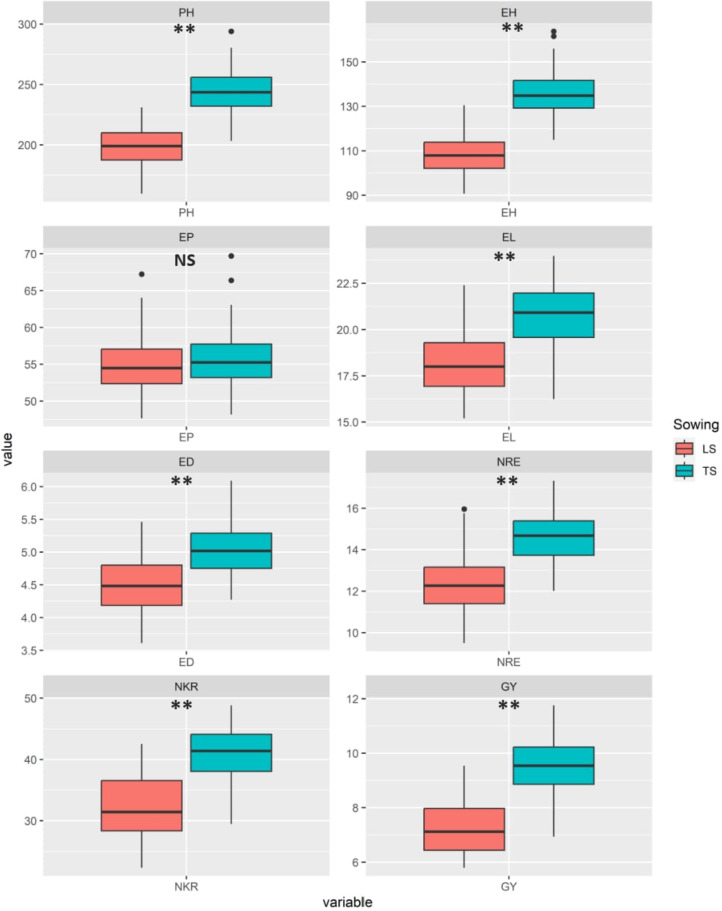
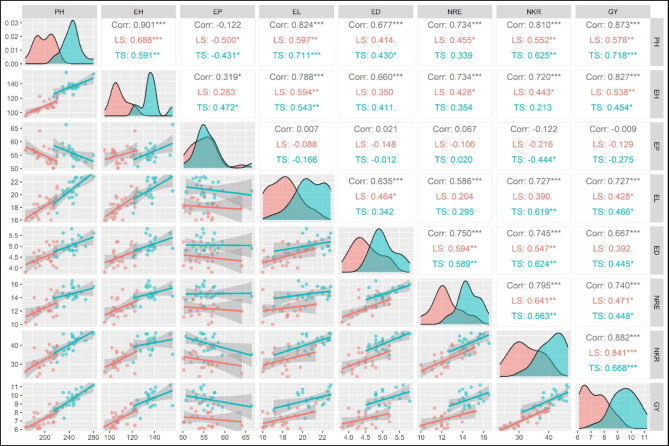
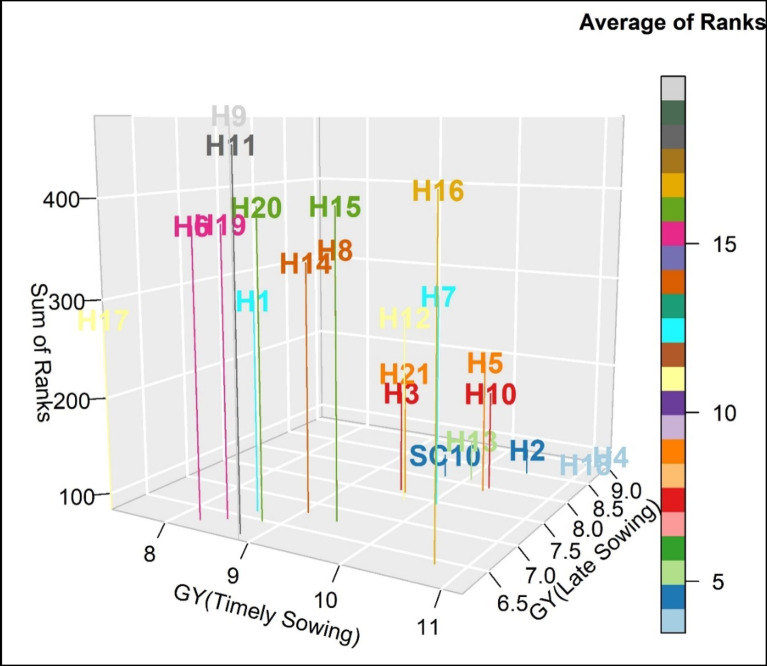
Developing high-yielding and resilient maize hybrids is essential to ensure its sustainable production with the ongoing challenges of considerable shifts in global climate. This study aimed to explore genetic diversity among exotic and local maize inbred lines, evaluate their combining ability, understand the genetic mechanisms influencing ear characteristics and grain yield, and identify superior hybrids suited for timely and late sowing conditions. Seven local and exotic maize inbred lines were genotyped using SSR (Simple Sequence Repeat) markers to assess their genetic diversity. These diverse lines were utilized to develop 21 F1 hybrids using a diallel mating design. These hybrids, alongside a high-yielding commercial check (SC-10), were evaluated under field conditions across two growing seasons under timely and late sowing conditions. The results showed that sowing date, assessed hybrids, and their interaction significantly influenced all measured agronomic traits. Notably, late sowing reduced plant height, ear characteristics, and, ultimately, grain yield. Several hybrids, particularly L101 × L103, L101 × L105, L104 × L105, and L104 × L107 under timely sowing, and L101 × L105 and L104 × L107 under late sowing, surpassed the agronomic performance of check commercial hybrid. Inbred lines L101 and L103 emerged as superior combiners for ear traits and yield, while line L106 showed promise for breeding shorter-stature plants. Hybrid combinations L101 × L105, L104 × L107, and L106 × L107 were identified as specific good combiners for grain yield and related traits under both sowing conditions, indicating their potential for commercial development. Strong positive associations were observed between grain yield and certain agronomic traits highlighting their utility for indirect selection in early breeding generations.
Keywords: Climate adaptability; Combining ability; Diallel mating design; Hybrid yield performance; Plant breeding strategies; SSR markers.
© 2025. The Author(s).
Conflict of interest statement
Declarations. Competing interests: The authors declare no competing interests. Ethical approval: This article does not contain any studies with human participants or animals performed by any of the authors.
Figures


References
-
- FAOSTAT. Food and Agriculture Organization of the United Nations. Statistical Database (2024). http://www.fao.org/faostat/en/#data (accessed on 23 February 2024).
-
- Bakala, H. S., Devi, J., Ankita, Sarao, L. K. & Kaur, S. In Clean Energy Production Technologies 27–66 (Springer Nature Singapore, 2023).
-
- Abbas, G. et al. Modeling the potential impact of climate change on maize-maize cropping system in semi-arid environment and designing of adaptation options. Agric. Meteorol.341, 109674 (2023). - DOI
-
- Grassini, P., Thorburn, J., Burr, C. & Cassman, K. G. High-yield irrigated maize in the Western U.S. Corn Belt: I. On-farm yield, yield potential, and impact of agronomic practices. Field Crops Res.120, 142–150. 10.1016/j.fcr.2010.09.012 (2011). - DOI
Publication types
MeSH terms
LinkOut - more resources
Full Text Sources
