. 2025 Jul;30(7):2931-2942.
doi: 10.1038/s41380-025-02896-3. Epub 2025 Jan 22.

Longitudinal evolution of the transdiagnostic prodrome to severe mental disorders: a dynamic temporal network analysis informed by natural language processing and electronic health records

Affiliations

Longitudinal evolution of the transdiagnostic prodrome to severe mental disorders: a dynamic temporal network analysis informed by natural language processing and electronic health records

Maite Arribas et al. Mol Psychiatry. 2025 Jul.

Abstract

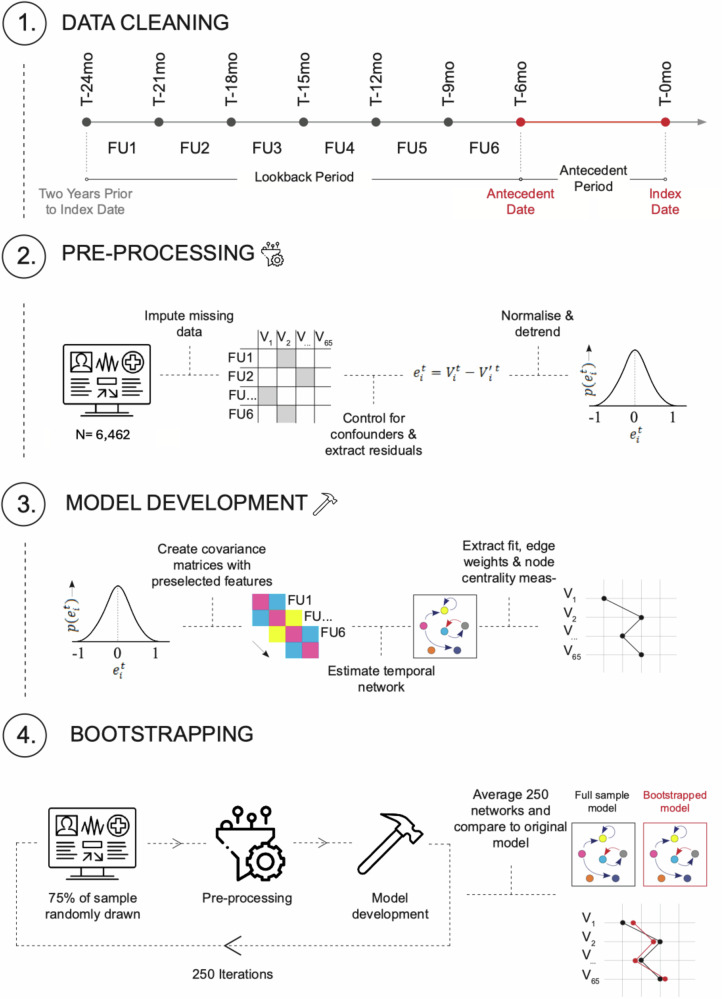
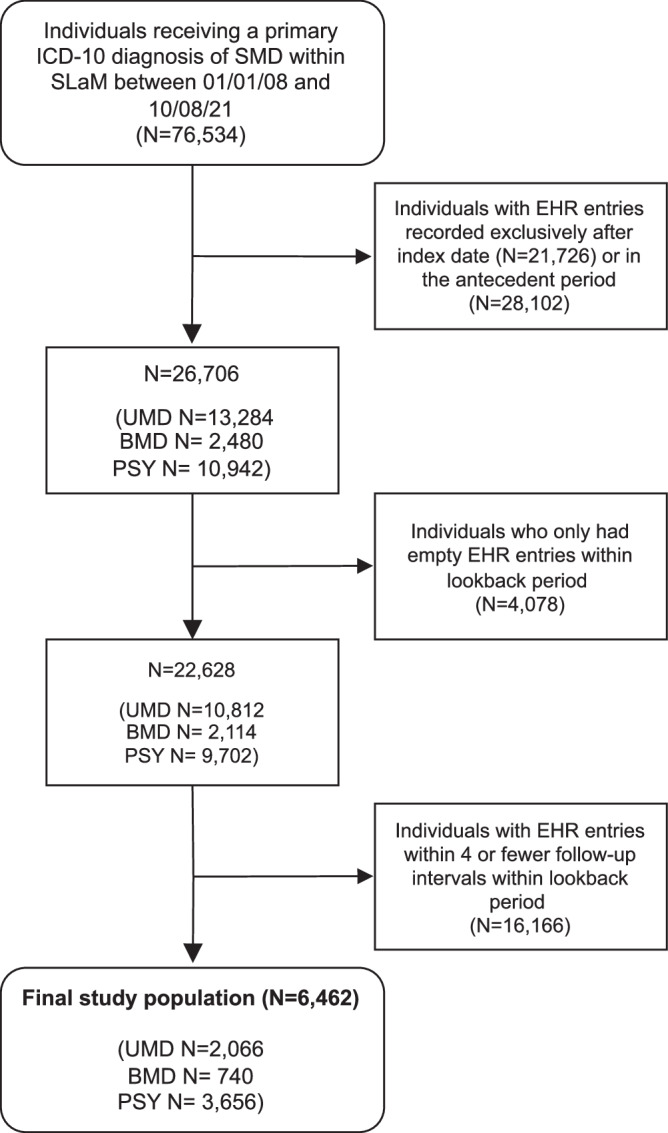
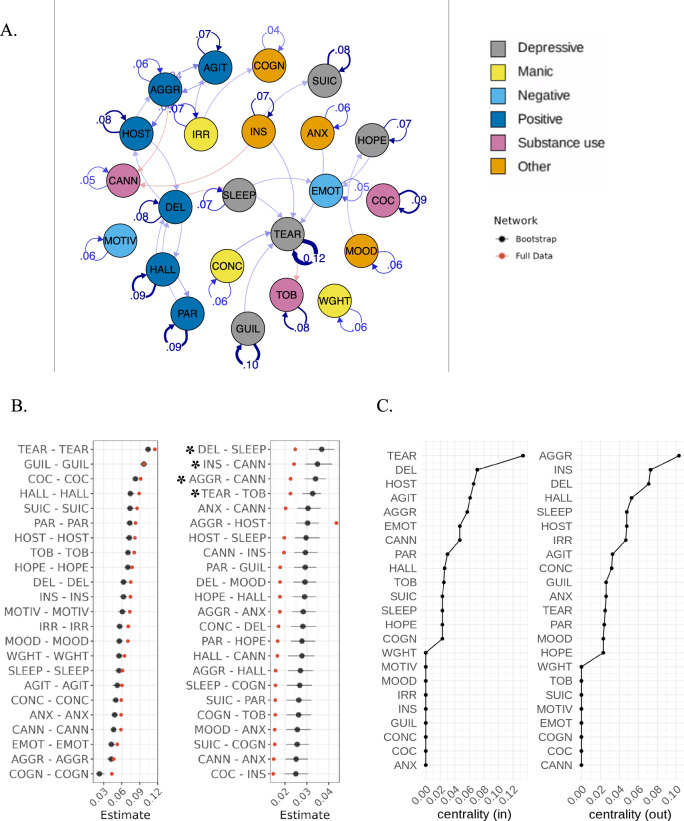
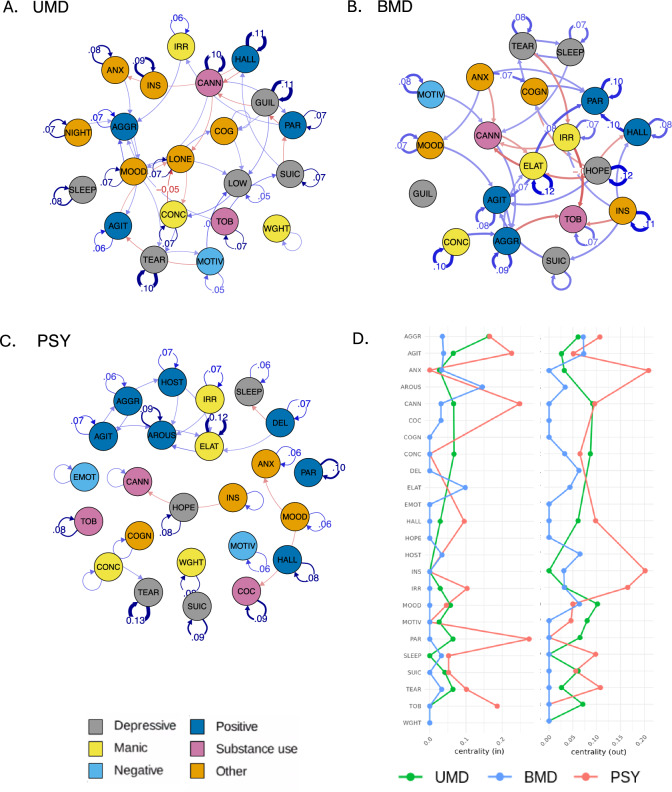
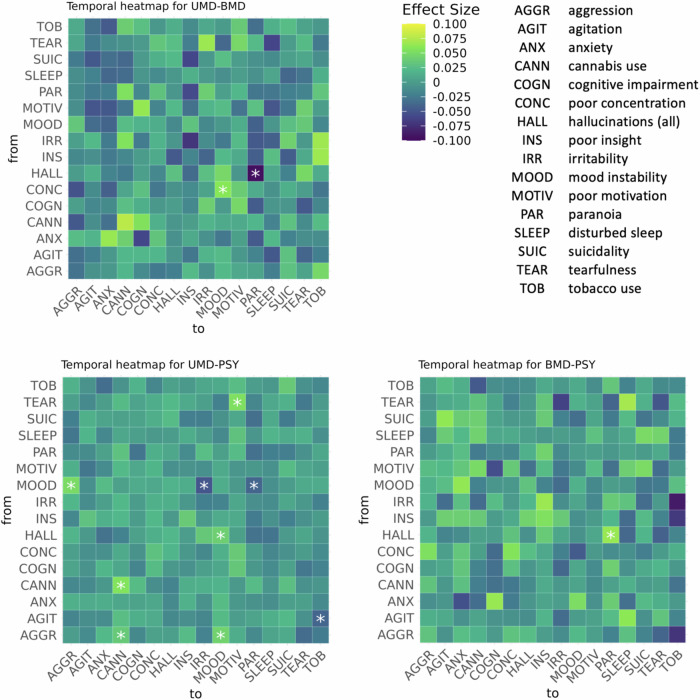
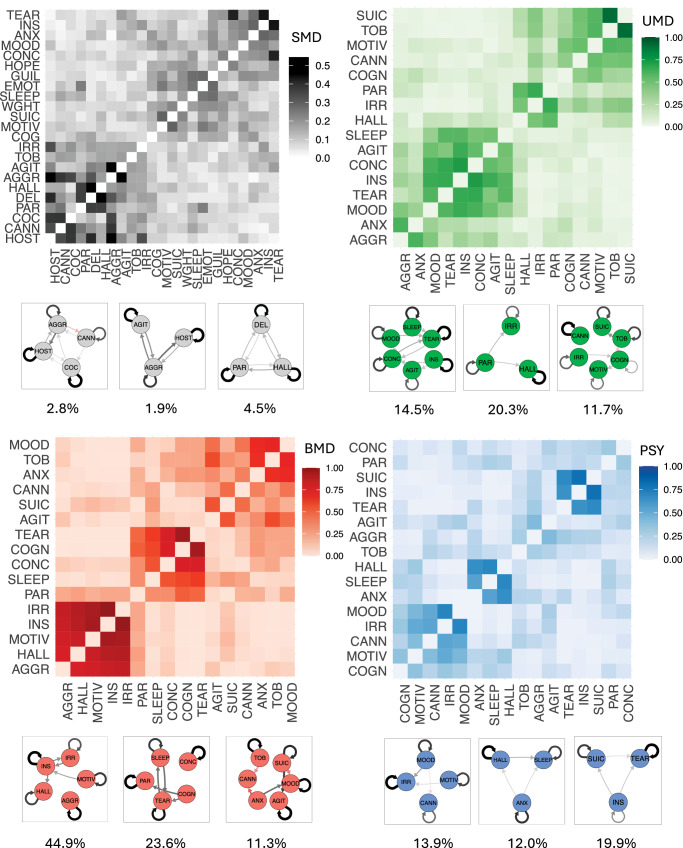
Modelling the prodrome to severe mental disorders (SMD), including unipolar mood disorders (UMD), bipolar mood disorders (BMD) and psychotic disorders (PSY), should consider both the evolution and interactions of symptoms and substance use (prodromal features) over time. Temporal network analysis can detect causal dependence between and within prodromal features by representing prodromal features as nodes, with their connections (edges) indicating the likelihood of one feature preceding the other. In SMD, node centrality could reveal insights into important prodromal features and potential intervention targets. Community analysis can identify commonly occurring feature groups to define SMD at-risk states. This retrospective (2-year) cohort study aimed to develop a global transdiagnostic SMD network of the temporal relationships between prodromal features and to examine within-group differences with sub-networks specific to UMD, BMD and PSY. Electronic health records (EHRs) from South London and Maudsley (SLaM) NHS Foundation Trust were included from 6462 individuals with SMD diagnoses (UMD:2066; BMD:740; PSY:3656). Validated natural language processing algorithms extracted the occurrence of 61 prodromal features every three months from two years to six months before SMD onset. Temporal networks of prodromal features were constructed using generalised vector autoregression panel analysis, adjusting for covariates. Edge weights (partial directed correlation coefficients, z) were reported in autocorrelative, unidirectional and bidirectional relationships. Centrality was calculated as the sum of (non-autoregressive) connections leaving (out-centrality, cout) or entering (in-centrality, cin) a node. The three sub-networks (UMD, BMD, PSY) were compared using permutation analysis, and community analysis was performed using Spinglass. The SMD network revealed strong autocorrelations (0.04 ≤ z ≤ 0.10), predominantly positive connections, and identified aggression (cout = 0.103) and tearfulness (cin = 0.134) as the most central features. Sub-networks for UMD, BMD, and PSY showed minimal differences, with 3.5% of edges differing between UMD and PSY, 0.8% between UMD and BMD, and 0.4% between BMD and PSY. Community analysis identified one positive psychotic community (delusional thinking-hallucinations-paranoia) and two behavioural communities (aggression-cannabis use-cocaine use-hostility, aggression-agitation-hostility) as the most common. This study represents the most extensive temporal network analysis conducted on the longitudinal interplay of SMD prodromal features. The findings provide further evidence to support transdiagnostic early detection services across SMD, refine assessments to detect individuals at risk and identify central features as potential intervention targets.


Conflict of interest statement

Competing interests: MA has been employed by F. Hoffmann-La Roche AG outside of the current study. RAM has received speaker/consultancy fees from Boehringer Ingelheim, Janssen, Karuna, Lundbeck, Newron, Otsuka, and Viatris, and co-directs a company that designs digital resources to support treatment of mental ill health. RP has participated in a Scientific Advisory Board for Boehringer Ingelheim, has received grant funding from Janssen, and has received consulting fees from Holmusk, Akrivia Health, Columbia Data Analytics, Clinilabs, Social Finance, Boehringer Ingelheim, Bristol Myers Squibb, Teva and Otsuka. PFP has received research funds or personal fees from Lundbeck, Angelini, Menarini, Sunovion, Boehringer Ingelheim, Mindstrong, Proxymm Science, outside the current study. Ethics approval: Permissions for the study were granted by the Oxfordshire Research Ethics Committee C; because the data set comprised deidentified data, informed consent was not required [18]. All methods were performed in accordance with relevant guidelines and regulations.

Figures

Fig. 1
Fig. 1. Study design.
The look-back period was split into six three-month follow-up intervals (FU 1–6) relative to the index date (T-0mo) of SMD diagnosis. This pipeline (steps 1–4) was followed for both the primary analysis (SMD model) and secondary analysis (sub-networks).
Fig. 2
Fig. 2
Flowchart of the study population.
Fig. 3
Fig. 3. Temporal relationships between nodes in SMD network.
A Temporal network graph displaying positive (blue) and negative (red) relationships between nodes from actual model estimates. Edges are displayed as lines, with the thickness representing the strength of the edge weight estimate (partial directed correlation coefficient, z). Edges are thresholded (|z| > 0.022) and labelled (|z| > 0.03). For visualisation purposes, nodes are clustered into six categories (depressive, manic, negative, positive, substance use and other) according to the type of prodromal feature. B Bootstrapped (250 repetitions; black) vs actual model (n = 6462; red) edge weight estimates (|z| > 0.022). Edges are directed such that “node1 – node2” represents the edge from node1 to edge2. All edges were positive except the ones marked with an asterisk (DEL-SLEEP, INS-CANN, AGGR-CANN, TEAR-TOB). C Centrality measures for all nodes. AGGR aggression, AGIT agitation, ANX anxiety, CANN cannabis use, COC cocaine use, COGN cognitive impairment, CONC poor concentration, DEL delusional thinking, EMOT emotional withdrawal, GUIL guilt, HALL hallucinations (all), HOPE feeling hopeless, HOST hostility, INS poor insight, IRR irritability, MOOD: mood instability, MOTIV poor motivation, PAR paranoia, SLEEP disturbed sleep, SUIC suicidality, TEAR tearfulness, TOB tobacco use, WGHT weight loss.
Fig. 4
Fig. 4. Temporal relationships between nodes in sub-networks.
Temporal network graphs displaying positive (blue) and negative (red) relationships between nodes from actual model estimates for sub-networks (A UMD, B BMD, C PSY). Edges are displayed as lines, with the thickness representing the strength of the edge weight estimate (partial directed correlation coefficient, z). Edges are thresholded (UMD: |z| > 0.026, BMD: |z| > 0.045, PSY: |z| > 0.03) and labelled (UMD: |z| > 0.04, UMD: |z| > 0.06, UMD: |z| > 0.05). For visualisation purposes, nodes are clustered into six categories (depressive, manic, negative, positive, substance use and other) according to the type of prodromal feature. D Centrality measures for all nodes in sub-networks (green: UMD, blue: BMD, red: PSY). AGGR aggression, AGIT agitation, ANX anxiety, AROUS arousal, CANN cannabis use, COC cocaine use, COGN cognitive impairment, CONC poor concentration, DEL delusional thinking, ELAT elation, EMOT emotional withdrawal, GUIL guilt, HALL hallucinations (all), HOPE feeling hopeless, HOST hostility, INS poor insight, IRR irritability, LONE feeling lonely, LOW low energy, MOOD mood instability, MOTIV poor motivation, NIGHT nightmares, PAR paranoia, SLEEP disturbed sleep, SUIC suicidality, TEAR tearfulness, TOB tobacco use, WGHT weight loss.
Fig. 5
Fig. 5. Heat maps for pairwise edge comparisons (UMD-BMD, UMD-PSY, BMD-PSY) in temporal sub-networks in permutation analysis.
The magnitude and direction of effect size are colour-coded such that for the pairwise comparison Group1-Group2, yellow indicates the edge estimate is more positive in Group1 > Group2 and blue indicates the opposite Group1 < Group2. Significant pairwise comparisons (corrected p < 0.05) are marked with an asterisk (*).
Fig. 6
Fig. 6. Heatmaps of node-node covariance across communities.
The colour scale indicates the probability of 2 nodes co-occurring within the same community across 1000 iterations of the Spinglass algorithm (spin restricted to 12 [SMD] and 8 [UMD, BMD, PSY]). The nodes are ordered by hierarchical clustering. The 3 most-occurring communities are displayed under each heatmap, with their % occurrence across 1000 iterations. Edges have been thresholded at |z| > 0.01 (SMD, PSY), > 0.02 (UMD) and > 0.035 (BMD), for visualisation purposes. Positive edges are displayed in black, and negative edges in red.

Similar articles

References

    1. Estradé A, Onwumere J, Venables J, Gilardi L, Cabrera A, Rico J, et al. The lived experiences of family members and carers of people with psychosis: a bottom-up review co-written by experts by experience and academics. Psychopathology. 2023;56:371–82. - PMC - PubMed
    1. Fusar-Poli P, Estradé A, Stanghellini G, Venables J, Onwumere J, Messas G, et al. The lived experience of psychosis: a bottom-up review co-written by experts by experience and academics. World Psychiatry. 2022;21:168–88. - PMC - PubMed
    1. Fusar-Poli P, Estradé A, Stanghellini G, Esposito CM, Rosfort R, Mancini M, et al. The lived experience of depression: a bottom-up review co-written by experts by experience and academics. World Psychiatry. 2023;22:352–65. - PMC - PubMed
    1. Oliver D, Arribas M, Perry BI, Whiting D, Blackman G, Krakowski K, et al. Using electronic health records to facilitate precision psychiatry. Biol Psychiatry. 2024;96:532–42. - PubMed
    1. Borsboom D, Deserno MK, Rhemtulla M, Epskamp S, Fried EI, McNally RJ, et al. Network analysis of multivariate data in psychological science. Nat Rev Methods Primers. 2021;1:1–18.

LinkOut - more resources