Comparative Study
. 2025 Jan 22;15(1):2849.
doi: 10.1038/s41598-024-84152-2.

A comparative machine learning study of schizophrenia biomarkers derived from functional connectivity

Affiliations
Comparative Study

A comparative machine learning study of schizophrenia biomarkers derived from functional connectivity

Victoria Shevchenko et al. Sci Rep. .

Abstract

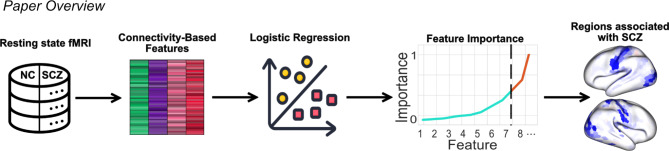
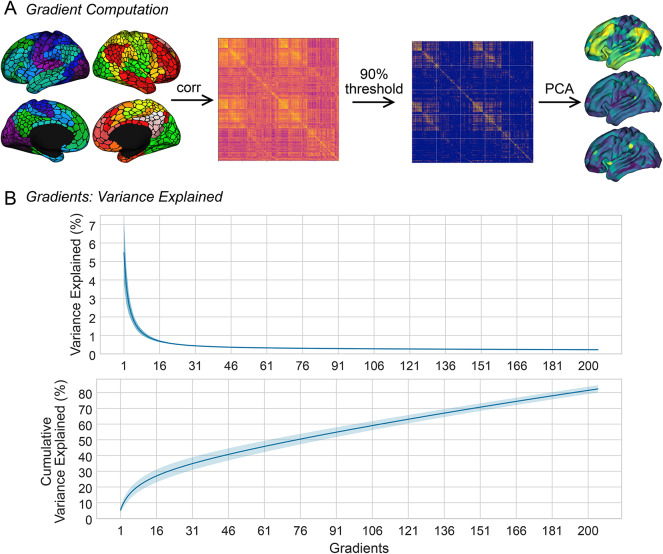
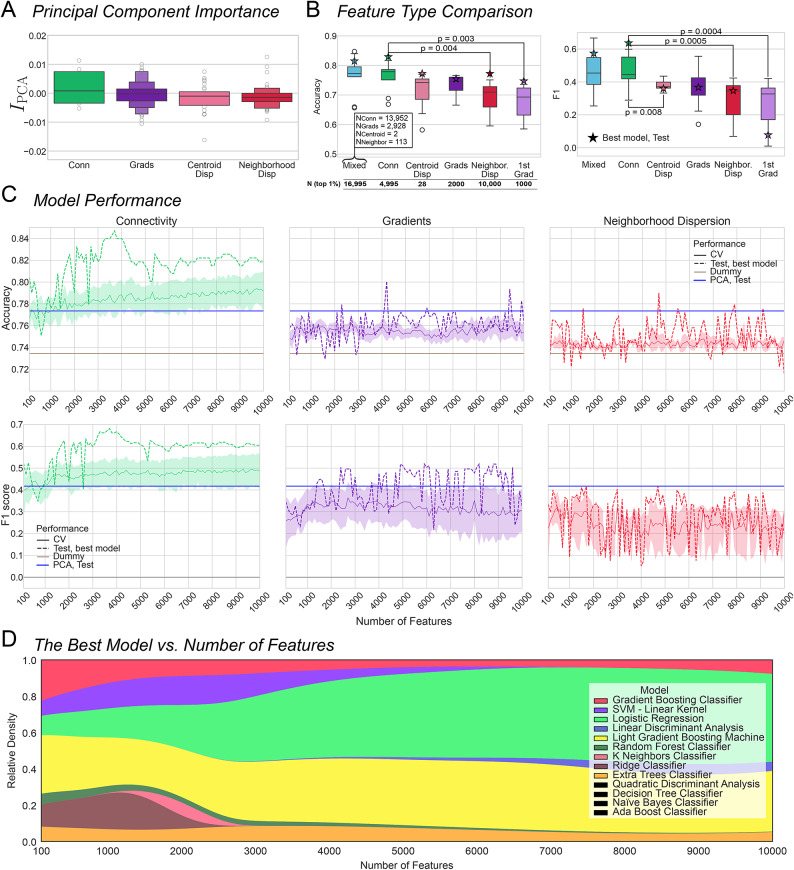
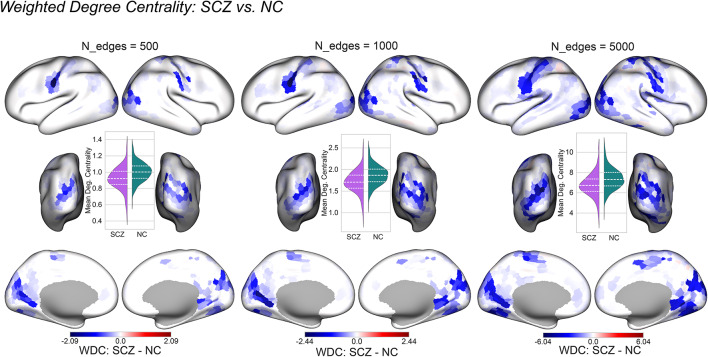
Functional connectivity holds promise as a biomarker of schizophrenia. Yet, the high dimensionality of predictive models trained on functional connectomes, combined with small sample sizes in clinical research, increases the risk of overfitting. Recently, low-dimensional representations of the connectome such as macroscale cortical gradients and gradient dispersion have been proposed, with studies noting consistent gradient and dispersion differences in psychiatric conditions. However, it is unknown which of these derived measures has the highest predictive capacity and how they compare to raw functional connectivity specifically in the case of schizophrenia. Our study evaluates which connectome features derived from resting state functional MRI - functional connectivity, gradients, or gradient dispersion - best identify schizophrenia. To this end, we leveraged data of 936 individuals from three large open-access datasets: COBRE, LA5c, and SRPBS-1600. We developed a pipeline which allows us to aggregate over a million different features and assess their predictive potential in a single, computationally efficient experiment. We selected top 1% of features with the largest permutation feature importance and trained 13 classifiers on them using 10-fold cross-validation. Our findings indicate that functional connectivity outperforms its low-dimensional derivatives such as cortical gradients and gradient dispersion in identifying schizophrenia (Mann-Whitney test conducted on test accuracy: connectivity vs. 1st gradient: U = 142, p < 0.003; connectivity vs. neighborhood dispersion: U = 141, p = 0.004). Additionally, we demonstrated that the edges which contribute the most to classification performance are the ones connecting primary sensory regions. Functional connectivity within the primary sensory regions showed the highest discrimination capabilities between subjects with schizophrenia and neurotypical controls. These findings along with the feature selection pipeline proposed here will facilitate future inquiries into the prediction of schizophrenia subtypes and transdiagnostic phenomena.


Conflict of interest statement

Declarations. Competing interests: The authors declare no competing interests.

Figures

Fig. 1
Fig. 1
Overview of the methods and main outcome of the paper. Schematic images: Flaticon.com. NC: neurotypical controls, SCZ: individuals with schizophrenia.
Fig. 2
Fig. 2
(A) Parcel-wise time series (Schaefer atlas, 1000 parcels, 7 Yeo networks) of each subject were correlated to produce a 1000 × 1000 connectivity matrix. Principal component analysis (PCA) was applied to the thresholded matrix to extract 200 gradients. (B) Variance explained by 200 gradients, mean across subjects ± 1 s.d.
Fig. 3
Fig. 3
Illustration of the methods used to compute gradient dispersion. (A) Centroid dispersion. The sum of squares of distances between the centroid of a network and its regions (black dashed lines) quantifies within-network dispersion. The distance between the centroids of networks quantifies between-network dispersion. (B) Neighborhood dispersion. In a multidimensional gradient embedding, for a given region (red) K nearest neighbors are identified (blue). These regions are shown within the black circle. (C) Neighborhood dispersion of a given region i is the mean distance between said region and its K closest neighbors. The same operation is done for every region (N regions = 1000).
Fig. 4
Fig. 4
(A) The types of predictors tested in this work (left to right): connectivity matrices (vectorized), macroscale cortical gradients, neighborhood, and centroid dispersion. (B) All four types of features were concatenated together (2) and decomposed using group PCA (2) (each feature group is decomposed separately). The resulting dataset, along with covariates, was divided into the train and holdout set; 10-fold cross-validation (CV) was used to assess the performance of L2-regularized logistic regression on the PCA dataset (3). (C) Permutation component importance was computed for each component using the holdout set (1). For each feature type, component importance was inverse transformed to obtain feature importance (2). COVARS: covariates (age, sex, framewise displacement, site), CONN: connectivity, CV: cross-validation, DISPcntr: centroid dispersion, DISPnbr: neighborhood dispersion, GRAD: cortical gradients, IPCA: component permutation importance, L2-Log Reg: L2-regularized logistic regression, PCA: principal component analysis.
Fig. 5
Fig. 5
(A) Permutation importance across feature types. (B) Accuracy and F1 score across 13 classifiers (mean cross CV folds; dummy classifier was excluded) fit on top 1% best features from each feature type, the principal gradient, the 28 values of centroid dispersion and the top 1% best features from the whole feature set (mixed: the inset shows the number of features from each feature type that were included in the top 1%). P-values indicate significant difference as per Mann–Whitney U test, α ≤ 0.01 (connectivity vs. all: Bonferroni-corrected). The stars denote the performance of the best classifier as identified based on the mean accuracy across 10 CV folds. (C) Mean ± s.e.m. CV and test performance across classifiers for N features 100–10,000 for connectivity (left), gradients (middle), and neighborhood dispersion (right). Horizontal lines represent test performance of the logistic regression on all principal components (blue), and the performance of the dummy classifier (brown). The shading indicates s.e.m. (D) Relative density of fits where the corresponding classifier was identified as best. Larger area indicates that the corresponding classifier had the highest CV accuracy more often. The legend features all classifiers that were tested in this study; the classifiers in black were never identified as the best. CV: cross-validation; PCA: principal component analysis; SVM: support vector machine.
Fig. 6
Fig. 6
The difference in mean weighted degree centrality (WDC, averaged across subjects, Eq. 5) between the two groups for 500, 1000 and 5000 connectivity edges with the largest permutation feature importance. Inset violinplots display WDC averaged across regions for the two groups. Color bars denote the difference in WDC between SCZ and NC. SCZ: subjects diagnosed with schizophrenia, NC: neurotypical controls, WDC: weighted degree centrality.

Similar articles

Cited by

References

    1. Yang, G. J. et al. Functional hierarchy underlies preferential connectivity disturbances in schizophrenia. Proc. Natl. Acad. Sci. U. S. A.113, E219–E228 (2016). - PMC - PubMed
    1. Chan, Y. H., Yew, W. C., Chew, Q. H., Sim, K. & Rajapakse, J. C. Elucidating salient site-specific functional connectivity features and site-invariant biomarkers in schizophrenia via deep neural networks. Sci. Rep.13, 21047 (2023). - PMC - PubMed
    1. Gifford, G. et al. Resting state fMRI based multilayer network configuration in patients with schizophrenia. Neuroimage Clin.25, 102169 (2020). - PMC - PubMed
    1. Sendi, M. S. E. et al. Aberrant dynamic functional connectivity of default mode network in schizophrenia and links to symptom severity. Front. Neural Circuits15, 649417 (2021). - PMC - PubMed
    1. Li, S. et al. Dysconnectivity of multiple brain networks in schizophrenia: A meta-analysis of resting-state functional connectivity. Front. Psychiatry10, 482 (2019). - PMC - PubMed

Publication types

LinkOut - more resources