. 2025 Mar;17(3):414-440.
doi: 10.1038/s44321-024-00188-x. Epub 2025 Jan 22.

FABP4 as a therapeutic host target controlling SARS-CoV-2 infection

Affiliations

FABP4 as a therapeutic host target controlling SARS-CoV-2 infection

Hatoon Baazim et al. EMBO Mol Med. 2025 Mar.

Abstract

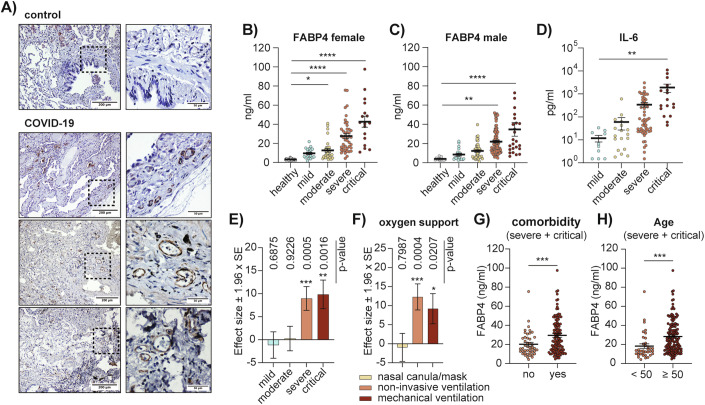
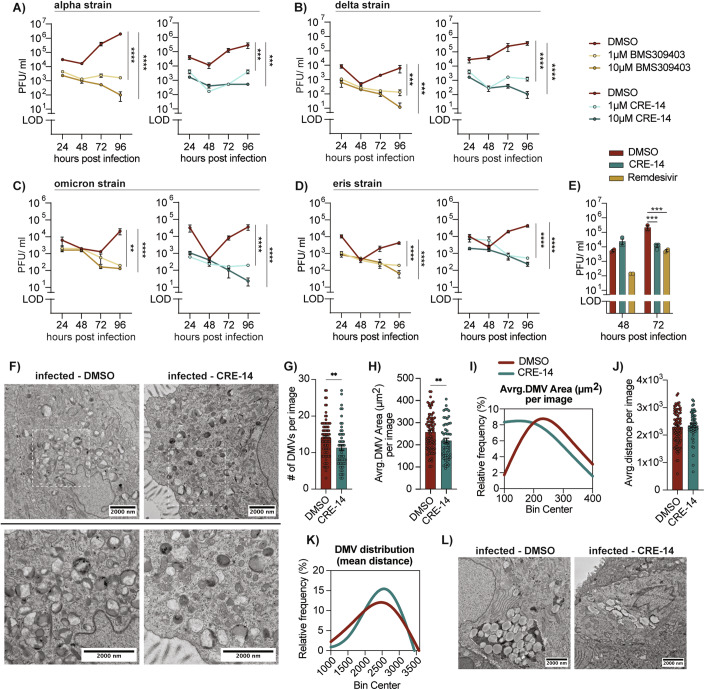
Host metabolic fitness is a critical determinant of infectious disease outcomes. Obesity, aging, and other related metabolic disorders are recognized as high-risk disease modifiers for respiratory infections, including coronavirus infections, though the underlying mechanisms remain unknown. Our study highlights fatty acid-binding protein 4 (FABP4), a key regulator of metabolic dysfunction and inflammation, as a modulator of SARS-CoV-2 pathogenesis, correlating strongly with disease severity in COVID-19 patients. We demonstrate that loss of FABP4 function, by genetic or pharmacological means, reduces SARS-CoV-2 replication and disrupts the formation of viral replication organelles in adipocytes and airway epithelial cells. Importantly, FABP4 inhibitor treatment of infected hamsters diminished lung viral titers, alleviated lung damage and reduced collagen deposition. These findings highlight the therapeutic potential of targeting host metabolism in limiting coronavirus replication and mitigating the pathogenesis of infection.

Keywords: COVID-19; FABP4; Lipid Droplets; Replication Organelles; SARS-CoV-2.


Conflict of interest statement

Disclosure and competing interests statement. Emre Koyuncu is co-founder, director, and officer of Crescenta Biosciences and holds equity at the company. Ali Al-Hakeem and Fatih Semerci are employees of Crescenta Biosciences. Hahn Kim is co-founder, director, and consultant of Crescenta Biosciences and holds equity at the company. Hahn Kim is an employee of Princeton University; All work of Hahn Kim included herein was performed as a consultant for Crescenta, independent of Princeton University. Hahn Kim, Emre Koyuncu and Gökhan S. Hotamisligil are inventors on patent application that includes CRE-14. Gökhan S. Hotamisligil is a scientific advisor, receives compensation and holds equity at Crescenta Biosciences. He is also a member of the journal’s advisory editorial board. This has no bearing on the editorial consideration of this article for publication. Other authors declare no competing interests.

Figures

Figure 1
Figure 1. FABP4 levels are increased in the lungs and circulation of COVID-19 patients.
(A) Immunohistochemical staining of lung biopsies of controls and COVID-19 patients, using anti-FABP4 antibody. (B, C) Circulating FABP4 concentrations measured from (B) female (n = 109 female patients) and (C) male COVID-19 patients (n = 174 male patients) and healthy controls (n = 32 female and n = 13 male), stratified based on disease severity (****p < 0.0001, **p = 0.002, *p = 0.0221). (D) Circulating IL-6 levels in COVID-19 patients, stratified based on disease severity (**p = 0.0017). (BD) Statistical analysis was performed using one-way ANOVA. (E, F) Effect size estimates and inference based on regression analysis of FABP4 concentration on (E) COVID-19 severity and (F) oxygen support measures while accounting for time of collection post symptom onset, age, sex, and BMI, using the linear mixed model to account for the patient-level random effects. (E) The healthy controls and, (F) patients who did not require oxygen support were used as a reference group. p-values are calculated based on the Wald test. For (BF), the analysis included n = 283 total patients and n = 45 healthy controls. (G, H) FABP4 concentration in patients with severe and critical disease (n = 176 patients), stratified based on (G) presence or absence of comorbidities (listed in Table 2 and Dataset EV1, ***p = 0.0009) or (H) age (***p = 0.0006). Statistical analysis was performed using Welche’s t-test. (BH) Data are derived from patient cohort 1 (collected November 2020–May 2021). Patients were sampled longitudinally, and the data shown in (B), (C), (D), (G) and (H) represent the maximum measured concentration per patient. Data are shown as the mean ± s.e.m. Source data are available online for this figure.
Figure 2
Figure 2. FABP4 colocalizes with SARS-CoV-2 replication organelles in human adipocyte cell lines.
(AC) hTERT pre-adipocytes and differentiated adipocytes infected with SARS-CoV-2 (WA1/2020, MOI = 1). (A, B) Relative expression of viral (A) genomic RNA (nucleocapsid, ***p = 0.0002, **p = 0.0018) and (B) sub-genomic RNA (ORF1ab, ***p = 0.0003, *p = 0.0263), normalized to β-actin. (C) Viral loads measured from supernatant using plaque assay. (****p < 0.0001, **p = 0.0024). Data are pooled from two independent experiments (n = 8, biological replicates). Statistical analysis was performed using two-way ANOVA. (D) IL-6 levels in the supernatant of differentiated adipocytes with or without viral infection (MOI = 1), measured by ELISA. Data are pooled from three independent experiments (n = 14, biological replicates, ****p < 0.0001). Statistical analysis was performed using one-way ANOVA. (EG) Adipocytes were infected at 4, 9, 12, 16, and 20 days post-differentiation (MOI = 1), with measurements taken 48 h post-infection. (E) Viral loads measured by plaque assay; data represent two independent experiments (n = 4, biological replicates, ****p < 0.0001). Statistical analysis was performed using one-way ANOVA. (F) Western blot of viral nucleocapsid, FABP4, and β-actin proteins levels in cell lysates. (G) Quantification of nucleocapsid and FABP4 band intensities normalized to β-actin, representative of two independent experiments (n = 4, biological replicates, ****p < 0.0001, ***p = 0.0001 and 0.0006). Statistical analysis was performed using two-way ANOVA. (H, I) Percent area of lipid droplets in infected cells and neighboring cells, quantified by fluorescence neutral lipid staining (Bodipy). Infected cells identified by (H) nucleocapsid-positive staining and (I) dsRNA-positive staining. Data pooled from two independent experiments (n = 6, biological replicates, ****p < 0.0001, ***p = 0.0001); statistical analysis was performed using a standard t-test. (J) Representative confocal images of infected differentiated adipocytes (MOI = 1), stained for dsRNA (red), lipid droplets (yellow), and nucleus (DAPI, blue). Scale bar = 50 μm; magnified regions = 10 μm (n = 3). (K) Percent lipid droplet area relative to dsRNA-positive area per cell. Pearson correlation coefficient indicated as r. (L, M) Representative confocal images of control and infected adipocytes at 8, 12, 24, and 48 h post-infection, stained for dsRNA (red), lipid droplets (yellow), calnexin (blue), and FABP4 (gray). (L) Merged image of all stains (Scale bar = 50 μm); insets highlight overlap of FABP4, dsRNA, and calnexin (Scale bar = 5 μm). (M) Signal overlap between dsRNA, FABP4, and calnexin, and between FABP4 and calnexin individually (Scale bar = 5 μm). (NP) Colocalization of target signals over time, represented as Pearson correlation R. Cells infected with MOI = 3 at 8 and 12 hpi; data pooled from two independent experiments (n = 6, biological replicates, ****p < 0.0001). For 24 and 48 hpi, MOI = 1 was used (n = 3) biological replicates. Statistical analysis was performed using one-way ANOVA. Data shown as mean ± s.e.m. Source data are available online for this figure.
Figure 3
Figure 3. FABP4 deficiency reduces virus titers and disrupts replication organelles formation in adipocytes.
(AE) SARS-CoV-2-infected differentiated adipocytes (MOI = 1), treated with either DMSO, BMS309403 (20 μM) or CRE-14 (20 μM). (A) Relative RNA expression of SARS-CoV-2 nucleocapsid, normalized to β-actin. Data are pooled from two independent experiments (n = 8, biological replicates, ****p < 0.0001, *p = 0.0229). (B) Quantification of nucleocapsid band intensity normalized to β-actin. Data are representative of three independent experiments (n = 3, biological replicates, ****p < 0.0001, ***p = 0.0003, *p = 0.0182). (C) Western blot of nucleocapsid and β-actin protein levels in cell lysates. (D) Viral load measured by plaque assay, pooled from two independent experiments (n = 8, biological replicates, ****p < 0.0001), representative of four independent experiments. (E) IL-6 levels in the supernatant of infected adipocytes treated with FABP4 inhibitors, measured by ELISA. Data are pooled from two independent experiments (n = 8, biological replicates, ***p = 0.0004 and 0.0001). For (A), (B), (D), and (E), statistical analysis was performed using two-way ANOVA. (FH) Infected wild-type (WT) and FABP4-deficient human adipocytes (MOI = 1). (F) Western blot of nucleocapsid, FABP4, and β-actin protein levels in cell lysates. (G) Quantification of nucleocapsid band intensity normalized to β-actin, representative of two independent experiments (n = 3, biological replicates, **p = 0.0015). (H) Viral load measured by plaque assay from supernatants collected 24 and 48 h post-infection. Data are pooled from three independent experiments (n = 9, biological replicates, ****p < 0.0001). Statistical analysis was performed using a standard t-test. (IL) Infected differentiated adipocytes (MOI = 3, biological replicates, ****p < 0.0001) fixed 48 h post-infection and stained with dsRNA (red), lipid droplets (yellow), and calnexin (blue). (J, K) Representative images of infected cells with (J) inhibitor treatment or (K) genetic deletion of FABP4. Scale bar = 50 μm, magnified regions = 10 μm. (I, L) Percentage dsRNA area and mean fluorescence intensity per cell. Statistical analysis was performed using one-way ANOVA for (I) and a standard t-test for (L) (n = 3, biological replicates, ****p < 0.0001) biological replicates and 11 to 16 images per sample. (MO) Real-time electric impedance traces and their corresponding median cell index (hours) for (M) and (N) wild-type and FABP4 knockout mouse pre-adipocytes infected with coronavirus OC43 at indicated MOIs. (O) MRC5 cells infected with OC43 and treated with either DMSO or CRE-14. Statistical analysis was performed using a standard t-test (n = 3, biological replicates, ****p < 0.0001, **p = 0.0026). Data are shown as mean ± s.e.m. Source data are available online for this figure.
Figure 4
Figure 4. Inhibition of FABP4 in bronchial epithelial cells disrupts virus replication organelles.
(AD) Viral load measured from the supernatant of human bronchoepithelial (HBE135-E6E7) cells infected with SARS-CoV-2 (MOI = 3, biological replicates) (A) alpha strain (Ank1, ****p < 0.0001, ***p = 0.0003), (B) delta strain (Ank-Dlt1, ****p < 0.0001, ***p = 0.0002 and 0.0001), (C) omicron strain (Ank-OmicronGKS), and (D) eris strain (Ank-Eris, ****p < 0.0001, ***p = 0.0034 and 0.0023) and treated with BMS309403 or CRE-14 at the indicated doses. Data are representative of two independent experiments. Statistical analysis was performed using two-way ANOVA. (E) Virus load measured from the apical wash of infected 3D airway epithelium cultures (IDF0571/2020, MOI 0.1), treated with either CRE-14 (10 μM) or Remdesivir (5 μM). Statistical analysis was performed using two-way ANOVA (n = 3, biological replicates, ***p = 0.0002 and 0.0004). (FL) 3D reconstructed airway epithelium cultures were infected apically with 105 PFU of SARS-CoV-2 (strain WA1/2020) then treated with either DMSO or CRE-14 through the basal layer. 24 h after infection, the cells were fixed for EM and 3 sections per sample (n = 2) were analyzed. (F, L) Representative TEM images showing (F) virus double-membrane vesicles (DMVs) and (L) lipid droplets in control (DMSO) and inhibitor treated samples. (G) Number of double membrane vehicles (**p = 0.005) and (H) their average area per image (n = 2, biological replicates, **p = 0.0091) with 18-45 images per sample taken at an 8000× magnification. (I) Frequency distribution of DMV area shown as a Fit Spline. (J) The mean distance between DMVs within each image, calculated from the X, Y coordinates of each DMV and (K) the percent frequency distribution shown as a fit spline. Statistical analyses were done using standard t-test. Data are shown as the mean ± s.e.m. Source data are available online for this figure.
Figure 5
Figure 5. FABP4 blockade limits virus replication and ameliorates pathology in infected hamsters.
Syrian hamsters were infected intranasally with SARS-CoV-2 (Ank1, 100 TCID50) and treated daily with FABP4 inhibitor (CRE-14, 15 mg/kg) or vehicle. (A) Percent of initial body weight over time (B) Lung viral titers pooled from three independent experiments (n = 18 for infected vehicle, n = 17 for CRE-14 treated, and n = 6 for each uninfected group). Statistical analysis was performed using two-way ANOVA for (A) (****p < 0.0001) and a standard t-test for (B) (*p = 0.028). (C, E) Representative immunofluorescence and IHC staining of SARS-CoV-2 nucleocapsid in infected hamster lungs with or without CRE-14 treatment (Scale bar = 1 mm, n = 4). (D) Percentage of nucleocapsid-positive cells relative to total cell count, quantified from immunofluorescence staining (n = 4, biological replicates, **p = 0.0086). Statistical analysis was performed using a standard t-test. (F) Representative H&E staining of control and infected hamster lungs with or without inhibitor treatment (Scale bars: left = 2 mm, right = 200 μm). Low magnification images are shown in (Fig. EV5F). (GL) Pathology evaluation of lung histology in arbitrary units (A.U.), based on pathology scores (n = 6 vehicle treated, n = 5 CRE-14 treated, further details in Table EV2). Statistical analysis was performed using a standard t-test ((G) *p = 0.0391, (H) **p = 0.0063, (J) *p = 0.0158, (K) *p = 0.014, (L) **p = 0.002 and *p = 0.019). (J) Bronchial damage represents combined pathology scores of bronchial epithelial cell necrosis and presence of cellular debris in bronchi. (L) Alveolar damage represents combined pathology scores of alveolar epithelial cell necrosis, cellular debris in alveoli, hyaline membranes, fibrin deposition, and alveolar emphysema. (M) Representative Masson’s trichrome staining of control and infected hamster lungs with or without CRE-14 treatment (Scale bar = 1 mm, n = 4). Low magnification images are shown in (Fig. EV5G). Data are shown as mean ± s.e.m. Source data are available online for this figure.
Figure EV1
Figure EV1. Increase in FABP4 along with biomarkers of COVID-19 disease severity.
(A, B) Maximum concentrations of circulating (A) FABP4 (****p < 0.0001, *p = 0.044) and (B) IL-6 (***p = 0.0005) of cohort 2 of COVID-19 patients (n = 166) stratified based on disease severity (moderate: n = 52, severe: n = 21, and critical: n = 42). (C) Circulating levels of C-reactive protein (****p < 0.0001, ***p = 0.0002, *p = 0.0221), (D) leukocytes (****p < 0.0001, **p = 0.0015) and (E) lymphocytes (****p < 0.0001) of COVID-19 patients measured on the day in which the maximum FABP4 concentration was measured (day post symptom onset). Statistical analysis was performed using one-way ANOVA (n = 283 cohort 1, and n = 116 cohort 2). (FI) Maximum FABP4 concentration pooled from severe and critically ill patients (cohort 1: n = 176, cohort 2: n = 63), stratified based on (F) the presence or absence of comorbidities (listed in Table 3 and Dataset EV2, ****p < 0.0001), (G) age (**p = 0.0011), (H) BMI (***p = 0.0001, **p = 0.0098 and 0.004, *p 0.0263), and (I) the presence or absence of cardiometabolic conditions (diabetes, hypertension, or coronary artery disease, ****p < 0.0001). Statistical analysis for (F), (G) and (I) were performed using Welch’s t-test and one-way ANOVA for (H). Data are shown as the mean ± s.e.m. Source data are available online for this figure.
Figure EV2
Figure EV2. FABP4 regulation during SARS-CoV-2 infection.
(AD) Pre-adipocytes and differentiated adipocytes infected with SARS-CoV-2 (WA1/2020, MOI = 0.1). (A, B) Relative expression of viral (A) genomic RNA (nucleocapsid, ****p < 0.0001, ***p = 0.0003 and 0.0004) and (B) sub-genomic RNA (ORF1ab, ****p < 0.0001), normalized to β-actin. (C) Viral loads measured from supernatant using plaque assay (****p < 0.0001,***p = 0.0001). Data are pooled from two independent experiments (n = 8, biological replicates). Statistical analysis was performed using two-way ANOVA. (D) IL-6 measured by ELISA in the supernatant of differentiated adipocytes with or without virus infection (MOI = 0.1). Data are pooled from two independent experiments (n = 8, biological replicates, ****p < 0.0001). Statistical analysis was performed using one-way ANOVA. (E) Western blots of SARS-CoV-2 nucleocapsid, FABP4, β-actin protein levels, and total protein (Ponceau S staining) in cell lysates of differentiated adipocytes infected with SARS-CoV-2 (MOI = 0.1 or MOI = 1). (F) Quantification of FABP4 band intensity normalized to total protein, representative of two independent experiments (n = 4, biological replicates). (G) FABP4 gene expression relative to β-actin, pooled from two independent experiments (n = 8, biological replicates). (H) FABP4 secretion in the supernatant within 1-hour incubation at the indicated time points following infection. Fold change is calculated relative to uninfected samples. Data are representative of two independent experiments (n = 6, biological replicates, *p = 0.0336). Statistical analysis was performed using two-way ANOVA. (I, J) Representative confocal images of infected adipocytes stained with nucleocapsid (red), FABP4 (green), and lipid droplets (blue). (I) Low magnification and (J) high magnification images of the same samples (Scale bars = 50 μm, magnified regions = 10 μm) (n = 3, biological replicates). (K) Percentage lipid droplet area relative to nucleocapsid-positive area per cell in infected differentiated adipocytes. Pearson correlation coefficient is indicated as r. Data are shown as the mean ± s.e.m. Source data are available online for this figure.
Figure EV3
Figure EV3. FABP4 deficiency reduces virus titers and cell death following coronavirus infection.
(A) Percentage of FABP4 bound with fatty acid (BODIPY FL C12) in the presence or absence of CRE-14 or BMS309403 (n = 3, technical replicates, ****p < 0.0001). (B) Representative MST time traces with blue and red regions indicating Fcold and Fhot, respectively, from which fluorescence measurements were normalized. (C) Dose-response curve showing FABP4 binding to increasing concentrations of CRE-14, represented as normalized fluorescence. KD value (954 nM) represents the average across two technical runs. (D) MRC5 cell viability following administration of titrated doses of CRE-14 at the indicated concentrations of FBS. (E, F) Differentiated adipocytes infected with SARS-CoV-2 (WA1/2020, MOI = 0.1) and treated with either CRE-14 (20 μM) or DMSO. (E) Relative RNA expression of nucleocapsid normalized to β-actin (****p < 0.0001). (F) Viral load measured from the supernatant using plaque assay (****p < 0.0001, ***p = 0.0004). (G) Representative confocal images of control and infected adipocytes (MOI = 1), fixed 48 h post-infection, stained for virus nucleocapsid (red), lipid droplets (yellow), and nuclei (DAPI, blue) (n = 3, biological replicates). Scale bar = 500 μm. (H) Percentage of nucleocapsid-positive area per image, averaging 4–5 images per sample (****p < 0.0001). (I) Representative confocal images showing lipid droplet content (yellow) in WT and FABP4-deficient adipocytes. (J) FABP4-shRNA knockdown and scrambled controls infected with SARS-CoV-2 (WA1/2020, MOI = 1), with viral titers measured by plaque assay from supernatants. Data are pooled from two independent experiments (n = 8, biological replicates, ****p < 0.0001). Statistical analysis was performed using two-way ANOVA. (KM) WT and FABP4-deficient differentiated adipocytes infected and treated with either DMSO, CRE-14, or BMS309403 at indicated doses, with cell lysates collected 48 h post-infection. Data are representative of two independent experiments (n = 3). (K) Western blots showing nucleocapsid, FABP4, and total proteins (Ponceau S staining) in cell lysates. (L, M) Quantifications of nucleocapsid band intensity relative to total protein. Statistical analysis was performed using two-way ANOVA (****p < 0.0001, *p = 0.017). (N) Percentage of lipid droplet area per cell in uninfected and SARS-CoV-2-infected adipocytes with or without FABP4 inhibitor treatment (20 μM, ****p < 0.0001, ***p = 0.0006). (O, P) Adipocytes infected at 5, 10, and 20 days post-differentiation (MOI = 1). (O) Western blot of nucleocapsid, FABP4, and GAPDH protein levels in cell lysates, and (P) viral titers in supernatant measured 48 h post-infection. Data are representative of two independent experiments (n = 3, biological replicates, ****p < 0.0001, ***p = 0.0008, **p = 0.0016). Statistical analysis was performed using two-way ANOVA. Data are shown as mean ± s.e.m. Source data are available online for this figure.
Figure EV4
Figure EV4. FABP4 inhibition reduces viral titers across various SARS-CoV-2 variants.
(A, B) Representative transmission electron microscopy (TEM) images of (A) HBE cells 48 h after infection with SARS-CoV-2 (WA1/2020, MOI = 1) and treatment with DMSO or CRE-14 (10 μM) (n = 3, biological replicates). (B) Uninfected reconstructed airway epithelium 3D culture treated with DMSO, BMS309403, or CRE-14. (C) Area of double membrane vesicles in infected HBE cells, determined from TEM images in (A). Data displayed as the Fit Spline of the percent frequency distribution. (D) Number of DMVs per image (*p = 0.0242), (E) average DMV area per image, and (F) its frequency distribution quantified from TEM images reconstructed airway epithelium cultures infected with SARS-CoV-2 and treated with DMSO or BMS309403. Statistical analysis is performed using standard t-test (n = 3, biological replicates). Data are shown as the mean ± s.e.m. Source data are available online for this figure.
Figure EV5
Figure EV5. Pharmacokinetics of FABP4 inhibition in mice and hamsters.
(A, B) Circulating concentrations of BMS309403 and CRE-14 following a 30 mg/kg subcutaneous injection in C57BL/6J mice. (C) Circulating concentrations of CRE-14 in Syrian hamsters following a subcutaneous injection of 10 mg/kg. Tables show (Cmax) maximal concentration, (Tmax) time to reach maximal concentration, (T1/2) half-life, and (AUC0-last) area under the curve from time zero to the last quantifiable time point (n = 3, biological replicates). (D) Percent body weight over time and (E) lung viral titer of hamsters infected with SARS-CoV-2 (Ank1 strain, 100 TCID50) with or without BMS309403 treatment (30 mg/kg) (n = 5, biological replicates, *p = 0.0215). Statistical analysis was performed using a standard t-test. (F) Representative H&E staining (scale bar = 5 mm) and (G) Masson’s trichrome staining (scale bar=2 mm) of lung sections from control and infected hamsters with or without CRE-14 treatment (n = 4). (H) Representative IHC CD68 staining of infected hamster lungs (Ank1-Dlt strain, 1000 TCID50) with or without CRE-14 treatment (15 mg/kg), shown at low (Scale bar = 1 mm) and high (Scale bar = 100 μm) magnification. The mid-panel highlights CD68-positive cells. (I) Number of detected cells normalized to lung tissue area per lung and (J) percentage of CD68-positive cells quantified from CD68 IHC staining represented in (H). (HJ: n = 6 lungs from 3 biological replicates – hamsters). Data are shown as mean ± s.e.m. Source data are available online for this figure.

References

    1. Baek Y-B, Kwon H-J, Sharif M, Lim J, Lee I-C, Ryu YB, Lee J-I, Kim J-S, Lee Y-S, Kim D-H et al (2022) Therapeutic strategy targeting host lipolysis limits infection by SARS-CoV-2 and influenza A virus. Sig Transduct Target Ther 7:1–12 - PMC - PubMed
    1. Barreto EA, Cruz AS, Veras FP, Martins R, Bernardelli RS, Paiva IM, Lima TM, Singh Y, Guimarães RC, Damasceno S et al (2023) COVID-19-related hyperglycemia is associated with infection of hepatocytes and stimulation of gluconeogenesis. Proc Natl Acad Sci USA 120:e2217119120 - PMC - PubMed
    1. Beucher G, Blondot ML, Celle A, Pied N, Recordon-Pinson P, Esteves P, Faure M, Métifiot M, Lacomme S, Dacheux D et al (2022) Bronchial epithelia from adults and children: SARS-CoV-2 spread via syncytia formation and type III interferon infectivity restriction. Proc Natl Acad Sci USA 119:e2202370119 - PMC - PubMed
    1. Burak MF, Inouye KE, White A, Lee A, Tuncman G, Calay ES, Sekiya M, Tirosh A, Eguchi K, Birrane G et al (2015) Development of a therapeutic monoclonal antibody that targets secreted fatty acid–binding protein aP2 to treat type 2 diabetes. Sci Transl Med 7:319ra205–319ra205 - PubMed
    1. Cao H, Gerhold K, Mayers JR, Wiest MM, Watkins SM, Hotamisligil GS (2008) Identification of a lipokine, a lipid hormone linking adipose tissue to systemic metabolism. Cell 134:933–944 - PMC - PubMed

Substances