. 2025 May;32(5):899-910.
doi: 10.1038/s41418-025-01445-3. Epub 2025 Jan 23.

ARID1A mutations protect follicular lymphoma from FAS-dependent immune surveillance by reducing RUNX3/ETS1-driven FAS-expression

Affiliations

ARID1A mutations protect follicular lymphoma from FAS-dependent immune surveillance by reducing RUNX3/ETS1-driven FAS-expression

Martina Antoniolli et al. Cell Death Differ. 2025 May.

Abstract

The cell death receptor FAS and its ligand (FASLG) play crucial roles in the selection of B cells during the germinal center (GC) reaction. Failure to eliminate potentially harmful B cells via FAS can lead to lymphoproliferation and the development of B cell malignancies. The classic form of follicular lymphoma (FL) is a prototypic GC-derived B cell malignancy, characterized by the t(14;18)(q32;q21)IGH::BCL2 translocation and overexpression of antiapoptotic BCL2. Additional alterations were shown to be clinically relevant, including mutations in ARID1A. ARID1A is part of the SWI/SNF nucleosome remodeling complex that regulates DNA accessibility ("openness"). However, the mechanism how ARID1A mutations contribute to FL pathogenesis remains unclear. We analyzed 151 FL biopsies of patients with advanced-stage disease at initial diagnosis and found that ARID1A mutations were recurrent and mainly disruptive, with an overall frequency of 18%. Additionally, we observed that ARID1A mutant FL showed significantly lower FAS protein expression in the FL tumor cell population. Functional experiments in BCL2-translocated lymphoma cells demonstrated that ARID1A is directly involved in the regulation of FAS, and ARID1A loss leads to decreased FAS protein and gene expression. However, ARID1A loss did not affect FAS promotor openness. Instead, we identified and experimentally validated a previously unknown co-transcriptional complex consisting of RUNX3 and ETS1 that regulates FAS expression, and ARID1A loss leads to reduced RUNX3 promotor openness and gene expression. The reduced FAS levels induced by ARID1A loss rendered lymphoma cells resistant to both soluble and T cell membrane-anchored FASLG-induced apoptosis, and significantly diminished CAR T cell killing in functional experiments. In summary, we have identified a functionally and clinically relevant mechanism how FL cells can escape FAS-dependent immune surveillance, which may also impact the efficacy of T cell-based therapies, including CAR T cells.


Conflict of interest statement

Competing interests: MSub receives industry research support from Amgen, BMS/Celgene, Gilead, Janssen, Miltenyi Biotec, Morphosys, Novartis, Roche, Seattle Genetics and Takeda; she serves as a consultant/advisor to AvenCell, CDR-Life, Ichnos Sciences, Incyte Biosciences, Janssen, Miltenyi Biotec, Molecular Partners, Novartis, Pfizer and Takeda and serves on the speakers’ bureau at Amgen, AstraZeneca, BMS/Celgene, Gilead, GSK, Janssen, Novartis, Pfizer, Roche and Takeda. OW receives industry research support from Roche and Incyte; he serves as a consultant/advisor to Beigene, Roche, Incyte and Epizyme. All other authors declare no relevant competing interests. Ethics: The research was conducted in compliance with the relevant guidelines and regulations, as outlined in the Guidelines for Safeguarding Good Research Practice, Code of Conduct (German Research Foundation, revised version 1.1). Informed consent was obtained from all patients participating in clinical trials, including consent for the use of biopsy material for research purposes as previously described [11, 20]. Approval for molecular analyzes on human material was obtained from institutional and local ethics committees (LMU #223-14, LMU #276-14, LMU #056/00, and LMU #539-15 fed).

Figures

Fig. 1
Fig. 1. ARID1A mutations are associated with low FAS levels in primary human FL biopsies.
A Schematic overview of the GLSG2000 FL cohort and available data. B Lollipop plot of ARID1A mutations in the evaluable GLSG2000 FL cohort. C FAS RNA expression in primary FL biopsies (ARID1AWT (N = 39) vs ARID1AMUT (N = 12)) by digital multiplex gene expression profiling (DMGEP). P-values from Mann-Whitney U-test. D FAS protein abundance in the CD20+ cells normalized to CD3+ cells in primary FL biopsies (ARID1AWT (N = 36) vs ARID1AMUT (N = 7)) by quantitative multispectral imaging (QMI). P-values from Welch test. E Representative multispectral images. Scale bar is 20 µm (low magnification) or 400 µm (high magnification).
Fig. 2
Fig. 2. ARID1A loss results in decreased FAS gene expression but does not affect FAS promotor openness.
A Western blot of single-cell derived clones of OCI-Ly8 and OCI-Ly1 cells with ARID1AWT (WT) or CRISPR-Cas9-introduced heterozygous ARID1A mutation (het) or ARID1A knock-out (KO) (N = 3). B FAS cell surface expression on OCI-Ly8 (left panel) and OCI-Ly1 (right panel) clones by FACS. Bar diagram for the geometric means of independent biological replicates (N = 3). P-values for OCI-Ly8 are from two-sided t-test, OCI-Ly1 from Welch test, Bonferroni adjusted. Each group was tested against WT. C FAS peptide abundance by targeted proteomics in the surface proteome and total proteome lysates of OCI-Ly8 (left panel) and OCI-Ly1 (right panel) clones (N = 3). P-values from two-sided t-test were used. Het and KO values were tested together against WT. D FAS RNA expression by RNA-Seq in OCI-Ly8 and OCI-Ly1 single-cell-derived clones (ARID1AWT (N = 6) and ARID1AMUT (N = 9)). P-values from the DESeq2 R package for differential expression analysis with the default Benjamini-Hochberg correction were used. Het and KO values were tested together against WT. E FAS promotor accessibility (five detected peaks) measured by ATAC-Seq in OCI-Ly8 clones (ARID1AWT (N = 3) and ARID1AMUT (N = 4)). F FAS promotor accessibility (four detected peaks) measured by ATAC-Seq in OCI-Ly1 clones (ARID1AWT (N = 3) and ARID1AMUT (N = 5)). Pooled data from biological replicates (N) are represented as mean±SD.
Fig. 3
Fig. 3. Identification of the FAS-regulating RUNX3/ETS1 co-transcriptional complex.
A Analysis workflow and results of FAS-regulating transcription factors (TFs) and co-transcription factors (co-TFs). B ATAC-Seq differential openness analysis of ARID1AMUT single-cell-derived clones vs ARID1AWT control clones, in OCI-Ly8 (left panel) and OCI-Ly1 (right panel). Heatmap of log10 counts of all detected (open) peaks in the promotor regions of ETS1 and RUNX3 (ARID1AWT (N = 6, in the columns) and ARID1AMUT (N = 9, in the columns)), stars represent statistically significant p-values. C ETS1 gene expression analysis by RNA-Seq in ARID1AMUT clones (blue for het, red for KO) vs ARID1AWT clones (black). D RUNX3 gene expression analysis by RNA-Seq in ARID1AMUT clones (blue for het, red for KO) vs ARID1AWT clones (black). P-values for (C, D) were calculated using the DESeq2 package for differential expression analysis with the default Benjamini-Hochberg correction. Het and KO values were tested together against WT. Pooled data from biological replicates (N) are represented as mean ± SD.
Fig. 4
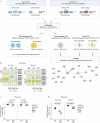
Fig. 4. Experimental validation of the FAS-regulating RUNX3/ETS1 co-transcriptional complex.
A Schematic of the FAS gene with annotated enhancer regions (yellow) and promotor (red), ETS1 binding sites (black), accessible chromatin regions from our ATAC-Seq data (blue), ETS1 binding sites from published ChIP-Seq data (brown) [24, 25], and the FAS promotor regions cloned for the reporter assay (purple). B ETS1 TF binding motif in FAS accessible promotor regions. C Luciferase reporter assay with co-transfection of the ETS1 expression vector and pGL3-FAS constructs in 293 T cells (N = 3). P-values are from linear regression model on square root transformed dose and non-transformed response values. D Western blot of inputs and ETS1-immunoprecipitated OCI-Ly1 (WT and KO) (N = 2). E Western blot of OCI-Ly8 clones (ARID1A WT, het, and KO) with or without stable doxycycline (dox)-induced overexpression of RUNX3 (N = 3). F Rescue of FAS RNA levels upon RUNX3 overexpression in OCI-Ly8 measured by quantitative real-time PCR (TaqMan assay) (N = 3). P-values are from two-sided t-test, Bonferroni adjusted. All groups were tested against WT, and het + RUNX3 was tested against het. G Rescue of FAS cell-surface protein levels upon RUNX3 over expression in OCI-Ly8 measured by FACS (N = 3). P-value is from two-sided t-test. Het + RUNX3 was tested against het. Pooled data from biological replicates (N) are represented as mean±SD. H FAS surface expression comparing ARID1AWT (“+”), ARID1Ahet (“−“) with and without ETS1-targeting shRNA (shRNA91) with and without RUNX3 overexpression in OCI-Ly1 (left bar plot) and OCI-Ly8 (right bar plot) cells by FACS (N = 3). P-values are from paired Welch-test, Bonferroni adjusted.
Fig. 5
Fig. 5. ARID1A loss leads to functionally relevant reduction of FAS/FASLG-induced apoptosis.
A Schematic of the FASLG-induced apoptosis assay (soluble human recombinant FAS ligand treatment). B Percent AnnexinV-positive OCI-Ly8 (left panel) and OCI-Ly1 (right panel) clones with ARID1A WT, het, KO and overexpression of RUNX3 on het (het + RUNX3) after 24 h treatment with increasing dose of purified soluble human recombinant FAS ligand (N = 3). P-values are from a linear regression on square root transformed values tested against WT and Bonferroni-adjusted. C Schematic of the T-cell mediated killing assay. D Conjugate formation of OCI-Ly8 cells (CFSE+) and CD8+ T-cells (VPD+); double-positive conjugates (CSFE+/VPD+) quantified as percentage of total CD8+ T-cells (VPD+) (N = 5) at indicated conditions. E T cell-mediated cytotoxicity assessed by quantifying the fraction of OCI-Ly8 cells (CFSE + ) undergoing apoptosis upon co-culture with CD8+ T cells, expressed as a percentage of all measured cells under the indicated conditions (N = 5, biological replicates performed with different healthy T cell donors). P-value is from the paired Welch test. Het + RUNX3 was tested against het. Pooled data from biological replicates (N) are represented as mean±SD. F Schematic representation of the CAR T-cell mediated killing assay. G Luciferized OCI-Ly8 ARID1AWT cells were co-cultured with CD19-CAR T cells at a 1:3 effector-to-target (E:T) ratio with or without a FAS-blocking antibody or an IgG isotype control. Luminescence was measured after 24 h and normalized to the baseline luminescence at 1 h. P-values were calculated using the paired Welch test, comparing WT against WT + FAS and WT + EV. Pooled data from biological replicates (N = 3; performed with CAR T-cells from different healthy donors) are represented as mean±SD. H Luciferized OCI-Ly8 cells of indicated genotypes were co-cultured with CD19-CAR T cells at a 1:3 effector-to-target (E:T) ratio for 48 h. (N = 3, biological replicates performed with CAR T-cells from different healthy donors). P-values are from the paired Welch test. WT was tested against het, KO and het + ARID1A. Pooled data from biological replicates are represented as mean±SD.

References

    1. Hanahan D, Weinberg RA. The hallmarks of cancer. Cell. 2000;100:57–70. - PubMed
    1. Sung H, Ferlay J, Siegel RL, Laversanne M, Soerjomataram I, Jemal A, et al. Global cancer statistics 2020: GLOBOCAN estimates of incidence and mortality worldwide for 36 cancers in 185 countries. CA Cancer J Clin. 2021;71:209–49. - PubMed
    1. Victora GD, Nussenzweig MC. Germinal centers. Annu Rev Immunol. 2012;30:429–57. - PubMed
    1. Yoshino T, Kondo E, Cao L, Takahashi K, Hayashi K, Nomura S, et al. Inverse expression of bcl-2 protein and Fas antigen in lymphoblasts in peripheral lymph nodes and activated peripheral blood T and B lymphocytes. Blood. 1994;83:1856–61. - PubMed
    1. Campo E, Jaffe ES, Cook JR, Quintanilla-Martinez L, Swerdlow SH, Anderson KC, et al. The international consensus classification of mature lymphoid neoplasms: a report from the clinical advisory committee. Blood J Am Soc Hematol. 2022;140:1229–53. - PMC - PubMed

MeSH terms

LinkOut - more resources