. 2025 Feb;57(2):314-322.
doi: 10.1038/s41588-024-02054-5. Epub 2025 Jan 22.

In vivo CRISPR-Cas9 genome editing in mice identifies genetic modifiers of somatic CAG repeat instability in Huntington's disease

Affiliations

In vivo CRISPR-Cas9 genome editing in mice identifies genetic modifiers of somatic CAG repeat instability in Huntington's disease

Ricardo Mouro Pinto et al. Nat Genet. 2025 Feb.

Abstract

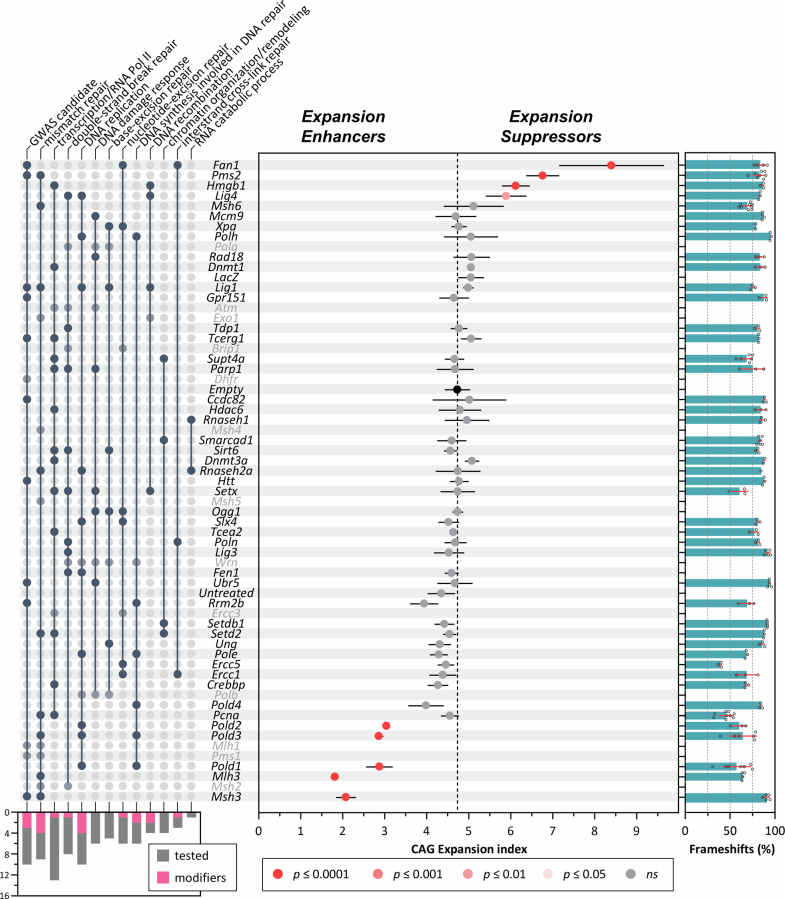
Huntington's disease, one of more than 50 inherited repeat expansion disorders1, is a dominantly inherited neurodegenerative disease caused by a CAG expansion in HTT2. Inherited CAG repeat length is the primary determinant of age of onset, with human genetic studies underscoring that the disease is driven by the CAG length-dependent propensity of the repeat to further expand in the brain3-9. Routes to slowing somatic CAG expansion, therefore, hold promise for disease-modifying therapies. Several DNA repair genes, notably in the mismatch repair pathway, modify somatic expansion in Huntington's disease mouse models10. To identify novel modifiers of somatic expansion, we used CRISPR-Cas9 editing in Huntington's disease knock-in mice to enable in vivo screening of expansion-modifier candidates at scale. This included testing of Huntington's disease onset modifier genes emerging from human genome-wide association studies as well as interactions between modifier genes, providing insight into pathways underlying CAG expansion and potential therapeutic targets.


Conflict of interest statement

Competing interests: R.M.P. and V.C.W. received research support from Pfizer for this study. J.F.G. and V.C.W. were founding scientific advisory board members with a financial interest in Triplet Therapeutics. Their financial interests were reviewed and are managed by MGH and Mass General Brigham (MGB) in accordance with their conflict-of-interest policies. V.C.W. is a scientific advisory board member of LoQus23 Therapeutics and has provided paid consulting services to Acadia Pharmaceuticals, Alnylam, Biogen, Passage Bio and Rgenta Therapeutics. J.F.G. consults for Transine Therapeutics (dba Harness Therapeutics) and has previously provided paid consulting services to Wave Therapeutics USA, Biogen and Pfizer. The other authors declare no competing interests.

Figures

Fig. 1
Fig. 1. In vivo CRISPR editing platform.
Adeno-associated virus (AAV8 or PHP.eB) expressing mCherry and a sgRNA targeting a gene of interest is administered to HttQ111 mice, which constitutively express Cas9. Tail vein injections (TVI) are performed at 6 weeks of age and mice are aged to 12 weeks or 24 weeks for determination of Htt CAG repeat expansion in the liver or striatum. The blue line depicts a typical profile of CAG repeat lengths in untreated mice that would be observed if there was no effect of the sgRNA, and the green and red lines depict hypothetical CAG length profiles induced by sgRNAs that suppress or promote repeat expansion, respectively. The AAV vector is shown in more detail in Extended Data Fig. 1. KO, knockout.
Fig. 2
Fig. 2. Validation of CRISPR editing platform with known strong modifier genes.
a, Somatic CAG expansion indices, determined from fragment sizing of Htt CAG repeat-containing PCR amplicons of untreated HttQ111 Cas9 mice livers from 6 to 24 weeks of age, and in 12-week-old mice injected at 6 weeks of age with control AAV8s (empty vector or expressing sgRNA targeting LacZ) or AAV8 expressing sgRNAs targeting genes in which null mutations are known to suppress (Msh2, Msh3, Mlh1, Mlh3) or enhance (Fan1) expansion. Transduction with empty AAV8 or a sgRNA targeting LacZ resulted in a slight background increase in expansion relative to 12-week-old untreated mice, and therefore effects of target sgRNAs are compared to the empty AAV8 vector control using a one-way ANOVA with Dunnett’s multiple comparison correction. Msh2, Msh3, Mlh1, Mlh3 and Fan1 relative to empty AAV8, ****P < 0.0001; ns, not significant. Bars show mean ± s.d. with overlaid individual data points. Dashed horizontal lines and shaded gray regions show mean and 95% confidence interval expansion indices in 6-week-old untreated mice (‘START’) and in empty AAV8 control-treated mice at 12 weeks of age (‘STOP’). The heatmap below shows the percent frameshift mutation (mean) for each targeted gene, with a green–yellow–red (0–100%) color scale. See Supplementary Table 2 for summary statistics, number of animals used (n) and P values. b, Examples of GeneMapper profiles of Htt CAG repeat PCR amplicons.
Fig. 3
Fig. 3. Candidate gene CRISPR knockout screen identifies novel modifiers of CAG expansion.
Ranked mean ± s.d. CAG expansion indices (as Z-scores) in livers from 12-week-old HttQ111 Cas9 mice treated at 6 weeks of age with AAV8 expressing sgRNA targeting candidate genes of interest and including empty vector, LacZ and untreated controls (see Supplementary Table 1 for sgRNA details). Adjusted P values were determined by one-way ANOVA with Dunnett’s multiple comparison test relative to empty vector (vertical dashed line). The bar graph on the right shows the percent frameshift mutation (mean ± s.d. with individual data points overlaid) for each targeted gene. See Supplementary Table 2 for summary statistics, number of animals used (n) and P values. The UpSet panel on the left (filled dot shows presence of the gene in the pathway; lines connect filled dots within a pathway to aid visualization) indicates candidate genes at genome-wide significant age at onset modifier loci (‘GWAS candidate’), followed by major Gene Ontology (GO) biological processes ranked in descending order of number of genes tested. To minimize redundancy, ‘transcription/regulation by RNA Polymerase II’ and ‘chromatin organization/remodeling’ are aggregated terms combined from standard GO terms. See Supplementary Table 3 for the full set of GO biological processes and Supplementary Table 4 for the rationale for gene inclusion. The bottom left bar graph indicates, for each pathway, the number of genes modifying expansion (adjusted P < 0.05) relative to the number of genes tested. Note that the reduced expansion index obtained targeting Pcna is probably a result of hepatocyte loss (Extended Data Fig. 8).
Fig. 4
Fig. 4. Modification of somatic CAG expansion in the striatum.
a, Somatic CAG expansion indices, determined from fragment sizing of Htt CAG repeat-containing PCR amplicons of untreated HttQ111 Cas9 mice striata from 6 to 24 weeks of age, and in 24-week-old mice injected at 6 weeks of age with control PHP.eB (empty vector) or PHP.eB expressing sgRNAs targeting genes of interest. *P < 0.05, ****P < 0.0001 relative to empty vector. One-way ANOVA with Dunnett’s multiple comparison correction was used. Bars show mean ± s.d. with overlaid individual data points. Dashed horizontal lines and shaded gray regions show mean and 95% confidence interval expansion indices in 6-week-old untreated mice and in empty vector control-treated mice at 24 weeks of age. The heatmap below shows the percent frameshift mutation (mean) for each targeted gene, with a green–yellow–red (0–100%) color scale. See Supplementary Table 6 for summary statistics, number of animals used (n) and P values. b, Examples of GeneMapper profiles of Htt CAG repeat PCR amplicons.
Fig. 5
Fig. 5. Interactions between modifier genes.
Interactions between pairs of expansion modifiers Msh2, Msh3, Mlh1, Mlh3, Pms1, Msh6, Pms2 and Fan1 were tested by co-injecting two AAV8s, each targeting a different gene. Expansion enhancers are depicted in red and expansion suppressors are depicted in green. Bars show mean ± s.d. with overlaid individual data points of CAG expansion index of HttQ111 Cas9 mice livers at 12 weeks of age following injection with either one (single target) or two (dual target) AAV8s. Dashed horizontal lines and shaded gray regions show mean and 95% confidence interval expansion indices in 6-week-old untreated mice (‘START’) and in empty vector control-treated mice at 12 weeks of age (‘STOP’). The bottom right panel shows the average percent frameshift mutation for each guide when injected in a single or dual gene targeting experiment, with a green–yellow–red (0–100%) color scale. One-way ANOVA with Dunnett’s multiple comparison correction was used. In dual guide targeting with any of the expansion enhancers (Msh2, Msh3, Mlh1, Mlh3, Pms1), expansion indices were not significantly different from those obtained when targeting each enhancer alone (P > 0.999 in all cases). In combinations of expansion enhancers, Fan1+Pms2 dual guide targeting resulted in an expansion index that was not significantly different from that obtained targeting Fan1 alone (P = 0.8219). By contrast, targeting Fan1+Msh6 resulted in a significantly lower expansion index than that targeting Fan1 alone (P < 0.0001) and a significantly greater expansion index than that targeting Msh6 alone (P < 0.0001). Targeting Pms2+Msh6 resulted in a significantly lower expansion index than that targeting Pms2 alone (P < 0.0001) and a slightly greater expansion index than that targeting Msh6 alone (P = 0.0632). It appears, therefore, that the effect of the Pms2 knockout is redundant to that of the Fan1 knockout, and the effects of both Fan1 and Pms2 knockouts are at least partially dependent on the presence of Msh6. See Supplementary Table 7 for summary statistics, number of animals used (n) and P values for all interactions.
Fig. 6
Fig. 6. Model integrating major modifiers of repeat expansion.
The model depicts the principal pathway driving repeat expansion, with main expansion enhancers shown. CAG/CTG loop-outs are generated, for example in the process of transcription, chromatin remodeling or breathing, and are preferentially recognized by MutSβ (MSH2–MSH3), which preferentially recruits MutLγ (MLH1–MLH3),–. The role of PMS1 is unclear, but it may have a facilitating role as part of the MutLβ (MLH1–PMS1) dimer at the level of chromatin structure, potentially stabilizing MutSβ or the subsequent MutSβ–MutLγ complex. MutLγ cleaves the DNA strand opposite the loop-out, driving an expansion bias,. Strand-displacement synthesis by POLδ results in gap-filling that includes the looped-out DNA. Exonuclease-dependent strand excision cannot be ruled out, and minor roles for DNA POLε and POLβ are also implicated (Fig. 3). DNA ligase seals the resulting nick, and if the loop-outs on each strand are both processed independently, the length of the loop-out will be incorporated as an expansion. Expansion suppressors such as FAN1 PMS2, MSH6 and HMGB1 may interfere at various steps in this pathway. MutSα (MSH2–PMS6) may decrease MutSβ complex formation and/or binding to loop-outs. MutLα (MLH1–PMS2) to loop-outs bound by MutSβ results in endonucleolytic cleavage on either strand, with no expansion bias,. FAN1 may inhibit MutSβ binding by its direct binding to loop-outs or may inhibit MutLγ recruitment by sequestering MLH1 (ref. ). The suppressive function of HMGB1 is unclear but could potentially act at several steps. Other factors (Fig. 3) may also have roles in enhancing or suppressing this pathway. Thus, the likelihood of an expansion event will depend on the steady-state levels of the different expansion enhancer and suppressor proteins or complexes, which are likely to differ by cell type. Genetic interactions (Fig. 5) indicate that PMS2 is redundant to FAN1 in its expansion-suppressing function in liver. The reduced impacts of the Fan1 and Pms2 knockouts in the absence of Msh6 (Fig. 5) are not readily explained, and we speculate that this may implicate a direct role for MSH6 and the existence of an MSH6-dependent factor that enhances FAN1 and PMS2’s expansion-suppressing effect. The model is based on an assumption that MSH and MLH subunits function as part of canonical heterodimeric complexes; however, there is evidence for functions of PMS2 and MLH3 that are independent of MLH1 (summarized in a previous publication), and similarly, noncanonical roles for MMR subunits may also be plausible in mechanisms underlying CAG instability. Dark red lines represent repeat sequence; blue lines are flanking non-repeat sequence. Triangles mark endonuclease cleavage.
Extended Data Fig. 1
Extended Data Fig. 1. AAV vector expressing sgRNA and mCherry reporter.
ITR, Inverted Terminal Repeat; CAGGS, hybrid promoter composed of the CMV immediate-early enhancer, CBA promoter, and CBA intron 1/exon 1; WPRE, Woodchuck Hepatitis Virus Posttranscriptional Regulatory Element; RBG, rabbit beta-globin polyadenylation signal; U6, human U6 promoter; sgRNA, single guide RNA.
Extended Data Fig. 2
Extended Data Fig. 2. CAG expansion trajectories over time and simulated impact of modifier gene editing.
a. Normalized GeneMapper peak height data from Htt CAG repeat-containing PCR products from liver, averaged across mice (N=1-4) at different ages. b. CAG expansion indices from liver, striatum and spleen from the same mice (N=3-4). c. Genomic DNA mixing experiment to simulate editing. Liver genomic DNA from 5-week mice (stable) was mixed in different proportions with liver genomic DNA from mice between 9 and 24 weeks of age. Proportions were 0% 5-week:100% other, 25% 5-week:75% other; 50% 5-week:50% other, and 75% 5-week:25% other, simulating the impact of no editing or 25%, 50% and 75% bi-allelic editing of a strong-effect modifier gene suppressing expansion. These results were used to guide the experimental paradigm of injecting AAV8 at 6 weeks of age (‘Start’) and analyses of CAG expansion at 12 weeks of age (‘Stop’). Analyses of 12-week mice permits relatively fast in vivo analyses, minimizes variation in expansion between untreated animals that increases with age (panel B) and is predicted to provide the sensitivity to detect the impact of a strong effect modifier suppressing expansion with an editing efficiency as low as 25%.
Extended Data Fig. 3
Extended Data Fig. 3. AAV8 transduction efficiency in the liver.
a. mCherry immnofluorescence in liver sections from 12-week HttQ111 Cas9 mice treated at 6 weeks with AAV8 vectors expressing mCherry and sgRNAs targeting various modifier genes. This qualitative analysis was done with a single animal for each condition and a single technical replicate was performed. The % of gene editing (frameshift + non-frameshift) is shown for that animal. b. Magnified mCherry immunofluorescence images at different exposure times from empty vector-treated or untreated mice.
Extended Data Fig. 4
Extended Data Fig. 4. Relationship of CAG expansion in the liver to inherited repeat length.
Liver expansion indices measured at 12 weeks versus inherited CAG length (determined in tail at weaning at Laragen) in untreated, mice and control (empty vector and LacZ)-treated mice over the range of CAGs (112-119) used in this study. The lack of/very minimal impact of inherited CAG length in this range (apparent to the greatest extent in the untreated mice due to the large number of mice analyzed) indicates that CAG length variation within this range does not confound our interpretation of the effects of modifier genes.
Extended Data Fig. 5
Extended Data Fig. 5. Western blot analyses.
Western blot analyses in 12-week livers from HttQ111 Cas9 mice, either untreated or treated at 6 weeks with empty AAV8 vector or AAV8 vectors expressing sgRNAs targeting Mlh1, Msh3, Msh2, Msh6, Pms1 or Pold1. Western blots are probed with antibodies to MLH1 (A), MSH3 (B), MSH2 (C), MSH6 (D), PMS1 (E) or POLD1 (F). Also loaded as controls are extracts from 6-month liver, cortex or testis of constitutional null mice and their littermate controls (Mlh1-/-, Mlh1+/+, Msh3-/-, Msh3+/+, Msh2-/-, Msh2+/+, Mshs6-/-, Msh6+/+). Total protein stain (Novex) is shown under each western blot (A, B = 75 µg, C = 60 µg, D = 35 µg, E, F = 40 µg total protein/well). In panels B and D, CRISPR-Cas9 knockout of Msh2 also results in dramatically reduced levels of MSH3 and MSH6, respectively, due to the destabilization of MutSβ and MutSα dimers. In panels E, constitutive knockout of Mlh1 also results in reduced levels of PMS1 due to the destabilization of MutLβ dimer. Each lane represents biological replicates (separate animals) for each condition and a single technical replicate was performed. Source data
Extended Data Fig. 6
Extended Data Fig. 6. Enhanced editing in hepatocytes relative to whole liver.
a. Example GeneMapper traces from paired hepatocyte and liver DNAs of empty vector, Msh3 guide and Fan1 guide-treated mice. The modal peak in liver is filled in blue. b. Mean expansion % frameshift mutation in liver compared to hepatocytes, with a green-yellow-red (0–100%) color scale. Refer also to Supplementary Table 2.
Extended Data Fig. 7
Extended Data Fig. 7. Expansion indices in enriched hepatocytes.
Mean±s.d CAG expansion indices in hepatocytes enriched from livers of 12-week HttQ111 Cas9 mice treated at 6 weeks of age with AAV8 expressing sgRNA targeting candidate genes of interest and including empty vector, LacZ and untreated controls (see Supplementary Table 1 for sgRNA details). Enriched hepatocytes were analyzed in a subset of mice for the majority of genes tested. The order of genes/conditions represented matches that in Fig. 3. Adjusted p-values are determined in a one-way ANOVA with Dunnett’s multiple comparison test relative to empty vector. The bar graph on the right shows the % frameshift mutation (mean±s.d with individual data points overlaid) for each targeted gene. See Supplementary Table 2 for summary statistics, number of animals used (n) and p-values. The panel on the left indicates major Gene Ontology (GO) Biological Processes represented by these genes and ‘GWAS Candidate’ indicates candidate genes at genome-wide significant age at onset modifier loci. To minimize redundancy, ‘transcription/regulation by RNA Polymerase II’ is combined from GO terms ‘negative regulation of transcription by RNA polymerase II’, ‘positive regulation of transcription by RNA polymerase II’ and ‘transcription elongation from RNA polymerase II’, and ‘chromatin organization/remodeling’ is combined from GO terms ‘chromatin organization’ and ‘chromatin remodeling’. See Supplementary Table 3 for the full set of GO Biological Processes and Supplementary Table 4 for rationale for gene inclusion. The bottom left bar graph indicates, for each pathway, the number of genes modifying expansion (adjusted p<0.05) relative to the number of genes tested.
Extended Data Fig. 8
Extended Data Fig. 8. The impact of CRISPR-Cas9 editing of Pcna.
a. Representative images of Hematoxylin and Eosin (H&E) staining performed on liver sections of HttQ111 Cas9 mice at 8 (N=3), 10 (N=4) and 12 weeks (N=6) of age treated with AAV8 targeting Pcna at 6 weeks of age. At 12 weeks of age the tissue appears largely intact, with hepatocyte nuclei clearly discernable. At younger ages mice show evidence of hepatocyte/liver damage with indistinct nuclear morphology and disorganized tissue structure with enlarged trabeculae. b. Zoomed in images of H&E staining in 10-week Pcna guide-treated liver compared to 10-week Xpa guide-treated liver as a control, and immunostaining for Ki67, a proliferation marker, in the same mice. In Pcna guide-treated mice, Ki67-positive cells were observed at 10 weeks, to a lesser extent at 8 weeks, were largely absent at 12 weeks and were not observed in Xpa-guide treated livers at any age. c. Editing in hepatocytes over the 8>10>12-week time course in Pcna- and Xpa-guide treated mice. CRISPR-Cas9 targeting of Pcna, but not Xpa, resulted in a shift from a high percentage of frameshift mutations (8 weeks), to a majority of unedited reads (10 weeks) and then to an increased fraction of edited reads with a relatively high proportion of non-frameshift mutations (12 weeks). Taken together with the histological analyses, these data indicate that CRISPR-Cas9 targeting of Pcna results in hepatocyte cell degeneration and regeneration. Patterns of gene editing over time may reflect the degeneration of hepatocytes harboring homozygous loss of function mutations and the subsequent selection in the regenerating liver of hepatocytes harboring either heterozygous loss of function mutations or non-frameshift mutations compatible with cell division.
Extended Data Fig. 9
Extended Data Fig. 9. Liver expansion in PHP.eB injected mice.
a. Somatic CAG expansion indices, determined from fragment sizing of Htt CAG repeat-containing PCR amplicons of untreated HttQ111 Cas9 mice livers from 6 to 24 weeks of age, and in 24-week mice injected at 6 weeks of age with control PHP.eB (empty vector) or PHP.eB expressing sgRNAs targeting genes of interest. **** p<0.0001 relative to empty vector (One-way ANOVA with Dunnett’s multiple comparison correction). Bars show mean±s.d with overlaid individual data points. Dotted lines/shaded grey regions show mean/95% confidence interval expansion indices in 6-week untreated mice and in empty vector control-treated mice at 24 weeks of age. See Supplementary Table 6 for summary statistics, number of animals used (n) and p-values. b. Liver CAG expansion indices plotted against striatal expansion indices determined in the same 24-week mice. Dotted line = line of identity. Expansion indices tend to be lower in the liver than in the striatum (points to the right of the identity line), with the exception of Fan1 guide-treated mice where expansion indices are greater in the liver (points to the left of the identity line), indicating a relatively large expansion-promoting impact of Fan1 knockout in this tissue. c. CRISPR editing efficiencies in liver plotted against striatum as determined in the same 24-week PHP.eB-treated mice. Dotted line = line of identity. Editing efficiency seems comparable between the two different tissues, with the exception of Pold1 and Pold3 which seem to have weaker editing in the liver (points to the right of the identity line), potentially due to POLD’s role in replication.
Extended Data Fig. 10
Extended Data Fig. 10. Dual guide targeting of Dnmt1/Dnmt3a, Rnaseh1/Rnaseh2a and Lig1/Lig3.
Potential functional redundancies were tested in dual guide experiments targeting Dnm1+Dnmt3, Rnaseh1+Rnaseh2a and Lig1+Lig3. Bars show mean±s.d, with overlaid individual data points, of CAG expansion index of HttQ111 Cas9 mice livers at 12 weeks of age following injection with either one (single target) or two (dual target) AAV8s. Dotted lines/shaded grey regions show mean/95% confidence interval expansion indices in 6-week untreated mice at and in empty vector control-treated mice at 12 weeks of age. Dnmt1, n=10; Dnmt3a, n=9; Lig1, n=10; Lig3, n=5; Rnaseh1, n=5; Rnaseh2a, n=6; Rnaseh1+Rnaseh2a, n=3; Lig1+Lig3, n=3; Dnmt1+Dnmt3a, n=7.

Update of

Similar articles

Cited by

References

    1. Depienne, C. & Mandel, J.-L. 30 years of repeat expansion disorders: What have we learned and what are the remaining challenges? Am. J. Hum. Genet.108, 764–785 (2021). - PMC - PubMed
    1. The Huntington’s Disease Collaborative Research Group A novel gene containing a trinucleotide repeat that is expanded and unstable on Huntington’s disease chromosomes. Cell72, 971–983 (1993). - PubMed
    1. Swami, M. et al. Somatic expansion of the Huntington’s disease CAG repeat in the brain is associated with an earlier age of disease onset. Hum. Mol. Genet.18, 3039–3047 (2009). - PMC - PubMed
    1. Ciosi, M. et al. A genetic association study of glutamine-encoding DNA sequence structures, somatic CAG expansion, and DNA repair gene variants, with Huntington disease clinical outcomes. EBioMedicine48, 568–580 (2019). - PMC - PubMed
    1. Hensman Moss, D. J. et al. Identification of genetic variants associated with Huntington’s disease progression: a genome-wide association study. Lancet Neurol.16, 701–711 (2017). - PubMed

Substances

LinkOut - more resources