. 2025 Feb;638(8049):225-236.
doi: 10.1038/s41586-024-08439-0. Epub 2025 Jan 22.

Immune evasion through mitochondrial transfer in the tumour microenvironment

Affiliations

Immune evasion through mitochondrial transfer in the tumour microenvironment

Hideki Ikeda et al. Nature. 2025 Feb.

Erratum in

  • Publisher Correction: Immune evasion through mitochondrial transfer in the tumour microenvironment.
    Ikeda H, Kawase K, Nishi T, Watanabe T, Takenaga K, Inozume T, Ishino T, Aki S, Lin J, Kawashima S, Nagasaki J, Ueda Y, Suzuki S, Makinoshima H, Itami M, Nakamura Y, Tatsumi Y, Suenaga Y, Morinaga T, Honobe-Tabuchi A, Ohnuma T, Kawamura T, Umeda Y, Nakamura Y, Kiniwa Y, Ichihara E, Hayashi H, Ikeda JI, Hanazawa T, Toyooka S, Mano H, Suzuki T, Osawa T, Kawazu M, Togashi Y. Ikeda H, et al. Nature. 2025 Mar;639(8053):E5. doi: 10.1038/s41586-025-08764-y. Nature. 2025. PMID: 39948434 Free PMC article. No abstract available.
  • Author Correction: Immune evasion through mitochondrial transfer in the tumour microenvironment.
    Ikeda H, Kawase K, Nishi T, Watanabe T, Takenaga K, Inozume T, Ishino T, Aki S, Lin J, Kawashima S, Nagasaki J, Ueda Y, Suzuki S, Makinoshima H, Itami M, Nakamura Y, Tatsumi Y, Suenaga Y, Morinaga T, Honobe-Tabuchi A, Ohnuma T, Kawamura T, Umeda Y, Nakamura Y, Kiniwa Y, Ichihara E, Hayashi H, Ikeda JI, Hanazawa T, Toyooka S, Mano H, Suzuki T, Osawa T, Kawazu M, Togashi Y. Ikeda H, et al. Nature. 2025 Aug;644(8076):E33. doi: 10.1038/s41586-025-09408-x. Nature. 2025. PMID: 40715527 Free PMC article. No abstract available.

Abstract

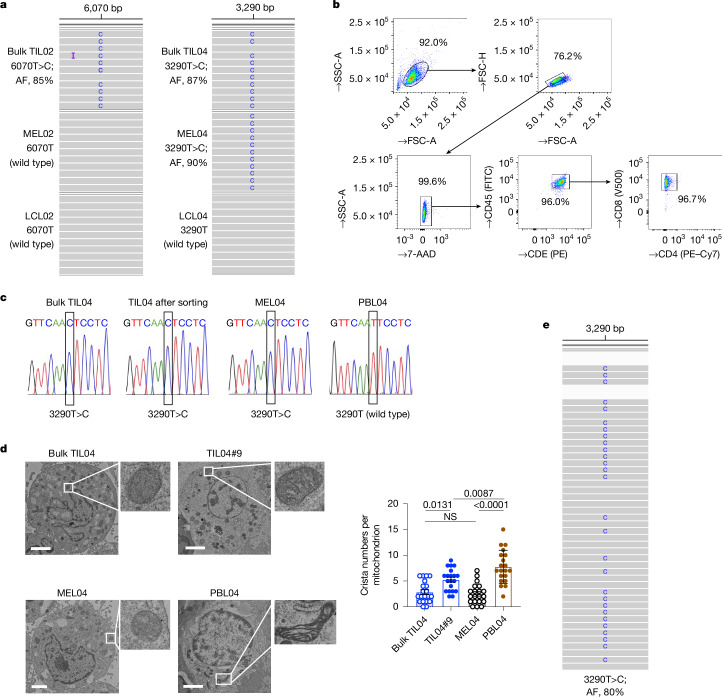
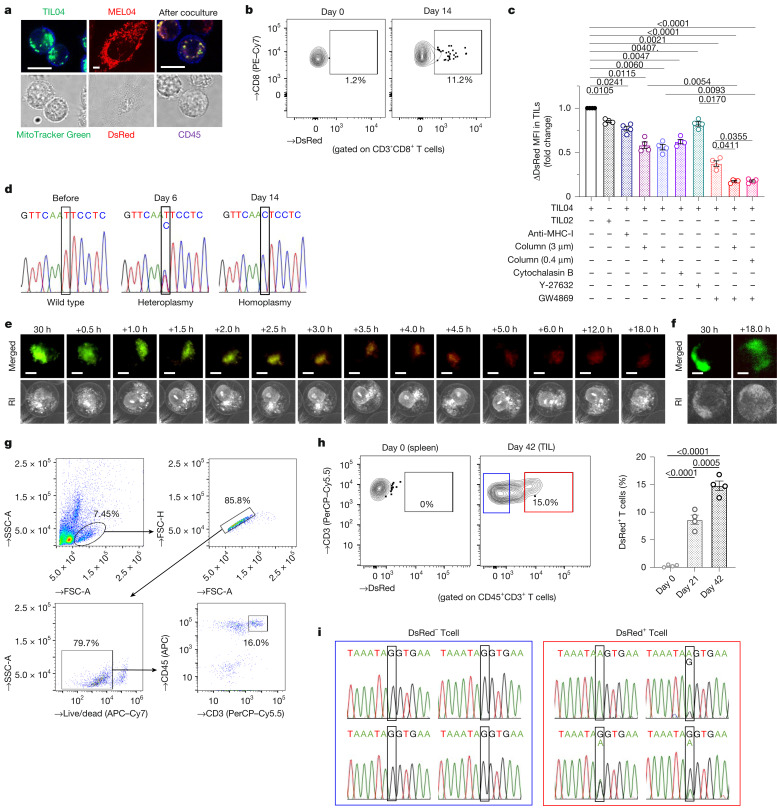
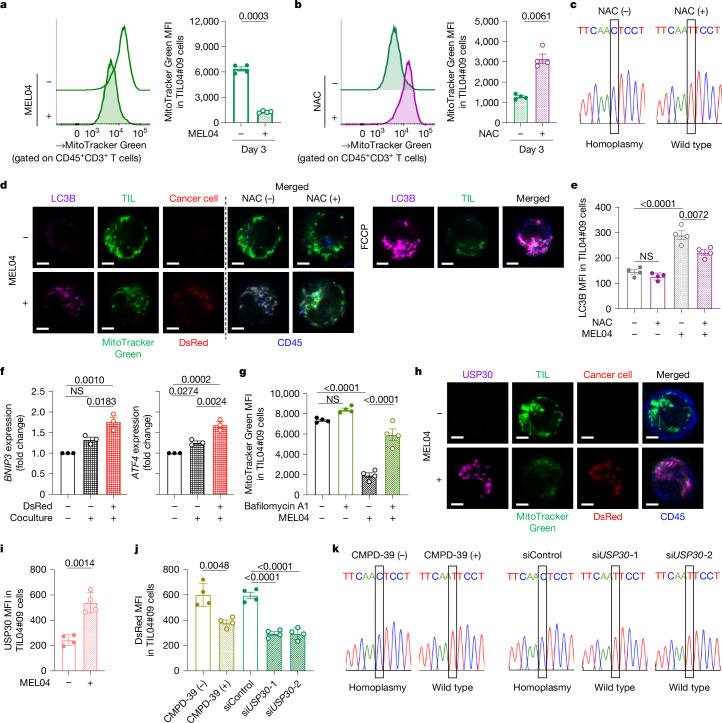
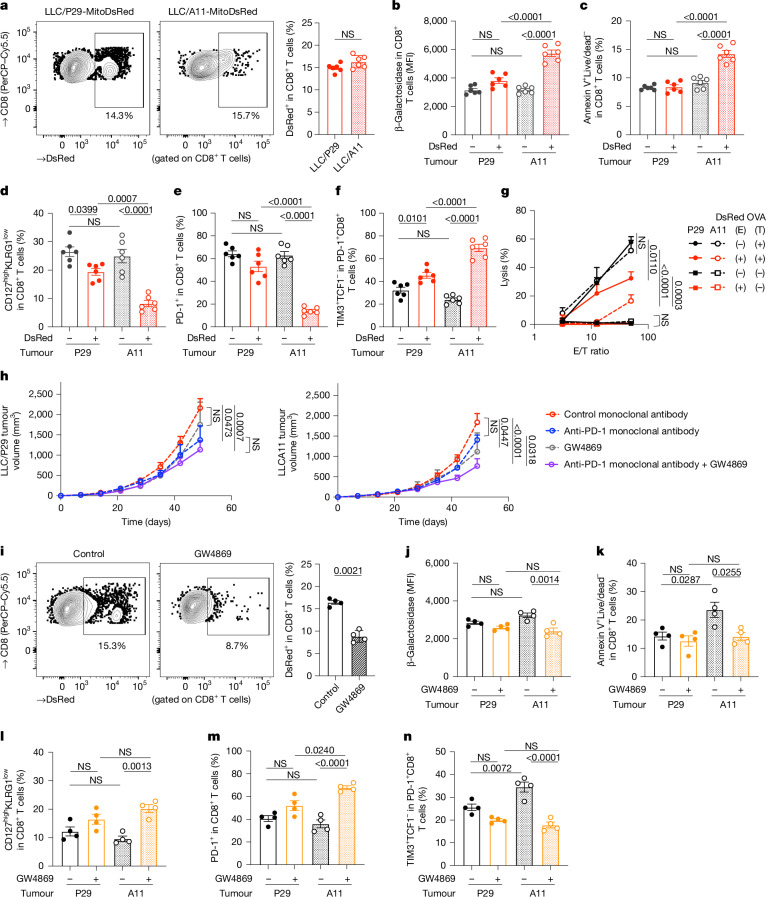
Cancer cells in the tumour microenvironment use various mechanisms to evade the immune system, particularly T cell attack1. For example, metabolic reprogramming in the tumour microenvironment and mitochondrial dysfunction in tumour-infiltrating lymphocytes (TILs) impair antitumour immune responses2-4. However, detailed mechanisms of such processes remain unclear. Here we analyse clinical specimens and identify mitochondrial DNA (mtDNA) mutations in TILs that are shared with cancer cells. Moreover, mitochondria with mtDNA mutations from cancer cells are able to transfer to TILs. Typically, mitochondria in TILs readily undergo mitophagy through reactive oxygen species. However, mitochondria transferred from cancer cells do not undergo mitophagy, which we find is due to mitophagy-inhibitory molecules. These molecules attach to mitochondria and together are transferred to TILs, which results in homoplasmic replacement. T cells that acquire mtDNA mutations from cancer cells exhibit metabolic abnormalities and senescence, with defects in effector functions and memory formation. This in turn leads to impaired antitumour immunity both in vitro and in vivo. Accordingly, the presence of an mtDNA mutation in tumour tissue is a poor prognostic factor for immune checkpoint inhibitors in patients with melanoma or non-small-cell lung cancer. These findings reveal a previously unknown mechanism of cancer immune evasion through mitochondrial transfer and can contribute to the development of future cancer immunotherapies.


Conflict of interest statement

Competing interests: T. Inozume. received honoraria from Ono Pharmaceutical, Bristol-Myers Squibb and MSD outside this study. S.S. received honoraria from AstraZeneca outside this study. Yasuhiro Nakamura. received honoraria from Ono Pharmaceutical and Novartis Pharma outside this study. E.I. received grants from Janssen Pharmaceutical, Bristol-Myers Squibb, Takeda Pharmaceutical, Pfizer Japan and Ono Pharmaceutical; honoraria from AstraZeneca, Novartis Pharma, Janssen Pharmaceutical, Boehringer Ingelheim, Chugai Pharmaceutical, Eli Lilly Japan and Pfizer Japan outside this study. H.H. received research grants from AstraZeneca, Astellas Pharma, MSD, Ono Pharmaceutical, Nippon Boehringer Ingelheim, Novartis Pharma, Pfizer Japan, Bristol-Myers Squibb, Eli Lilly Japan, Chugai Pharmaceutical, Daiichi Sankyo, Merck Serono, Merck Biopharma, Takeda Pharmaceutical, Taiho Pharmaceutical, SymBio Pharmaceuticals, AbbVie, inVentiv Health Japan, ICON Japan, Gritstone Oncology, Parexel International, Kissei Pharmaceutical, EPS, Syneos Health, Pfizer R&D Japan, A2 Healthcare, Quintiles/IQVIA Services Japan, EP-CRSU, Linical, Eisai, CMIC Shift Zero, Kyowa Hakko Kirin, Bayer Yakuhin, EPS International and Otsuka Pharmaceutical; honoraria from Amgen, AstraZeneca, Boehringer Ingelheim Japan, Bristol-Myers Squibb, Chugai Pharmaceutical, Daiichi Sankyo, Eli Lilly Japan, Janssen Pharmaceutical, Kyorin Pharmaceutical, Merck Biopharma, MSD, Novartis Pharmaceuticals, Ono Pharmaceutical, Taiho Pharmaceutical and Takeda Pharmaceutical; consulting fees from AstraZeneca, Boehringer Ingelheim Japan, Bristol-Myers Squibb, Chugai Pharmaceutical, Eli Lilly Japan, Guardant Health, Pfizer Japan, Shanghai Haihe Biopharma, Takeda Pharmaceutical and Merck Biopharma outside this study. Y. Togashi received research grants from KOTAI Biotechnologies, Daiichi-Sankyo, Ono Pharmaceutical, Bristol-Myers Squibb and KORTUC, and honoraria from Ono Pharmaceutical, Bristol-Myers Squibb, AstraZeneca, Chugai Pharmaceutical and MSD outside this study. All other authors declare that they have no competing financial interests.

Figures

Fig. 1
Fig. 1. TILs and cancer cells share mtDNA-mutated mitochondria.
a, Integrative Genomics Viewer (IGV) track data of the entire mtDNA from paired TILs and cancer cells from the same patient (02 and 04). A lymphoblastoid cell line (LCL) established from PBLs from the same patient (through Epstein–Barr virus transformation) was used as germline controls. b, Representative gating strategy for bulk TIL analyses. c, Capillary sequencing chromatograms of mtDNA from patient 04. mtDNA from sorted pure CD45+CD3+ T cells from bulk TIL04 cells, MEL04 cells and PBL04 cells were sequenced. d, Left, representative transmission electronic microscopy images of bulk TIL04, TIL04#9, MEL04 and PBL04 cells from patient 04. Right, the number of cristae per mitochondrion (n = 20 per mitochondrion) were counted and quantified. Scale bars, 2 μm. e, IGV track data of the entire mtDNA of FFPE tumour tissue from patient 04. For a and e, next-generation sequencing was used for analyses. P  values (shown on the chart) were calculated using one-way analysis of variance (ANOVA) with Bonferroni correction (d). Error bars show s.e.m. AF, allele frequency; NS, not significant. Source Data
Fig. 2
Fig. 2. mtDNA-mutated mitochondria from cancer cells transfer to TILs and are progressively replaced to homoplasmy in TILs.
a, Representative confocal microscopy images of mitochondrial transfer from three independent experiments. TIL04#9 cells labelled with MitoTracker Green were cocultured with MEL04-MitoDsRed cells for 2 days. Scale bars, 10 μm. b, Representative flow cytometry staining analysis of mitochondrial transfer from four independent experiments. TIL04#9 cells were cocultured with MEL04-MitoDsRed cells for 14 days and were subsequently analysed. c, Quantification of mitochondria from TILs transferred from MEL04 cells. TILs were cocultured with MEL04-MitoDsRed cells for 2 days with or without an anti-major histocompatibility class I (MHC-I) monoclonal antibody, a TNT inhibitor (cytochalasin B), insertion columns (3 or 0.4 µm), a small EV release inhibitor (GW4869) and/or a microEV inhibitor (Y-27632), and were subsequently analysed by flow cytometry. Summary of fold changes of ΔDsRed mean fluorescence intensity (MFI) (DsRed MFI of TILs with coculture – that without coculture) relative to the controls is shown (n = 4 per group). d, Capillary sequencing chromatograms of mtDNA in TIL04#9 cells cocultured with MEL04 cells. After single-cell sorting, mtDNA was sequenced. e,f, Time-lapse imaging. TIL04#9 cells labelled with MitoTracker Green were cocultured with MEL04-MitoDsRed cells. We captured images every 30 min using a digital holographic microscope. Representative merged fluorescence (top) and three-dimensional refractive index (RI) images (bottom) in TILs are shown from three independent experiments. Scale bars, 4 μm. g, Representative gating strategy for mouse TIL analyses. The tumours were digested, stained with CD45 and CD3 and were analysed. h,i, Frequency of DsRed+ T cells (h) and mtDNA sequencing in TILs (i) from LLC/A11-MitoDsRed tumours. In vivo experiments were performed as described in Supplementary Fig. 3. Representative flow cytometry staining (h, left), quantification (h, right, n = 4 per group) and capillary sequencing chromatograms for DsRed cells (i, left) and DsRed+ T cells (i, right) are shown. P values (shown on charts) were calculated using one-way ANOVA with Bonferroni corrections (c,h). Error bars show s.e.m. Source Data
Fig. 3
Fig. 3. Mitochondria from cancer cells are resistant to mitophagy because of USP30.
a,b, Quantification of mitochondria in TILs. TIL04#9 cells labelled with MitoTracker Green were cocultured with MEL04 cells for 3 days (a, without NAC; b, with NAC) and were subsequently analysed. Representative flow cytometry staining (left) and quantification (right) are shown (n = 4 per group). c, Capillary sequencing chromatograms of mtDNA in TIL04#9 cells cocultured with MEL04 cells with or without NAC at day 14. After single-cell sorting, mtDNA was sequenced. d,e, LC3B staining. TIL04#9 cells labelled with MitoTracker Green were cocultured with MEL04-MitoDsRed cells for 3 days and were subsequently stained and analysed. Representative confocal microscopy images (d) and quantification (e) are shown (n = 4 per group). Scale bars, 2 μm. FCCP, carbonyl cyanide 4-(trifluoromethoxy)phenylhydrazone. f, BNIP3 and ATF4 expression. TIL04#9 cells were cocultured with MEL04-MitoDsRed cells for 14 days and sorted TILs were analysed by real-time PCR. Quantification of fold change values to the controls are shown (n = 3 per group). g, Quantification of mitochondria in TIL04#9 cells treated with a mitophagy inhibitor. Coculture was performed as described in a with or without bafilomycin A1 and TILs were subsequently analysed. Quantification is shown (n = 4 per group). h,i, USP30 staining. TIL04#9 cells labelled with MitoTracker Green were cocultured with MEL04-MitoDsRed cells for 3 days and were subsequently stained and analysed. Representative confocal microscopy images (h) and quantification (i) are shown (n = 4 per group). Scale bars, 2 μm. j, Quantification of mitochondrial transfer in TILs treated with a USP30 inhibitor or siRNAs. TIL04#9 cells were cocultured with MEL04-MitoDsRed cells for 3 days with or without CMPD-39 or siRNAs and were subsequently analysed. Quantification is shown (n = 4 per group). k, Capillary sequencing chromatograms of mtDNA in TIL04#9 cells cocultured with MEL04 cells with or without CMPD-39 or siRNAs at day 14. After single-cell sorting, mtDNA was sequenced. P values (shown on charts) were calculated using two-sided t-tests (a,b,i) or one-way ANOVA with Bonferroni corrections (eg,j). Error bars show s.e.m. Source Data
Fig. 4
Fig. 4. TIL function is impaired by mtDNA-mutated mitochondrial transfer.
a, Capillary sequencing chromatograms of mtDNA in DsRed TIL04#9 cells and DsRed+ TIL04#9 cells. We established DsRedTIL04#9/02 (wild type), DsRed+TIL04#9/02 (wild type), DsRedTIL04#9/04 (wild type), DsRed+TIL04#9/04 (mutated), DsRedTIL04#9/MCF7 (wild type), DsRed+TIL04#9/MCF7 (wild type), DsRedTIL04#9/MDA (wild type) and DsRed+TIL04#9/MDA cells (mutated), as described in Supplementary Fig. 4. bp, The following parameters were analysed in TILs established in a: membrane potentials, evaluated using MitoTracker Deep Red and Green (b); cellular ROS production, evaluated using DCFDA (c); β-galactosidase activity (d); p16 (e) and p53 (f) expression; CD27CD28 senescent fraction (g); IL6 (h), CXCL8 (i) and IL1B (j) expression; rapidly dividing cells, evaluated by CFSE dilution (k); apoptosis, evaluated using Annexin V (l); frequencies of CCR7highCD45RAlow central memory (m) and KLRG1low long-lived (n) fractions; and PD-1 (o) and CD69 (p) expression. To analyse cell division, PD-1 and CD69 expression, TILs were stimulated with anti-CD3 and anti-CD28 monoclonal antibodies. Rapidly dividing cells were counted after the third division on day 3. Quantifications are shown (n = 4 per group). P values (shown on charts) were calculated using one-way ANOVA with Bonferroni corrections (bp).  Error bars show s.e.m. Source Data
Fig. 5
Fig. 5. mtDNA-mutated mitochondrial transfer reduces antitumour immunity in vivo.
a, Comparison of mitochondrial transfer rates. In vivo experiments were performed as described in Supplementary Fig. 3. Representative flow cytometry staining (left) and quantification (right) are shown (n = 6 per group). bf, β-Galactosidase activity (b), apoptosis evaluated by Annexin V (c), frequency of CD127highKLRG1low MPECs (d), PD-1 expression (e) in CD8+ TILs, and frequency of TIM3+TCF1 terminally differentiated exhausted CD8+ T cells in PD-1+CD8+ TILs (f) from LLC/P29-MitoDsRed or LLC/A11-MitoDsRed tumours. In vivo experiments were performed as described in Supplementary Fig. 3. Quantifications are shown (n = 6 per group). g, Killing assays. LLC/P29-MitoDsRed or LLC/A11-MitoDsRed cells were subcutaneously injected into OT-1 mice. Forty-two days later, we sorted DsRed and DsRed+CD8+ T cells from each TIL fraction (effector cells (E)), with which we performed a killing assay against LLC/P29-OVA or LLC/A11-OVA cells (target cells (T)), respectively. Quantifications are shown (n = 4 per group). h, Tumour growth of LLC/P29-MitoDsRed and LLC/A11-MitoDsRed tumours treated with an anti-PD-1 antibody and/or an EV release inhibitor (GW4869). In vivo experiments were performed as described in Supplementary Fig. 3 (n = 6 per group). i, Mitochondrial transfer after GW4869 local injection. In vivo experiments were performed as described in Supplementary Fig. 3. Representative flow cytometry staining (left) and summary (right) are shown (n = 4 per group). jn, β-Galactosidase activity (j), apoptosis evaluated by Annexin V (k), frequency of CD127highKLRG1low MPECs (l), PD-1 expression (m) in CD8+ TILs, and frequency of TIM3+TCF1 terminally differentiated exhausted CD8+ T cells in PD-1+CD8+ TILs (n) from LLC/P29-MitoDsRed and LLC/A11-MitoDsRed tumours treated with GW4869. In vivo experiments were performed as described in Supplementary Fig. 3. Quantifications are shown (n = 4 per group). P values (shown on charts) were calculated using two-sided t-tests (a,i), one-way ANOVA with Bonferroni corrections (bg,jn) or two-way ANOVA with Bonferroni corrections (h). Error bars show s.e.m. Source Data
Extended Data Fig. 1
Extended Data Fig. 1. Additional mtDNA sequencing, mitochondrial transfer, and EV-detection data.
a, mtDNA sequencing in patients #02 and #04. mtDNA of bulk TILs, sorted CD45+CD3+ T cells from bulk TILs, and PBLs were sequenced. Representative capillary sequencing chromatograms in patients #2 (left) and #04 (right) are shown. b, IGV of TILs and cancer cells. We sequenced the whole mtDNA of paired TILs and cancer cells from the same melanoma patient (#c03) using a next-generation sequencing. PBLs from the same patients were used as germline controls. Track IGV data in patients #c03 are shown. c, mtDNA sequencing in patients #c03 and #c04. Paired TILs, cancer cells, and PBLs from the same patient were sequenced. Representative capillary sequencing chromatograms in patients #c03 (left) and #c04 (right) are shown. d, mtDNA sequencing of TIL04_#9 cells. A single clones established from TIL04 cells (#9) were sequenced. Representative capillary sequencing chromatogram is shown. e, Transmission electronic microscope images in patients #02 and c03. The sections of TIL02 (wild-type), MEL02 (wild-type), PBL02 (wild-type), TILc03 (mutated), MELc03 (mutated), and PBLc03 (wild-type) cells were observed using transmission electron microscopy. Representative images are shown. Scale bar, 2 μm. f, Mitochondrial quantification of TILs transferred from paired cancer cells. TIL02 or TIL04 cells were cocultured with MEL02-MitoDsRed or MEL04-MitoDsRed cells, respectively for 1, 2, 3, or 14 days and then DsRed expression in TILs were analysed using flow cytometry. MFI summary is shown (n = 4 per group). g, Mitochondrial quantification of TILs transferred from MEL02 cells under various conditions. Coculture experiments and analyses were performed as described in Fig. 2c. Summary of fold changes of ΔDsRed MFI (DsRed MFI of TILs with coculture – that without coculture) relative to the control conditions (TIL02 and MEL02-MitoDsRed coculture without any drugs or columns) is shown (n = 4 per group). h, Mitochondrial quantification of TIL04 or TIL02 cells transferred from MEL04 or MEL02 cells under various conditions. Coculture experiments and analyses were performed as described in Fig. 2c. Summaries of fold changes of ΔDsRed MFI (DsRed MFI of TILs with coculture – that without coculture) relative to the control conditions (TIL and MEL-MitoDsRed coculture without any drugs or columns) (top, TIL04 from MEL04; bottom, TIL02 from MEL02) are shown (n = 4 per group). i, Western blotting for EV-related molecules from three independent experiments. Extracted and purified EVs were used for western blotting experiments following the MISEV2018 guideline. Briefly, culture mediums or EV lysates were subjected to immunoblot analysis with antibodies. We used CD9 (category 1) and TSG101 (category 2) as EV markers. To evaluate purity of FBS containing medium-derived EVs, we checked BSA like category 3. In addition, we evaluated cytochrome as a mitochondrial protein (category 4). For gel source data, see Supplementary Fig. 1. One-way ANOVA with Bonferroni correction were used in (f)-(h). Source Data
Extended Data Fig. 2
Extended Data Fig. 2. Additional homoplasmy replacement data.
a and b, DsRed expression and mtDNA mutations in sorted T cells from mouse TILs in vitro. We sorted mitochondria-transferred DsRed+ T cells from LLC/A11-MitoDsRed tumours as described in Supplementary Fig. 3, which were subsequently cultured further in vitro for 7 days. We analysed DsRed expression and mtDNA in bulk T cells at each time point and summary of DsRed expression (a) and representative capillary sequencing chromatograms (b) are shown. c, Mitochondrial quantification of LLC/A11 cells transferred from mouse T cells. OVA-overexpressing LLC/A11 cells were cocultured with or without CD8+ T cells from PhaMexcisedOT-1 mice for 3 days. Then, Dendra2 (green) expression in OVA-overexpressing LLC/A11 cells were analysed using flow cytometry. MFI summary is shown (n = 4 per group). d and e, Original mitochondrial quantification of LLC/A11 (d) and MEL04 (e) cells after coculture with mouse T cells and TIL04_#9 cells, respectively. MitoTracker Green-labelled OVA-overexpressing LLC/A11 or MEL04 cells were cocultured with or without CD8+ T cells from OT-1 mice or TIL04_#9 cells for 3 days, respectively. Then, OVA-overexpressing LLC/A11 or MEL04 cells were subsequently analysed using flow cytometry. Representative flow cytometric staining (e, left) and MFI summaries (d and e, right) are shown (n = 4 per group). f, ROS in EVs. After staining with DCFDA, EVs were extracted and purified from the supernatants, from which EV-conjugated beads were created. The beads were analysed using flow cytometry. EV-free medium without any cells was used as a negative control. Representative flow cytometric staining is shown. g, Mitochondrial quantification of TIL04_#9 cells transferred from MEL04 cells with NAC. TIL04_#9 cells were cocultured with MEL04-MitoDsRed cells and/or NAC for 3 days and then DsRed expression in TILs were analysed using flow cytometry. MFI summary is shown (n = 4 per group). h, Gene expression of USP30, USP33, and USP35 from TCGA datasets in patients with melanoma. i, USP30 expression. Cells were stained with AF546-conjugated anti-USP30 mAb and analysed using a confocal laser microscope or flow cytometry. Representative confocal microscopic images (left) and MFI summary (right) are shown (n = 4 per group). Scale bar, 10 µm. j-m, Membrane potential evaluated by MitoTracker Deep Red and Green (j), cellular ROS production evaluated by DCFDA (k), β-galactosidase activity (l), and PD-1 expression (m) in TILs treated with a USP30 inhibitor (CMPD-39) or siRNAs for USP30. TIL04_#9 cells were cocultured with MEL04 cells with or without CMPD-39 or siRNA transfection for 14 days and then analysed using flow cytometry. To analyse PD-1 expression, TILs were stimulated with anti-CD3 and anti-CD28 mAbs. Summaries are shown (n = 4 per group). Two-sided t-tests were used in (c)-(e), and (g) and one-way ANOVA with Bonferroni correction were used in (a) and (i)-(m). Source Data
Extended Data Fig. 3
Extended Data Fig. 3. Additional in vitro cell line and PBL data.
a-c, Western blotting for mitochondrial proteins from three independent experiments (human cell lines, a and b; mouse cell lines, c). Cell lysates were subjected to immunoblot analysis with antibodies to mitochondrial proteins (ND4, ND5, ND6, ND1, CYTB, COX1, and ATP6). MEL04 cells were treated with taurine before extraction in b. β-actin was used as a loading control. For gel source data, see Supplementary Fig. 1. d-f, Metabolic evaluation using a flux analyser. The oxygen consumption rate (OCR; d) and extracellular acidification rate (ECAR; e) were measured under basal conditions, and the bioenergetic profile captured the major ATP-producing pathways of each cell line by calculating the ATP production rate (f). Summaries are shown (n = 4 per group). g-i, Electron transport chain activity assays. We used activity buffer with the isolated mitochondrial protein in place of the supplied mitochondria in the MitoCheck Activity Assay Kits, following the manufacturer’s instructions. Reactions were conducted at 25 °C using a microplate reader with readings taken every 30 s for 15 min and the absorbance changes from the base line were evaluated. Summaries of fold changes to wild-type cells (g, complex I; h, II + III; i, IV) are shown (n = 4 per group). j and k, Frequencies of CCR7hiCD45RAlo central memory (j) and KLRG1lo long-lived (k) fractions in PBLs. Sorted CCR7hiCD45RAhiCD8+ naïve T cells from PBLs of healthy donors were cocultured with MEL02-MitoDsRed or MEL04-MitoDsRed cells for 7 days while being stimulated with anti-CD3 mAb in the presence of IL-7, IL-15, and IL-2. Subsequently, PBLs were analysed using flow cytometry. Summaries are shown (n = 4 per group). l, Apoptosis evaluated by Annexin V in each T cell fraction. Each CD8+ T cell fraction (naïve, CCR7hiCD45RAhi; central memory [CM], CCR7hiCD45RAlo; effector memory [EM], CCR7loCD45RAlo; terminally differentiated effector memory [TEMRA], CCR7loCD45RAhi) sorted from PBLs of healthy donors was cocultured with MEL02-MitoDsRed or MEL04-MitoDsRed cells for 4 days, and apoptosis in DsRed+CD8+ T cells was analysed using flow cytometry. Summary is shown (n = 4 per group). Two-sided t-tests were used in (d)-(i) and (l) and one-way ANOVA with Bonferroni correction were used in (j)-(k). Source Data
Extended Data Fig. 4
Extended Data Fig. 4. Additional in vitro mitochondria transferred TIL data.
We established DsRedTIL04#9/MCF7 (wild-type), DsRed+TIL04#9/MCF7 (wild-type), DsRedTIL04#9/MDA (wild-type), DsRed+TIL04#9/MDA (mutated), DsRedTILc03#5/02 (wild-type), DsRed+TILc03#5/02 (wild-type), DsRedTILc03#5/c03 (wild-type), DsRed+TILc03#5/c03 cells (mutated), as described in Supplementary Fig. 4. a-l, Membrane potential evaluated by MitoTracker Deep Red and Green (a), cellular ROS production evaluated by DCFDA (b), β-galactosidase activity (c), p16 (d) and p53 (e) expression, frequency of CD27CD28 senescent fraction (f), rapidly dividing cells evaluated by CFSE dilution (g), apoptosis evaluated by Annexin V (h), frequencies of CCR7hiCD45RAlo central memory (i) and KLRG1lo long-lived (j) fractions, and PD-1 (k) and CD69 (l) expression in TIL04_#9 cells. To analyse cell division, PD-1, and CD69 expression, TILs were stimulated with anti-CD3 and anti-CD28 mAbs. Rapidly dividing cells were counted after the third division on day 3. TILs were analysed using flow cytometry, and summaries are shown (n = 4 per group). m-p, Cellular ROS production evaluated by DCFDA (m), β-galactosidase activity (n), apoptosis evaluated by Annexin V (o), and PD-1 expression (p) in TILc03_#5 cells. To analyse PD-1 expression, TILs were stimulated with anti-CD3 and anti-CD28 mAbs. TILs were analysed using flow cytometry, and summaries are shown (n = 4 per group). One-way ANOVA with Bonferroni correction were used in (a)-(p). Source Data
Extended Data Fig. 5
Extended Data Fig. 5. In vitro mitochondria-transferred Jurkat cell data using a MitoCeption protocol.
We established mtDNA-deficient Jurkat/Rho0, Rho+MEL02-Mito (wild-type), Rho+MEL04-Mito (mutated), Rho+MCF7-Mito (wild-type), and Rho+MDA-Mito cells (mutated), as described in Supplementary Fig. 4. a, mtDNA amounts and the quantification in Jurkat cells. DNA from parental Jurkat, Jurkat/Rho0, Rho+MEL02-Mito, Rho+MEL04-Mito, Rho+MCF7-Mito, and Rho+MDA-Mito cells were extracted and amplified by PCR using primers specific for the D-loop region and ND5. LINE1 was used as an internal control for nuclear DNA. The quantification was performed by real-time PCR and the fold changes to parental Jurkat cells were calculated. The representative PCR bands (left) and summary of the fold changes (right) are shown (n = 4 per group). For gel source data, see Supplementary Fig. 1. b, mtDNA sequencing of the established Jurkat cells. Representative capillary sequencing chromatograms are shown. c, Membrane potential of Jurkat cells. The Jurkat cells were analysed using flow cytometry with TMRE, and MFI summary is shown (n = 4 per group). d-f, Metabolic evaluation of the established Jurkat cells using a flux analyser. The oxygen consumption rate (OCR; d) and extracellular acidification rate (ECAR; e) were measured under basal conditions, and the bioenergetic profile captured the major ATP-producing pathways of each Jurkat cell line by calculating the ATP production rate (f). Summaries are shown (n = 4 per group). g-m, Cellular ROS production evaluated by DCFDA (g), β-galactosidase activity (h), rapidly dividing cells evaluated by CFSE dilution (i), apoptosis evaluated by Annexin V (j), frequencies of CCR7hiCD45RAlo central memory (k) and KLRG1lo long-lived (l) fractions, and PD-1 expression (m) in the established Jurkat cells. To analyse cell division and PD-1 expression, Jurkat cells were stimulated with anti-CD3 and anti-CD28 mAbs. Rapidly dividing cells were counted after the third division on day 3. The Jurkat cells were analysed using flow cytometry, and summaries are shown (n = 4 per group). n, mtDNA amounts in the Rho+ cells during the culture. Rho+MEL02-Mito and Rho+MEL04-Mito cells were cultured in normal medium without sodium pyruvate and uridine. DNA from the cells was extracted at each time point and amplified by PCR using primers specific for the D-loop region and ND5. LINE1 was used as an internal control for nuclear DNA. The representative PCR bands are shown. For gel source data, see Supplementary Fig. 1. Two-sided t-tests were used in (a) and (c)-(m) for statistical analyses. Source Data
Extended Data Fig. 6
Extended Data Fig. 6. In vitro mitochondria-transferred Jurkat cell data using an EV protocol.
We established mtDNA-deficient Jurkat/Rho0, Rho+MEL02-EV (wild-type), and Rho+MEL04-EV cells (mutated), as described in Supplementary Fig. 4. a, mtDNA amounts and the quantification in Jurkat cells. DNA from parental Jurkat, mtDNA-deficient Jurkat/Rho0, Rho+MEL02-EV, and Rho+MEL04-EV cells was extracted and amplified by PCR using primers specific for the D-loop region and ND5. LINE1 was used as an internal control for nuclear DNA. The quantification was performed by real-time PCR and the fold changes to parental Jurkat cells were calculated. The representative PCR bands (left) and summary of the fold changes (right) are shown (n = 4 per group). b, mtDNA sequencing of Jurkat cells. The mtDNA of Rho+MEL02-EV and Rho+MEL04-EV cells was sequenced. Representative capillary sequencing chromatograms are shown. c, Membrane potential of Jurkat cells. Rho+MEL02-EV and Rho+MEL04-EV cells were analysed using flow cytometry with TMRE. MFI summary is shown (n = 4 per group). d-f, Metabolic evaluation of Jurkat cells using a flux analyser. The OCR (d) and ECAR (e) were measured under basal conditions, and the bioenergetic profile captured the major ATP-producing pathways of Jurkat cells by calculating the ATP production rate (f). Summaries are shown (n = 4 per group). g-m, Cellular ROS production evaluated by DCFDA (g), β-galactosidase activity (h), rapidly dividing cells evaluated by CFSE dilution (i), apoptosis evaluated by Annexin V (j), frequencies of CCR7hiCD45RAlo central memory (k) and KLRG1lo long-lived (l) fractions, and PD-1 expression (m) in Jurkat cells. To analyse cell division and PD-1 expression, the Jurkat cells were stimulated with anti-CD3 and anti-CD28 mAbs. Rapidly dividing cells were counted after the third division on day 3. The Jurkat cells were analysed using flow cytometry, and summaries are shown (n = 4 per group). Two-sided t-tests were used in (a) and (c)-(m). Source Data
Extended Data Fig. 7
Extended Data Fig. 7. Additional in vivo mouse transfer data.
a, CD8+ T cell infiltration. In vivo experiments were performed as described in Supplementary Fig. 3. Summary of CD8+ T cell counts per weight is shown (n = 6 per group). b, mtDNA sequencing in TILs. In vivo experiments were performed as described in Supplementary Fig. 3. Representative capillary sequencing chromatograms for DsRed (left, blue frame) or DsRed+ T cells (right, red frame) are shown. c, Tumour growth (left, LLC/P29; right, LLC/A11) in CD8+ T-cell depleted mice. In vivo experiments were performed as described in Supplementary Fig. 3, and anti-CD8β mAb was administered intraperitoneally 1 day before tumour cell inoculation and then injected every 7 days (n = 6 per group). d, In vitro cellular proliferation. Cellular proliferation was evaluated every 6 h for 48 h. The ratios to the base line are shown (n = 4 per group). e and f, Frequency of CD127hiKLRG1lo MPECs (e) and PD-1 expression (f) in sorted T cells from mouse TILs in vitro. We sorted mitochondria-transferred DsRed+ T cells from LLC/P29-MitoDsRed or LLC/A11-MitoDsRed tumours, which were subsequently cultured further in vitro for 7 days. To analyse PD-1 expression, T cells were stimulated with anti-CD3 and anti-CD28 mAbs. Sorted bulk CD8+ T cells were analysed using flow cytometry and summaries are shown (n = 6 per group). g, Tumour growth in B6 SCID mice treated with an EV release inhibitor (GW4869). In vivo experiments were performed as described in Supplementary Fig. 3 (n = 6 per group). h, DsRed expression in adoptive transferred tumour-infiltrating CD8+ T cells. In vivo experiments were performed as described in Supplementary Fig. 3. Summary is shown (n = 4 per group). i, PD-1 expression in adoptive transferred CD8+ TILs from LLC/P29-OVA-MitoDsRed or LLC/A11-OVA-MitoDsRed tumours according to DsRed expression. In vivo experiments were performed as described in Supplementary Fig. 3 using OT-1 mice. Summaries are shown (n = 4 per group). j, Frequency of TIM3+TCF1 terminally differentiated exhausted CD8+ T cells in adoptive transferred PD-1+CD8+ TILs from LLC/P29-OVA-MitoDsRed or LLC/A11-OVA-MitoDsRed tumours according to DsRed expression. In vivo experiments were performed as described in Supplementary Fig. 3 using OT-1 mice. Summary is shown (n = 4 per group). k, Tumour growth (left, LLC/P29; right, LLC/A11) in the adoptive T-cell transfer models. In vivo experiments were performed as described in Supplementary Fig. 3 using OT-1 mice. Source Data
Extended Data Fig. 8
Extended Data Fig. 8. In vivo mouse mitochondrial dysfunction data.
a, Mitochondrial mass. MitoTracker Green-labelled T cells from splenocytes in Tfamfl/fl and Tfamfl/flCd4cre mice were analysed using flow cytometry. Summary of fold changes to Tfamfl/fl mice is shown (n = 4 per group). b and c, Metabolic evaluation. T cells from splenocytes in Tfamfl/fl and Tfamfl/flCd4cre mice were analysed using a flux analyser. The OCR (b) and ECAR (c) were measured under basal conditions. The OCR trace (b, left) and summaries (b, right; c) are shown (n = 4 per group). d, β-galactosidase activity. T cells from splenocytes in Tfamfl/fl and Tfamfl/flCd4cre mice were analysed using flow cytometry. MFI summary is shown (n = 4 per group). e, MC-38 (left) or B16-OVA (right) tumour growth treated with anti-PD-1 or control mAb in Tfamfl/fl or Tfamfl/flCd4cre mice. In vivo experiments were performed as described in Supplementary Fig. 3 (MC-38, n = 6 per group; B16-OVA, 4 per group). f-h, Frequencies of CD44hiCD62LloCD8+ effector memory T cells (f), PD-1+CD8+ T cells (g), and granzyme B (GZMB)-producing CD8+ T cells (h) in TILs. In vivo experiments were performed as described in Supplementary Fig. 3. Summaries are shown (n = 6 per group). i, Rechallenged tumour growth. In vivo experiments were performed as described in Supplementary Fig. 3. Each tumour volume (MC-38, top; B16-OVA, bottom) is shown. j and k, Frequencies of CD27CD28CD8+ senescent T cells (j) and CD127hiKLRG-1loCD8+ MPECs (k) in TILs. In vivo experiments were performed as described in Supplementary Fig. 3. Summaries are shown (n = 6 per group). Source Data
Extended Data Fig. 9
Extended Data Fig. 9. mtDNA mutations in tumour tissues impaired efficacy of PD-1 blockade.
a-c, The proportion of total 158 mtDNA variants (a), number and type of mtDNA variants (b), and 110 mtDNA variant spectra for substitutions on the light (L) or heavy (H) strand (c) in cohorts B and C1/2. Whole mtDNA sequencing for FFPE tumour tissues was conducted with a next-generation sequencing. d and e, Survival curves of patients who received PD-1 blockade therapy (d, melanoma, 95; NSCLC, 86) and those with NSCLC who received platinum-doublet chemotherapies without any ICIs as first-line therapy (n = 56) according to mtDNA status. mtDNA mutations were defined as truncating and missense, and tRNA/rRNA variants. PFS (left) and OS (right) were defined as the time intervals from the initiation of treatment until the first observation of disease progression or death from any cause, and until death from any cause, respectively. Survival curves were analysed using the Kaplan-Meier method and compared among groups using the two-sided log-rank test in (d) and (e). Source Data

References

    1. Schreiber, R. D., Old, L. J. & Smyth, M. J. Cancer immunoediting: integrating immunity’s roles in cancer suppression and promotion. Science331, 1565–1570 (2011). - PubMed
    1. DePeaux, K. & Delgoffe, G. M. Metabolic barriers to cancer immunotherapy. Nat. Rev. Immunol.21, 785–797 (2021). - PMC - PubMed
    1. Scharping, N. E. et al. The tumor microenvironment represses T cell mitochondrial biogenesis to drive intratumoral T cell metabolic insufficiency and dysfunction. Immunity45, 374–388 (2016). - PMC - PubMed
    1. Yu, Y. R. et al. Disturbed mitochondrial dynamics in CD8. Nat. Immunol.21, 1540–1551 (2020). - PubMed
    1. Topalian, S. L. et al. Safety, activity, and immune correlates of anti-PD-1 antibody in cancer. N. Engl. J. Med.366, 2443–2454 (2012). - PMC - PubMed

MeSH terms

Substances

LinkOut - more resources