. 2025 Feb;638(8051):760-768.
doi: 10.1038/s41586-024-08440-7. Epub 2025 Jan 22.

RELMβ sets the threshold for microbiome-dependent oral tolerance

Affiliations

RELMβ sets the threshold for microbiome-dependent oral tolerance

Emmanuel Stephen-Victor et al. Nature. 2025 Feb.

Abstract

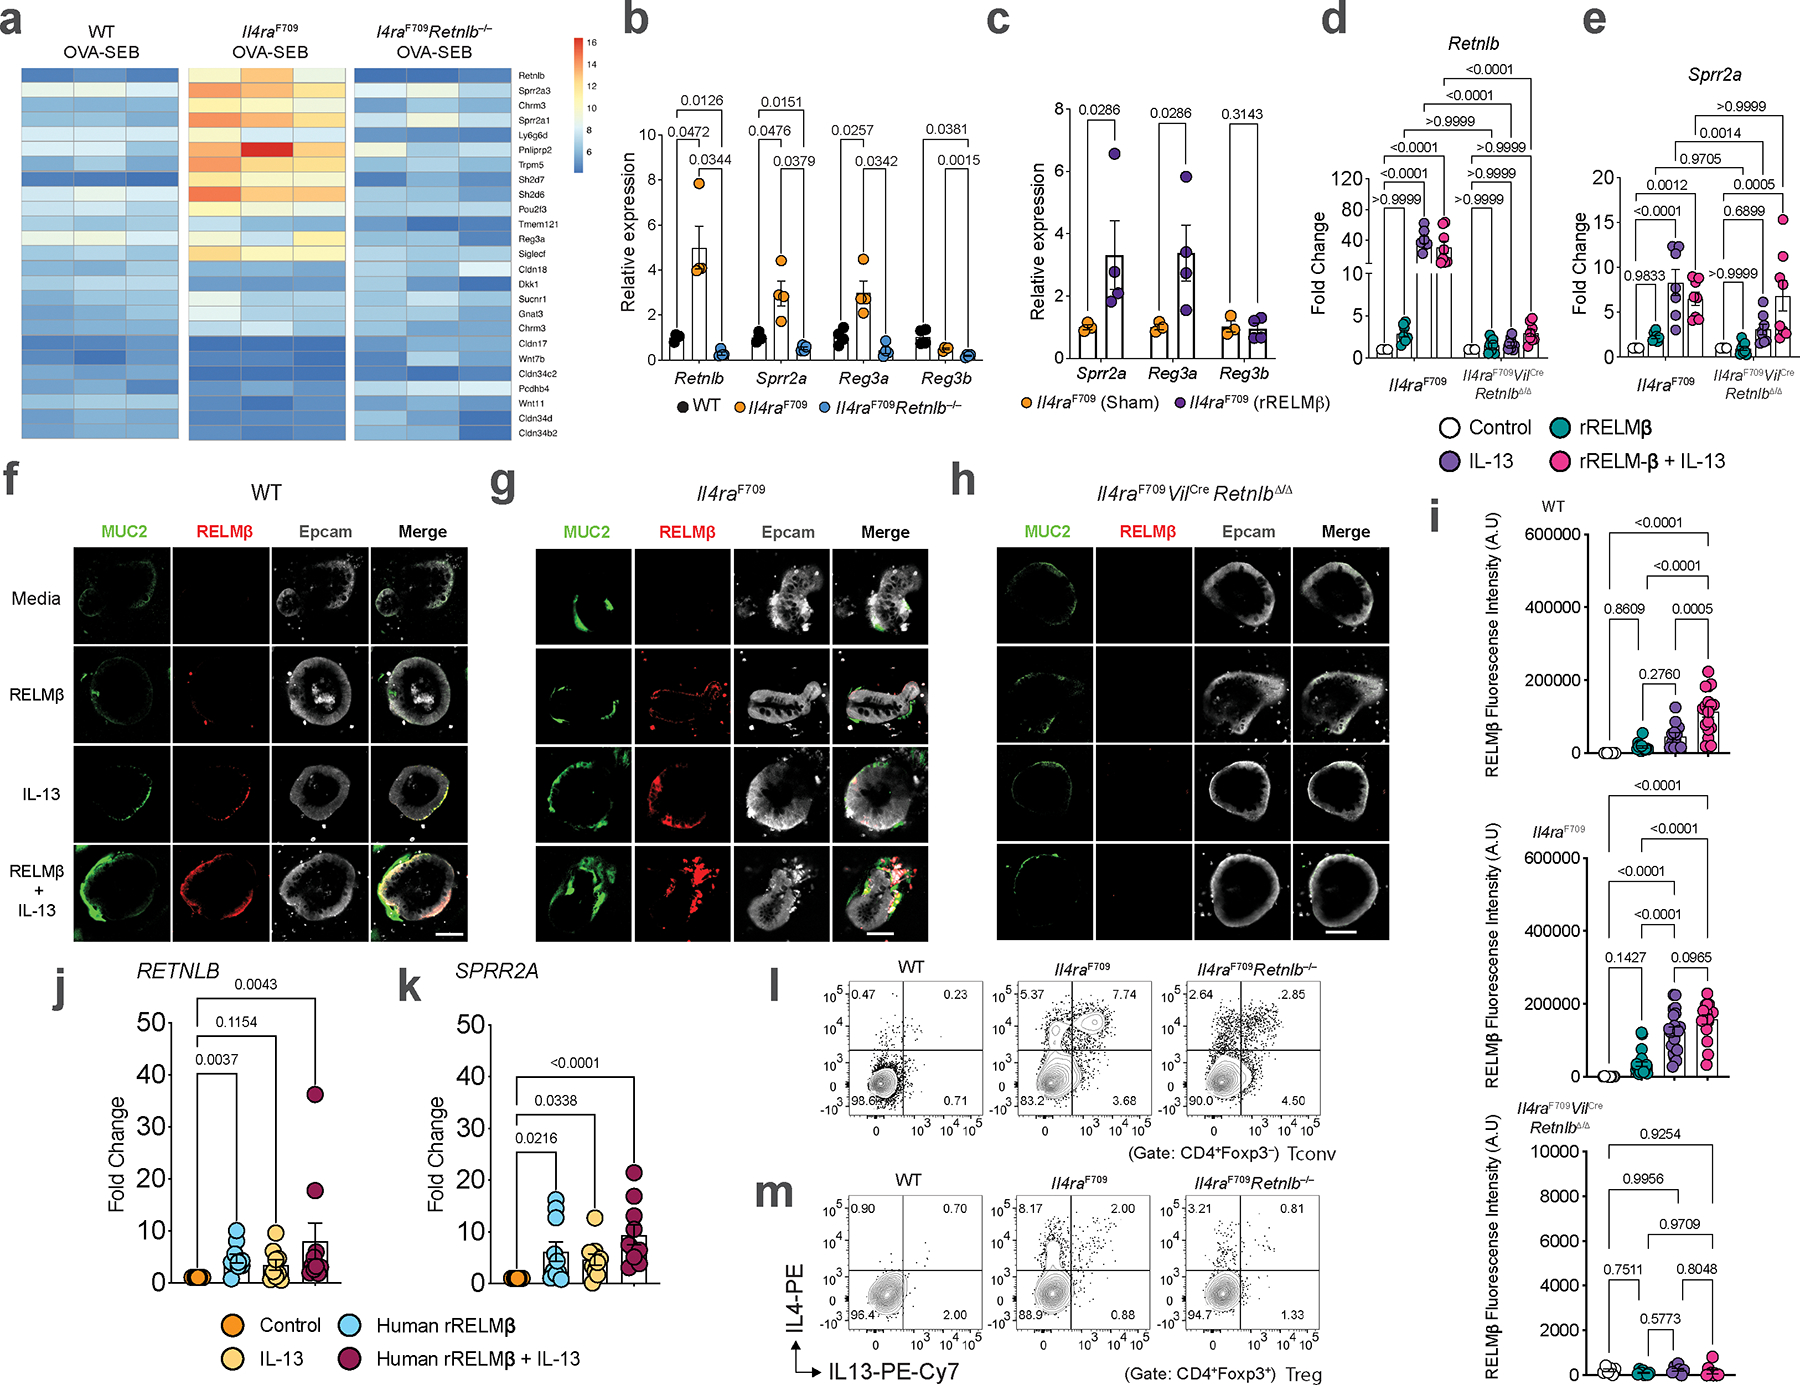
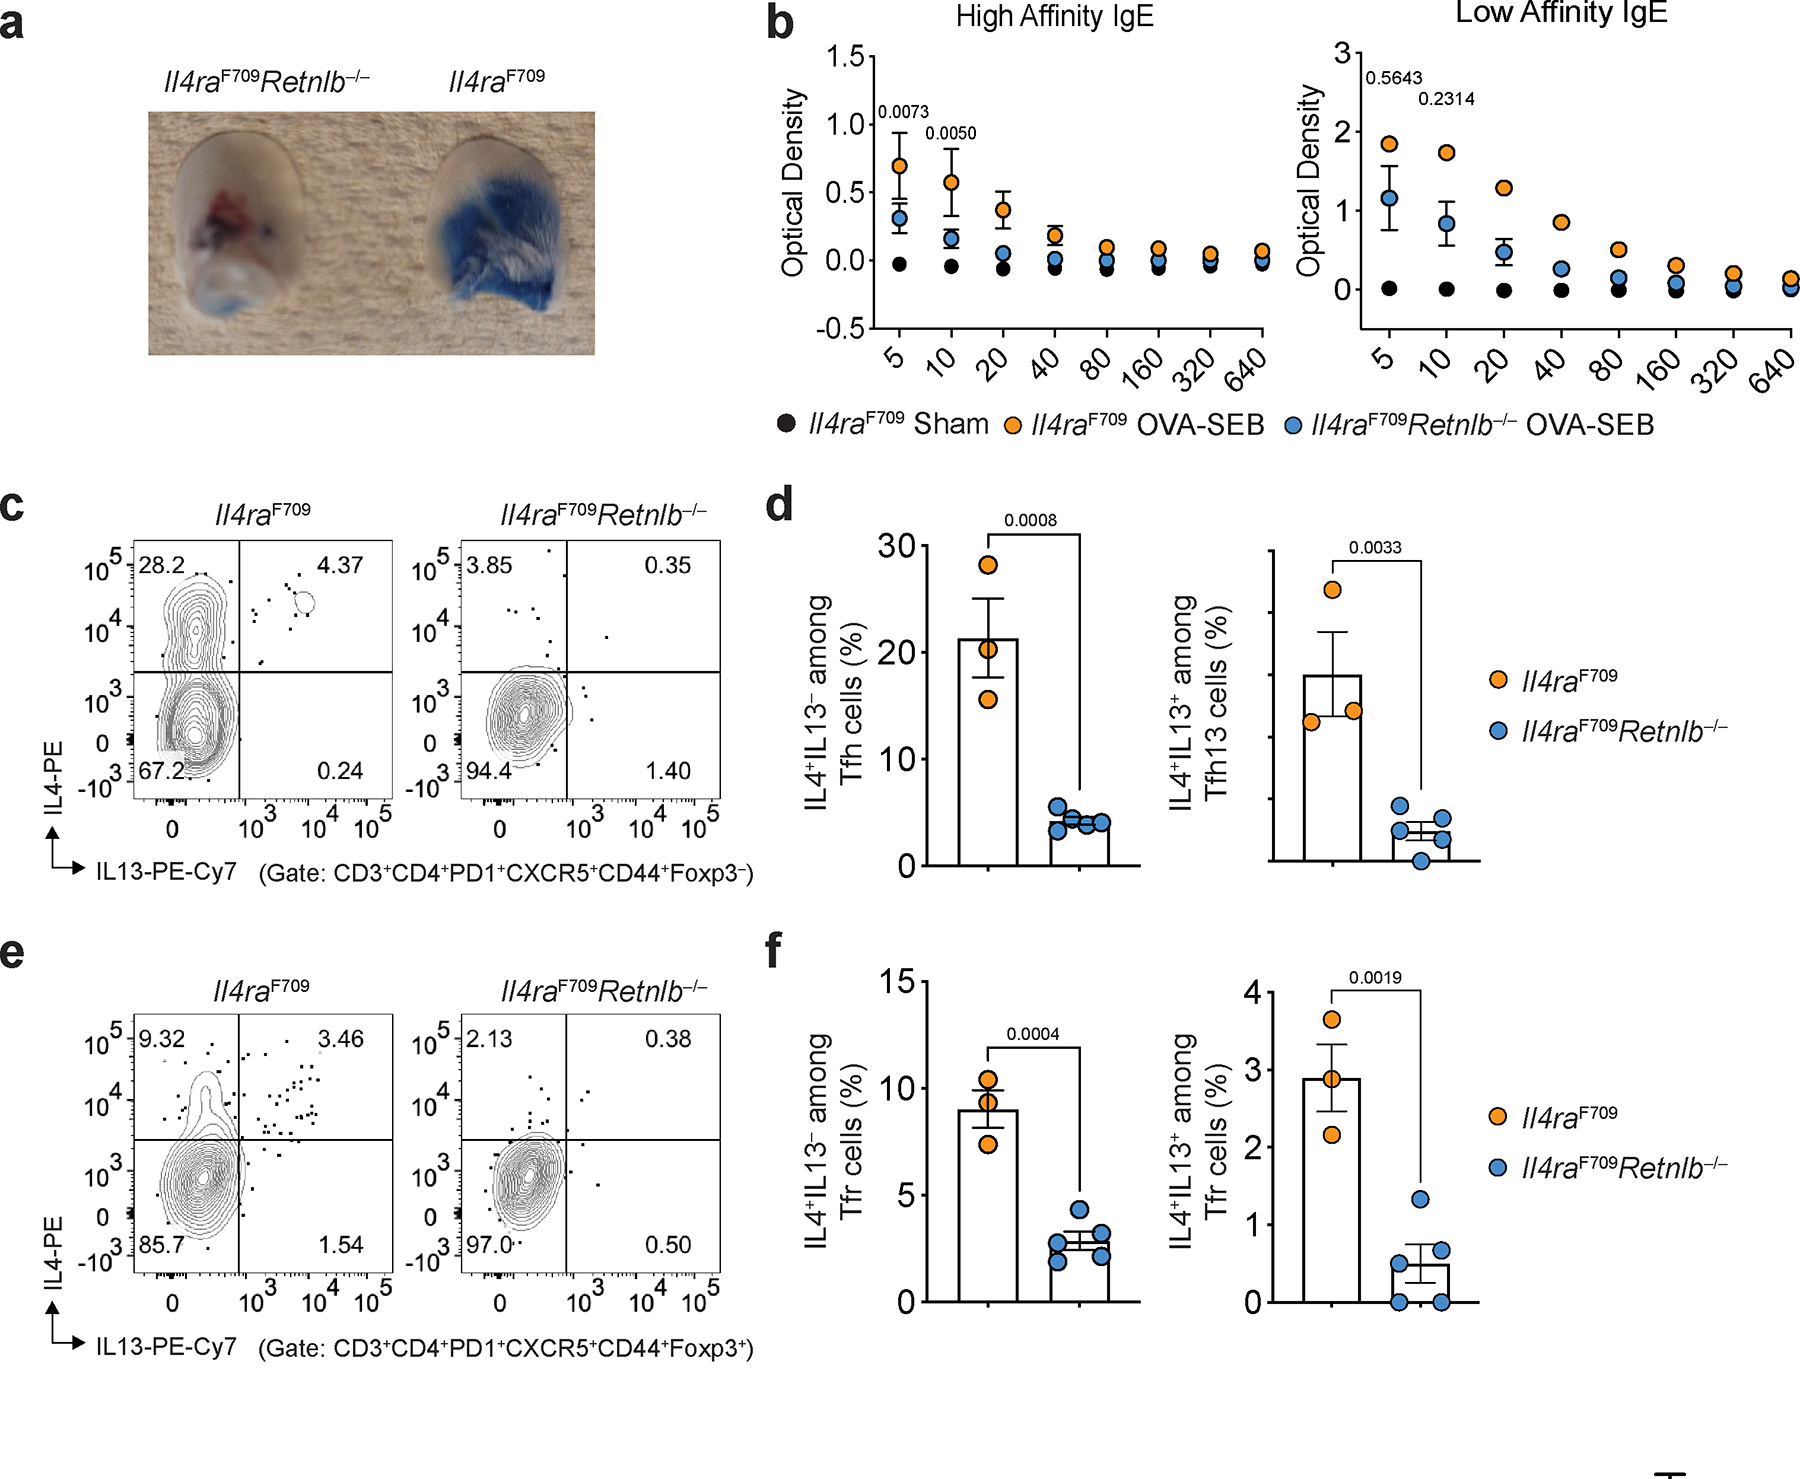
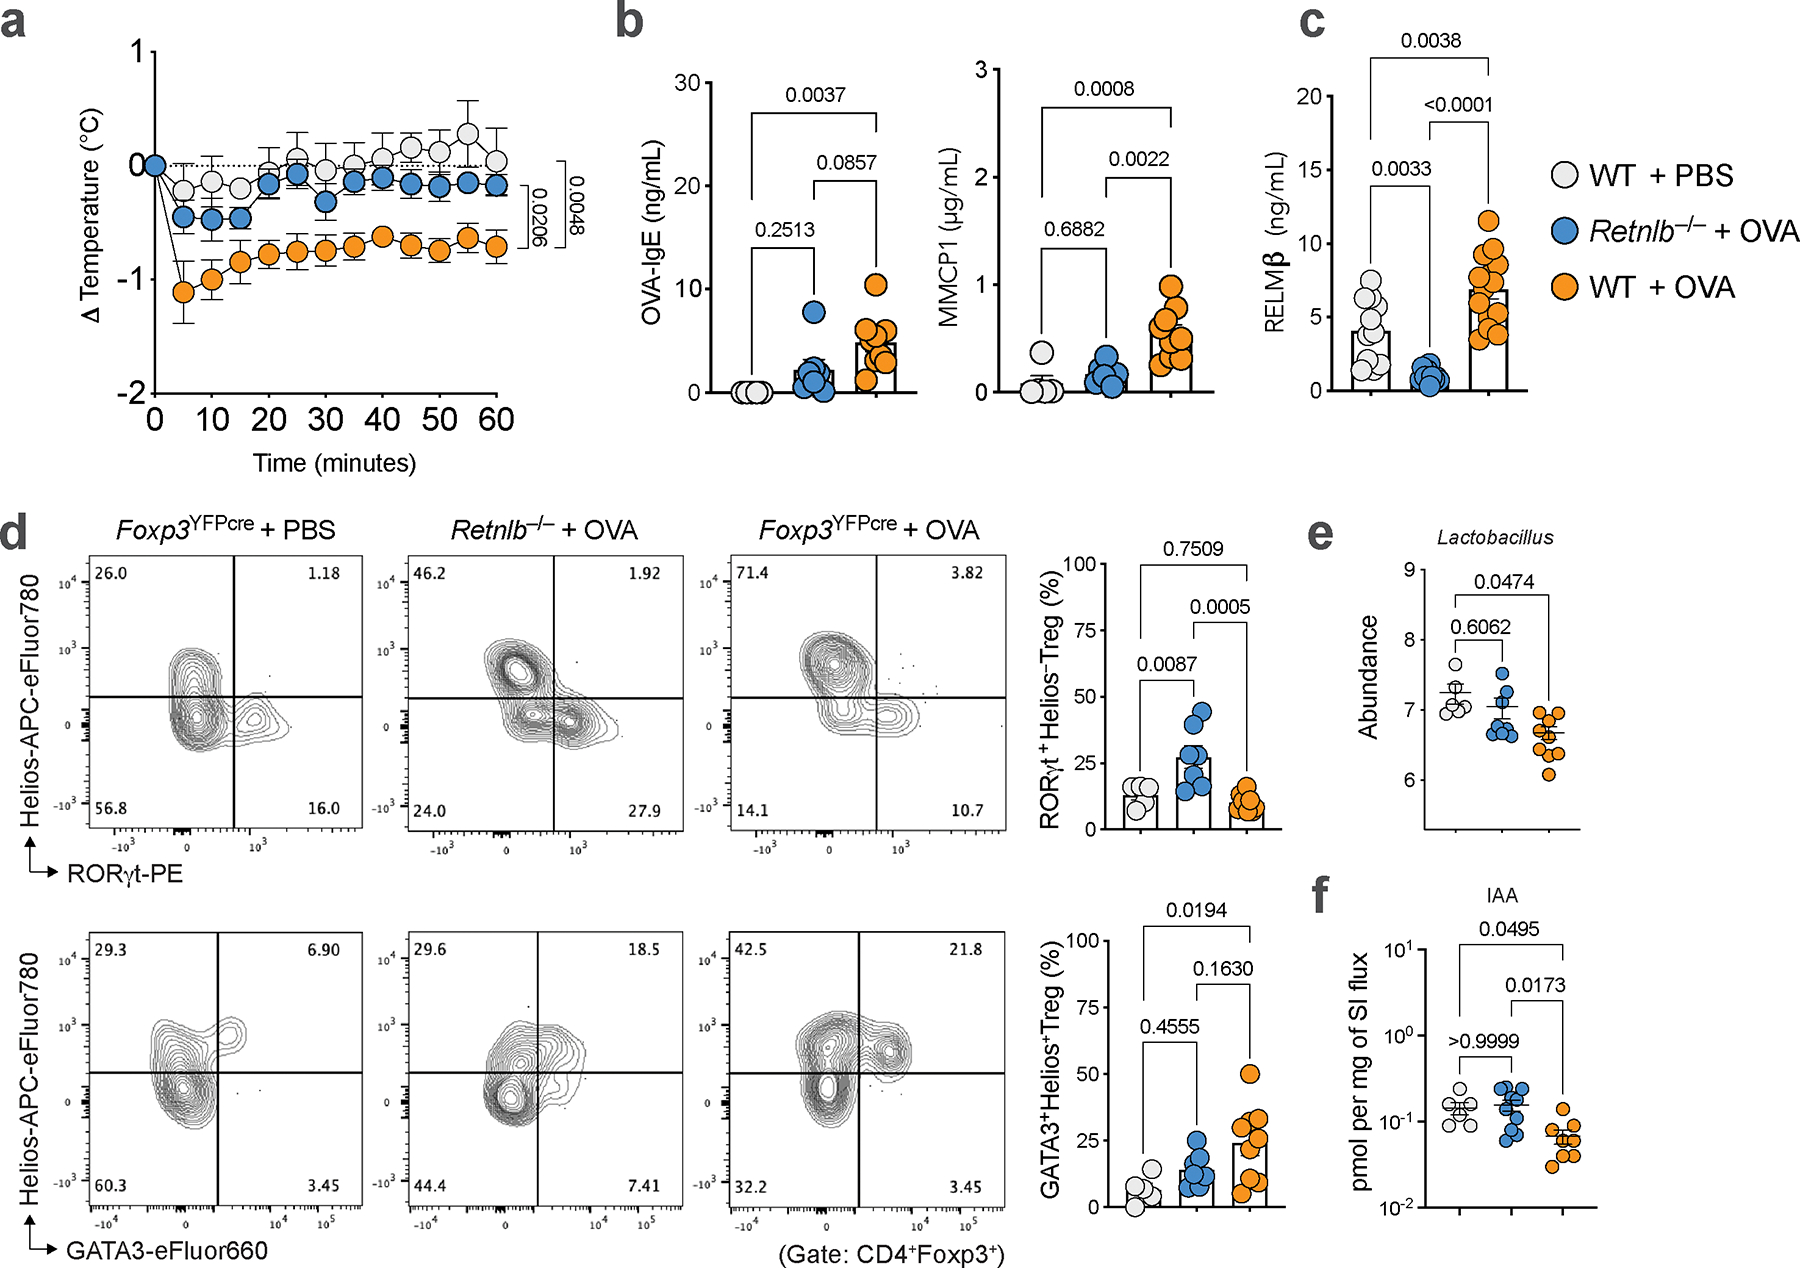
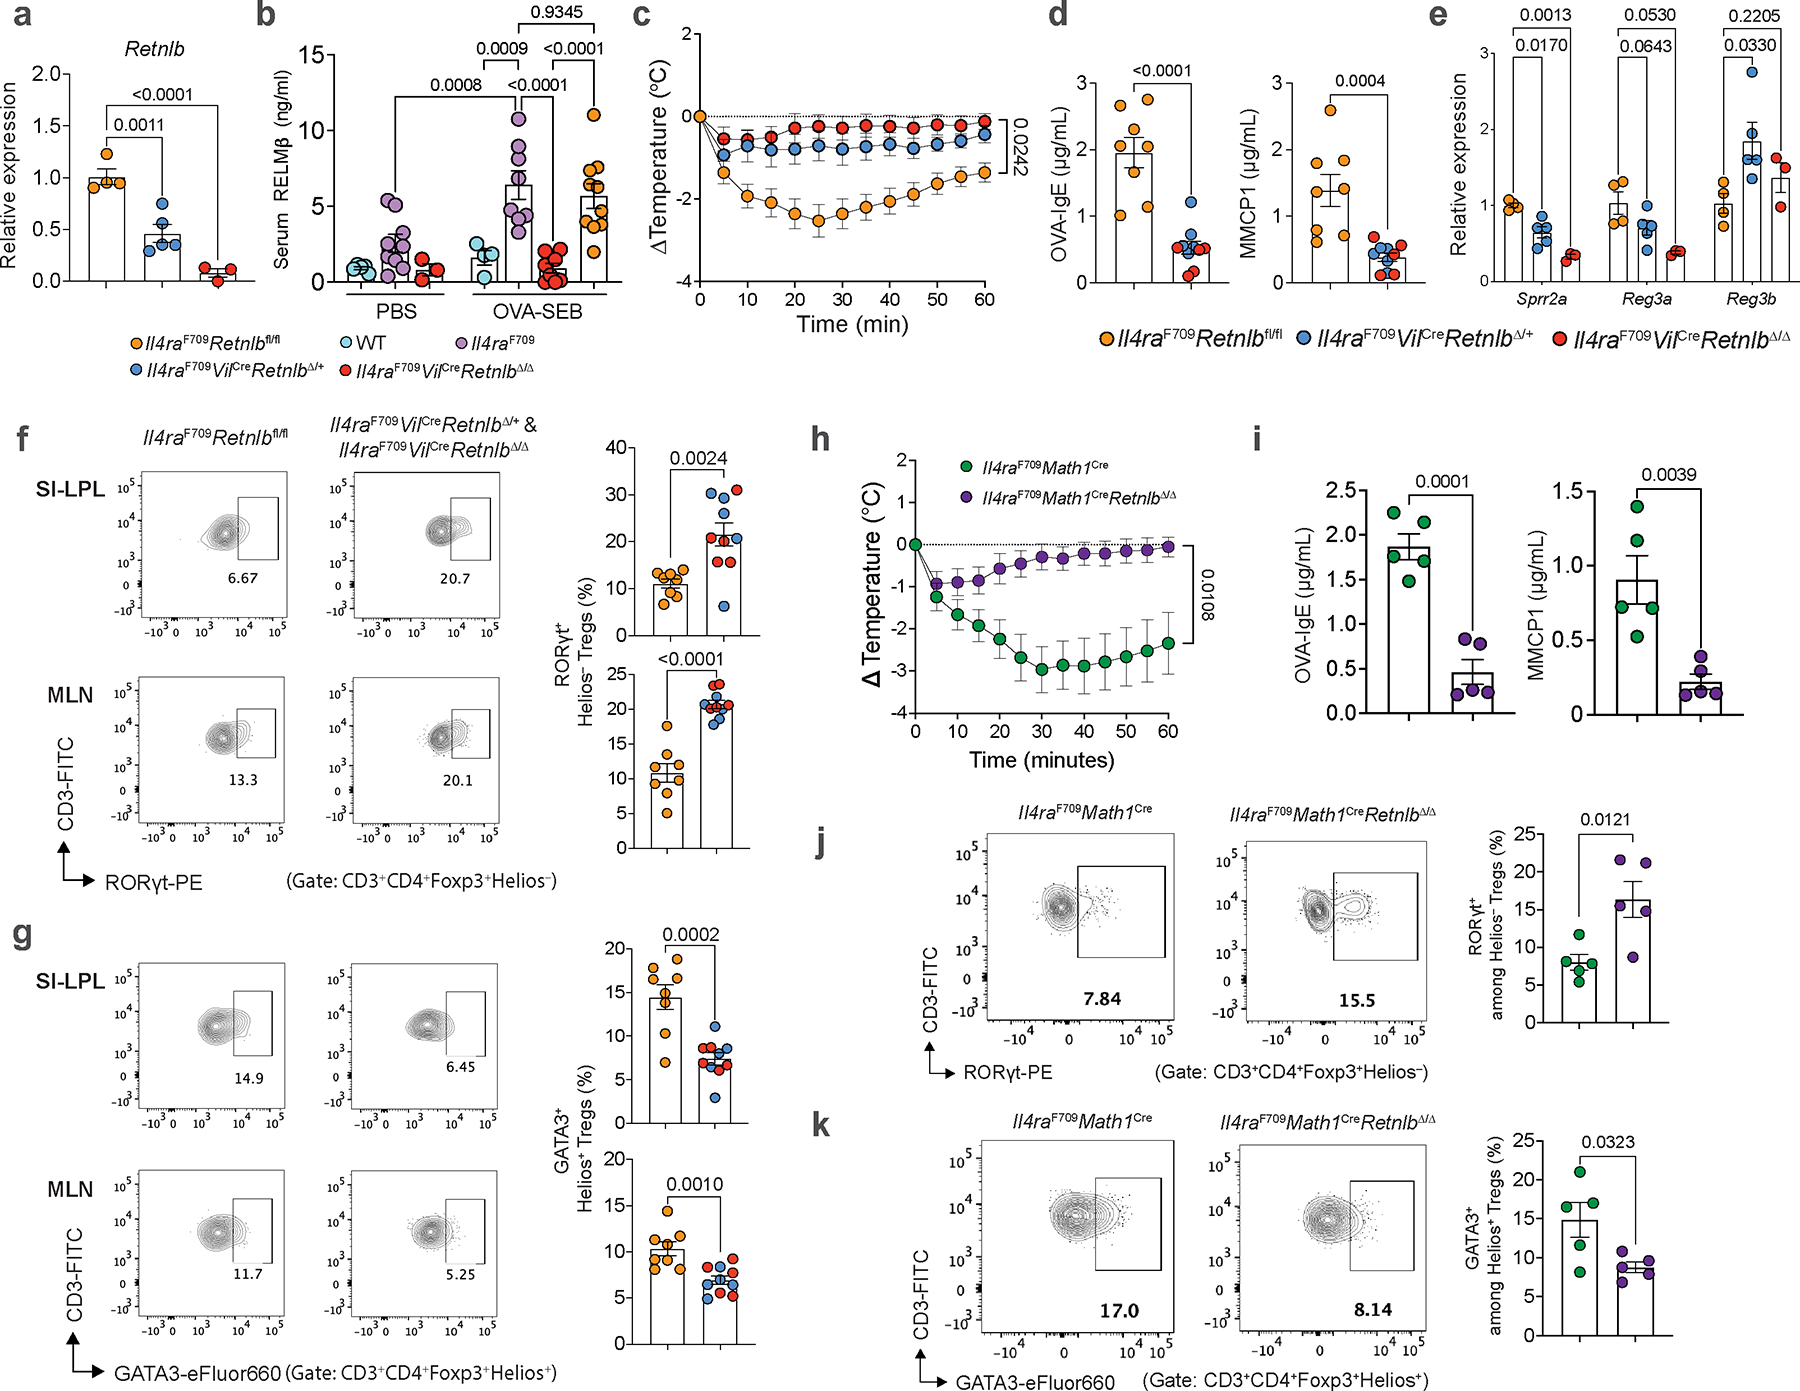
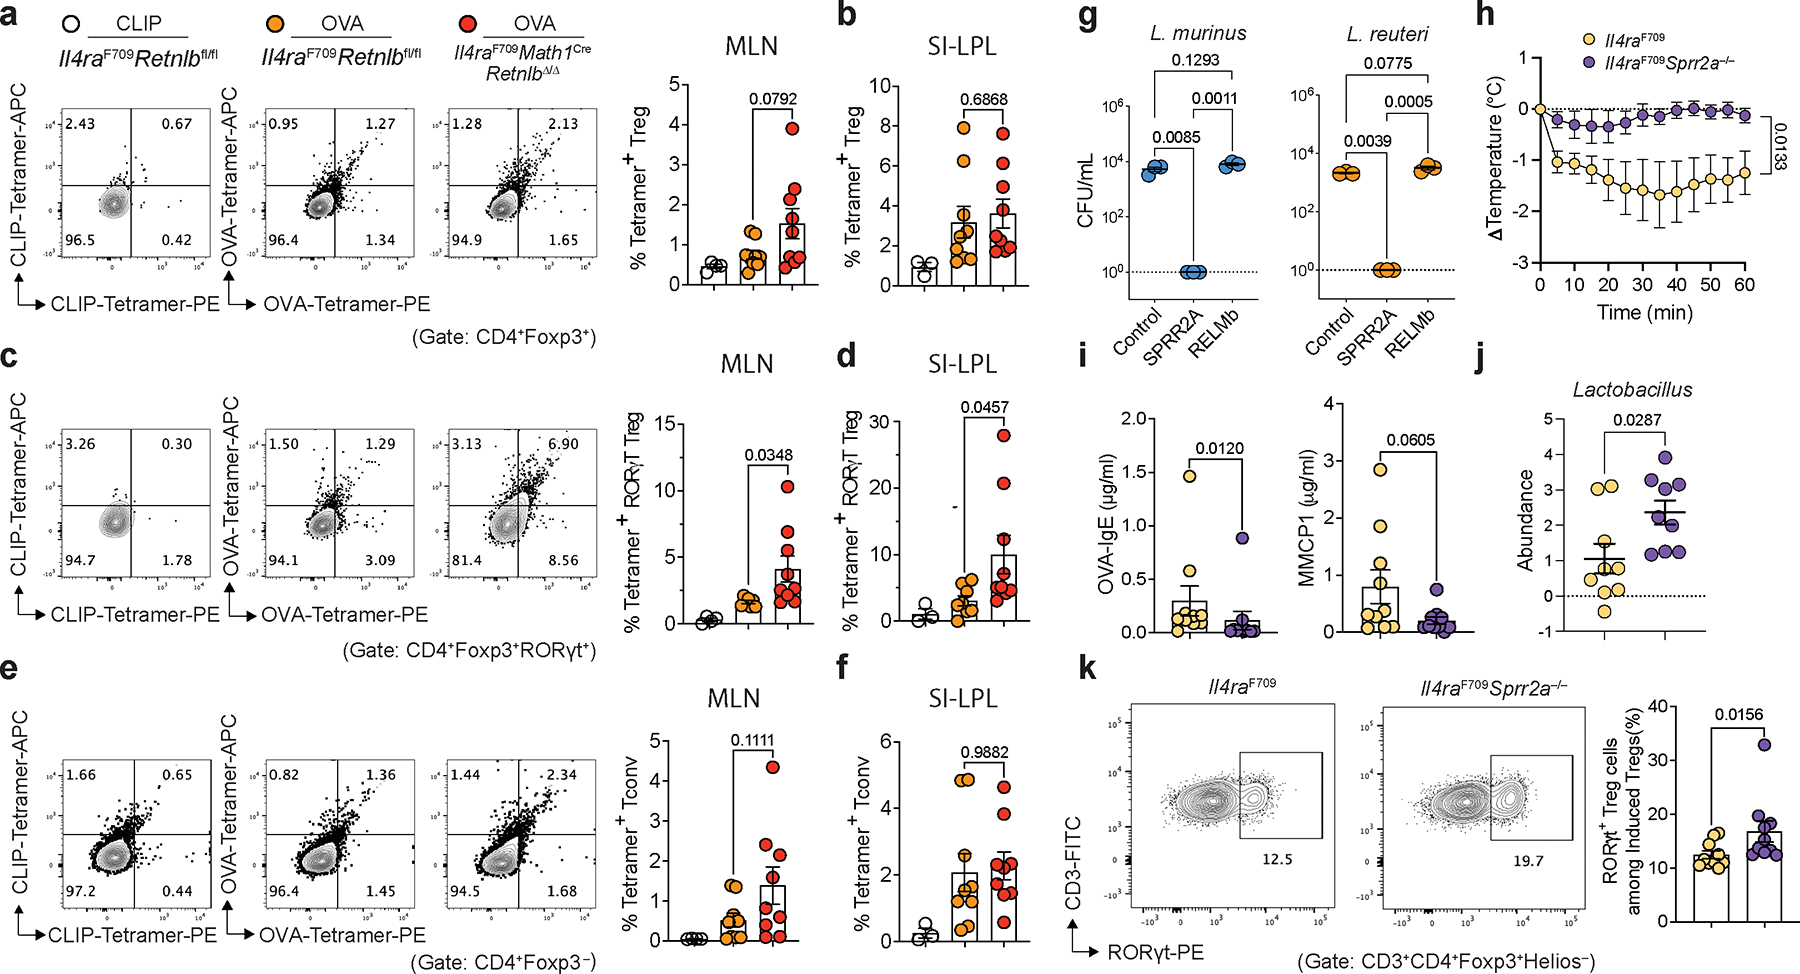
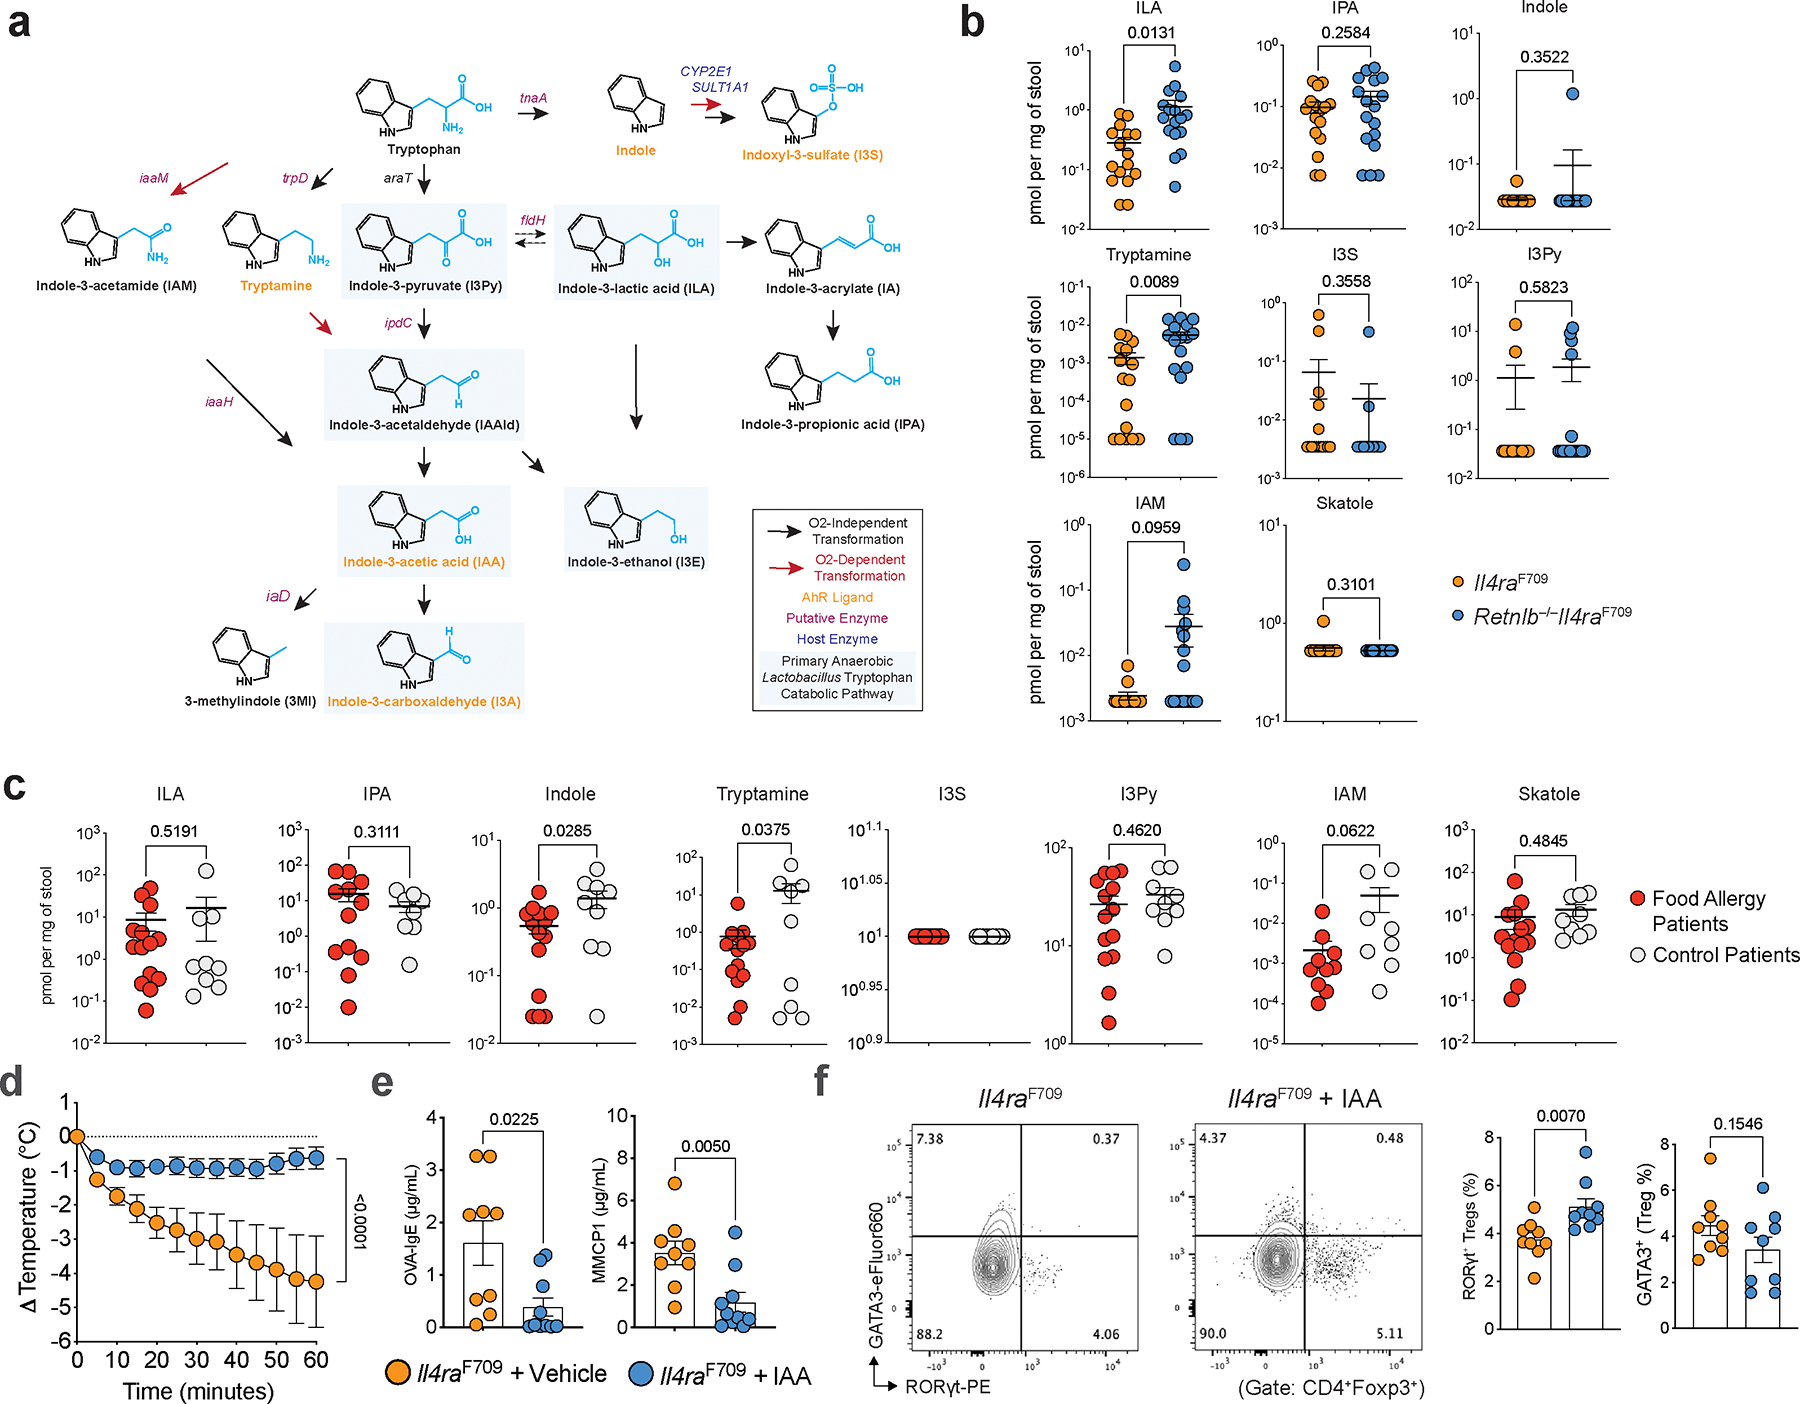
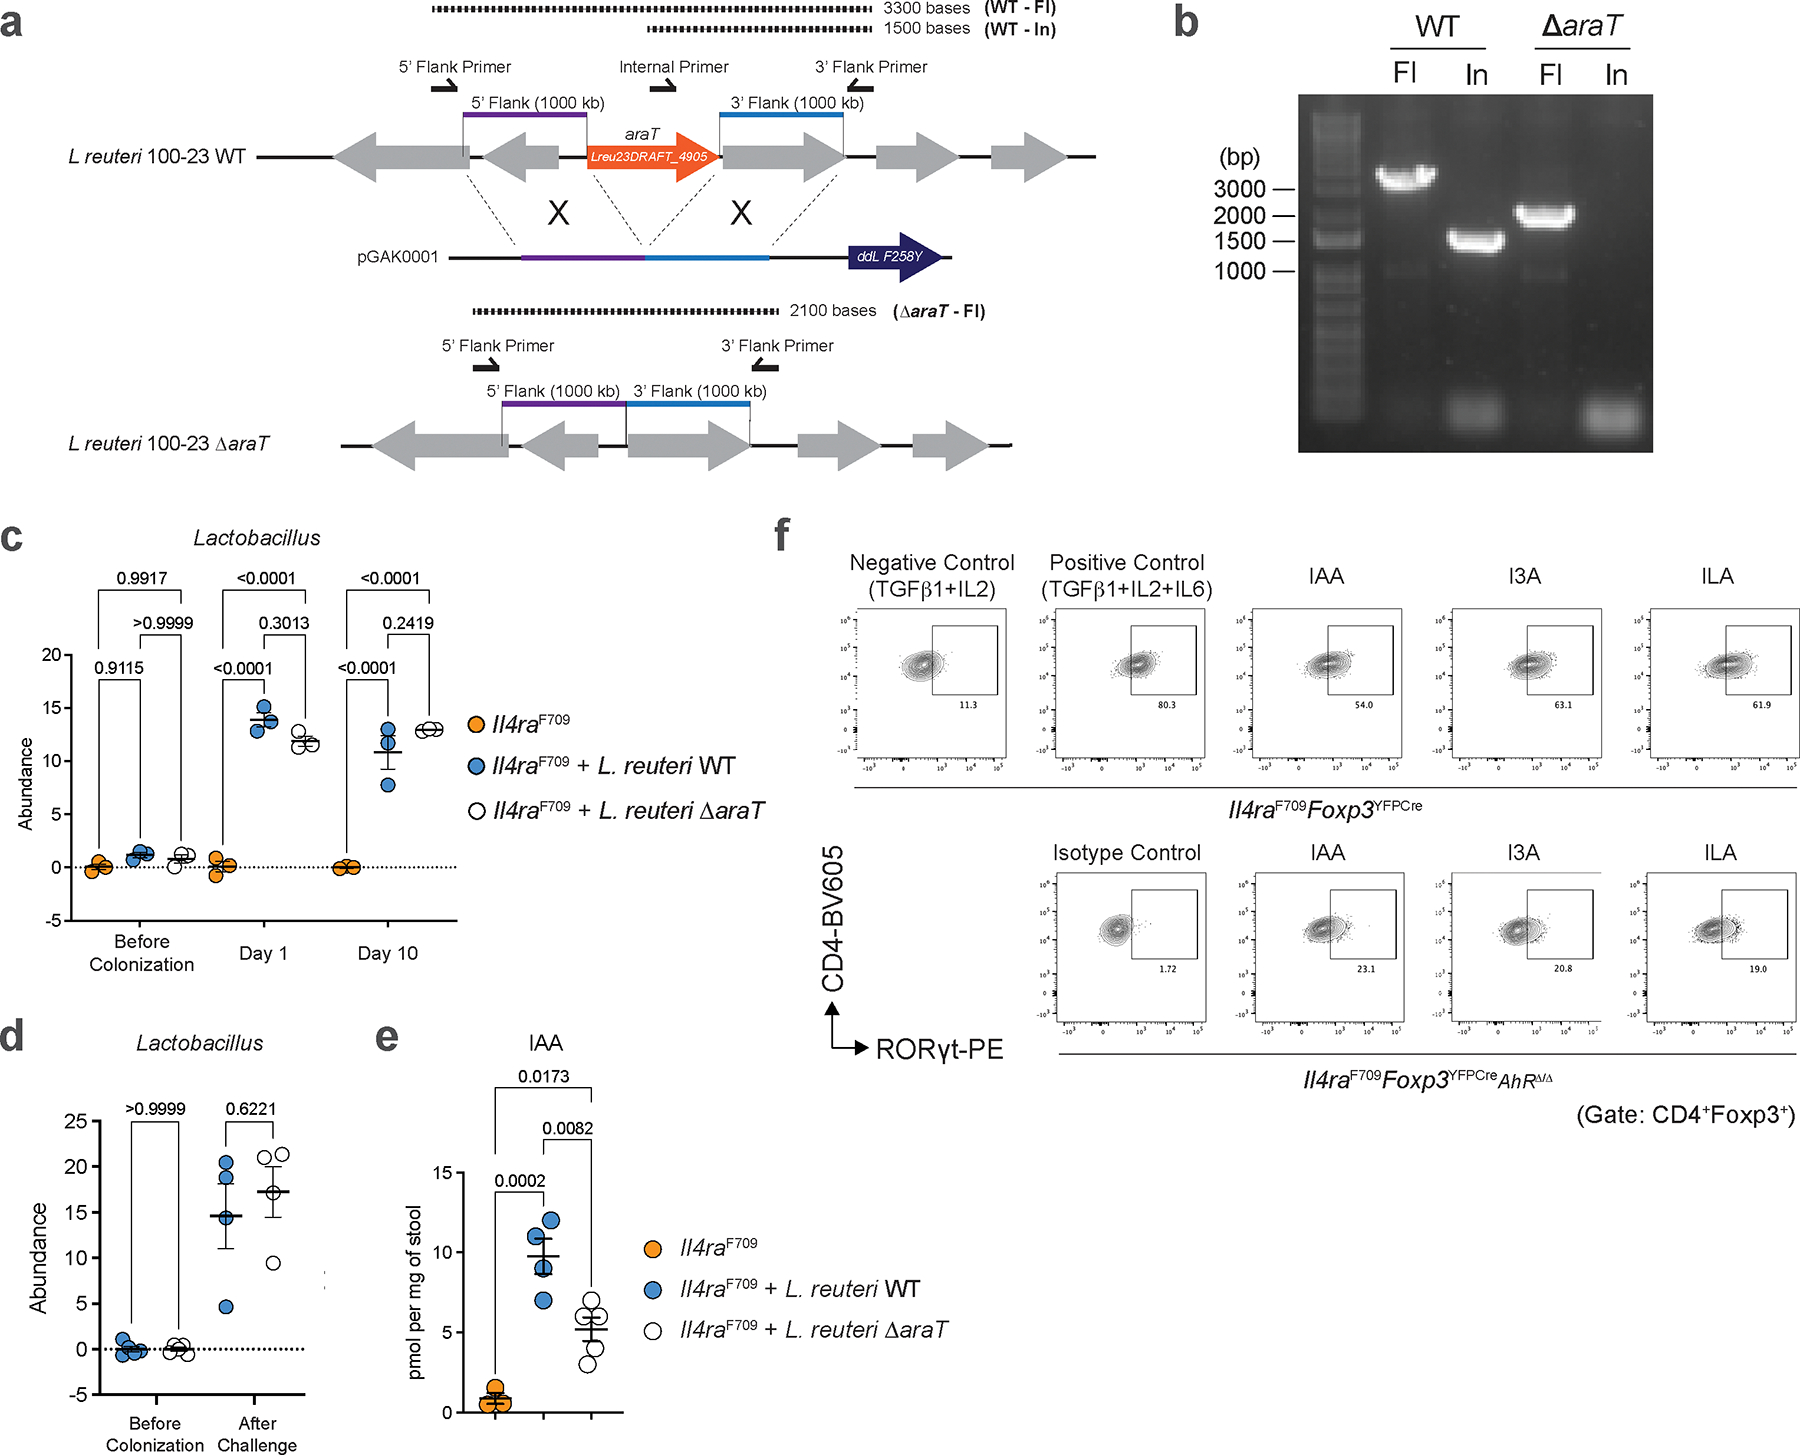
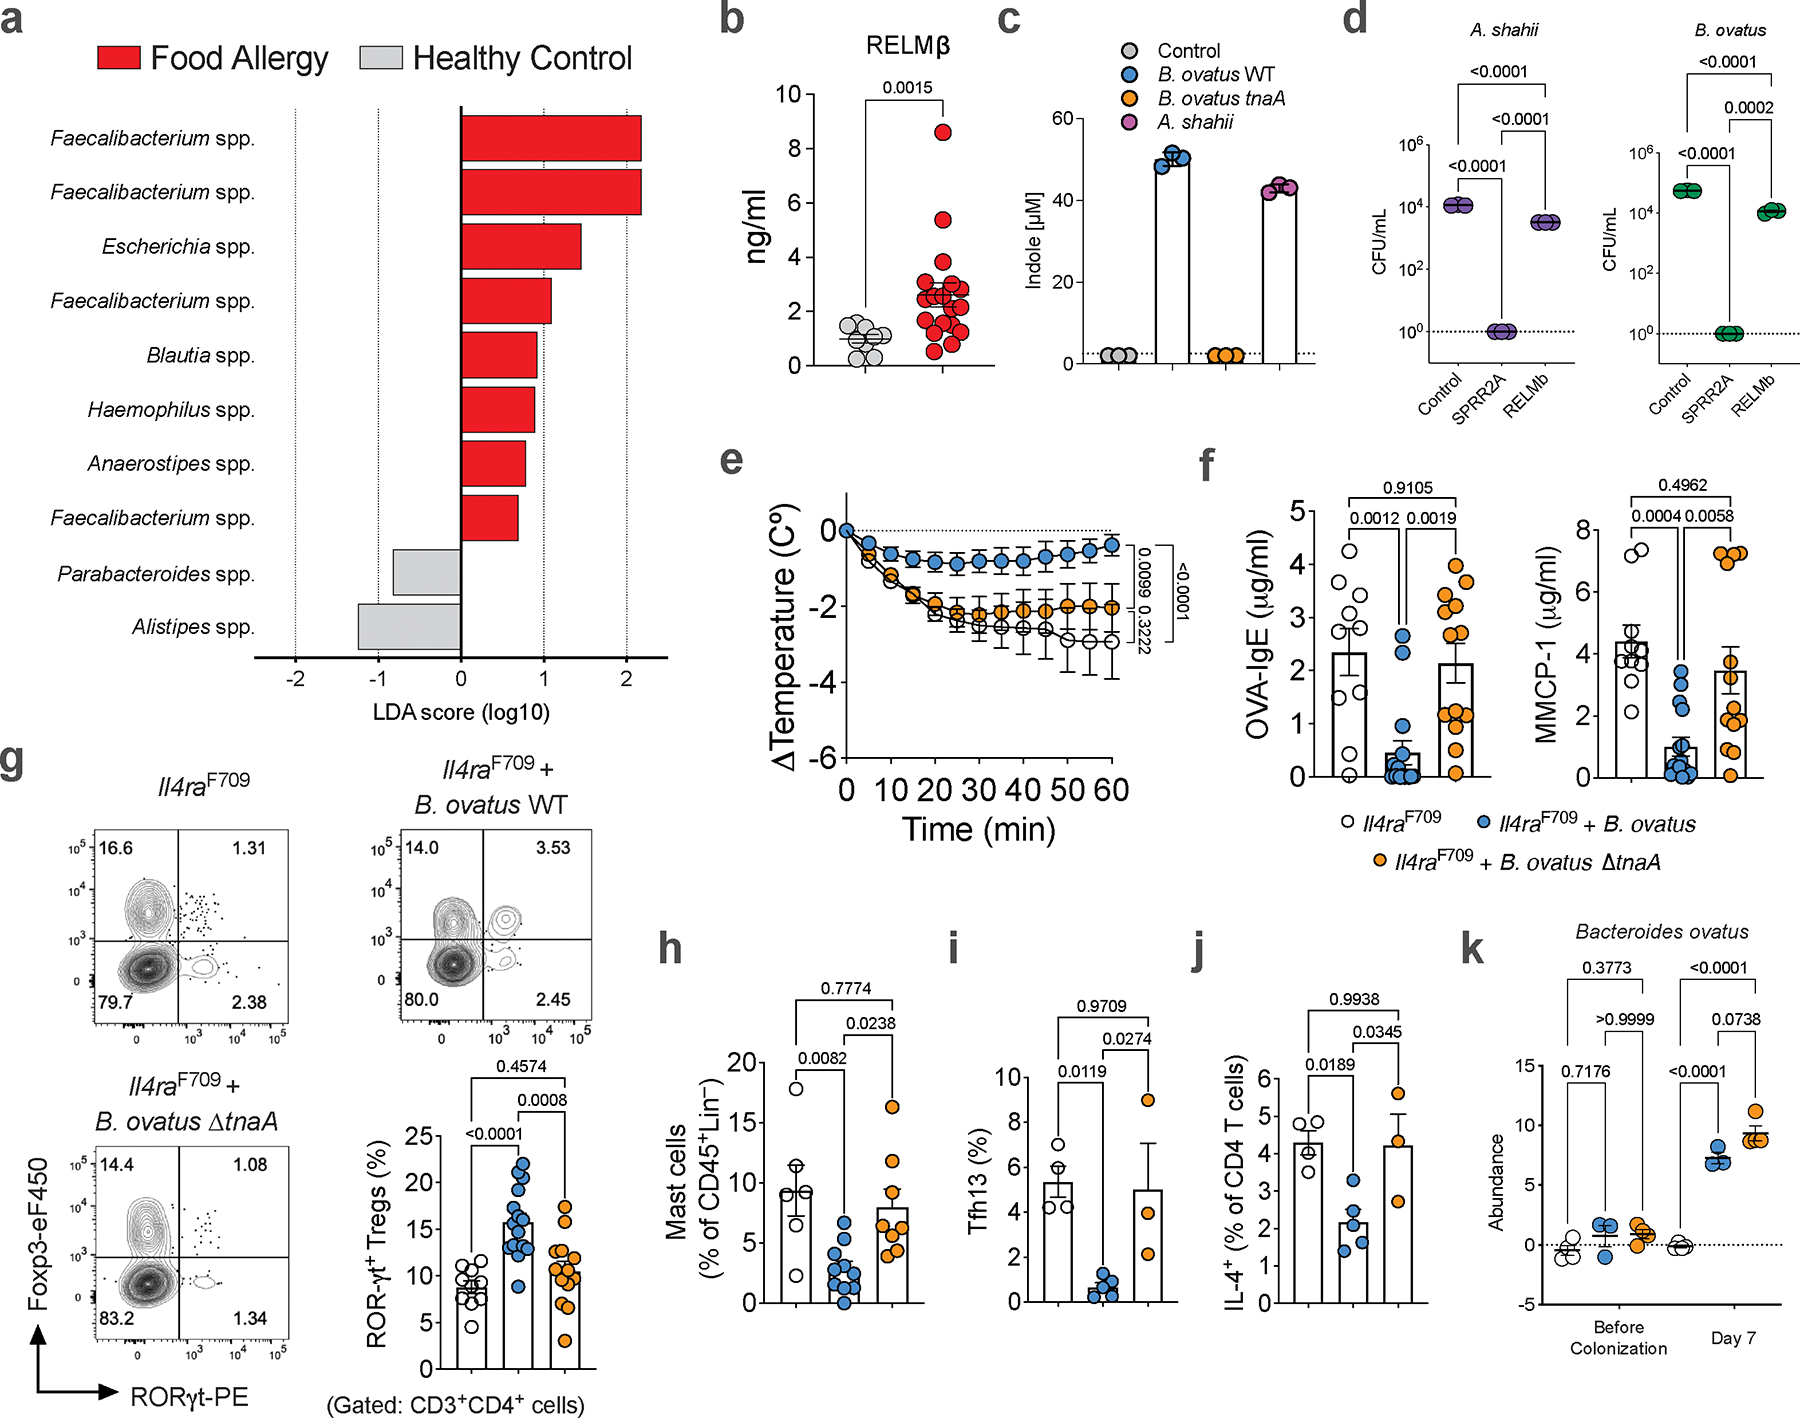
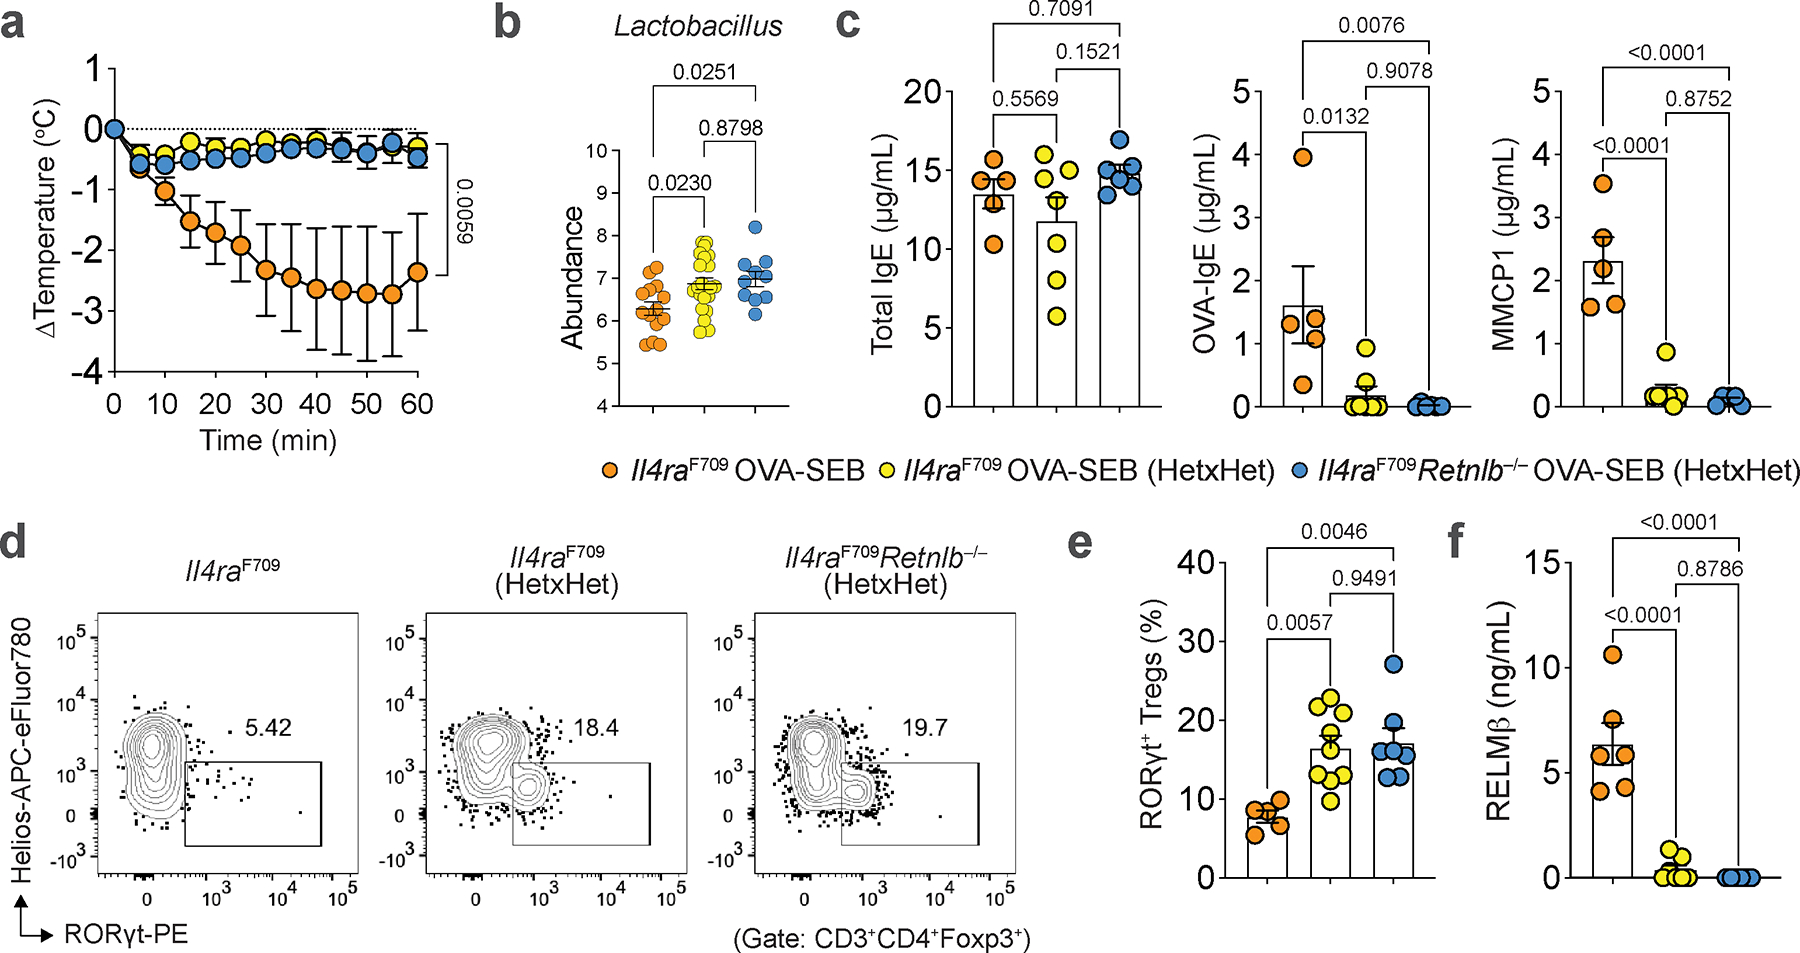
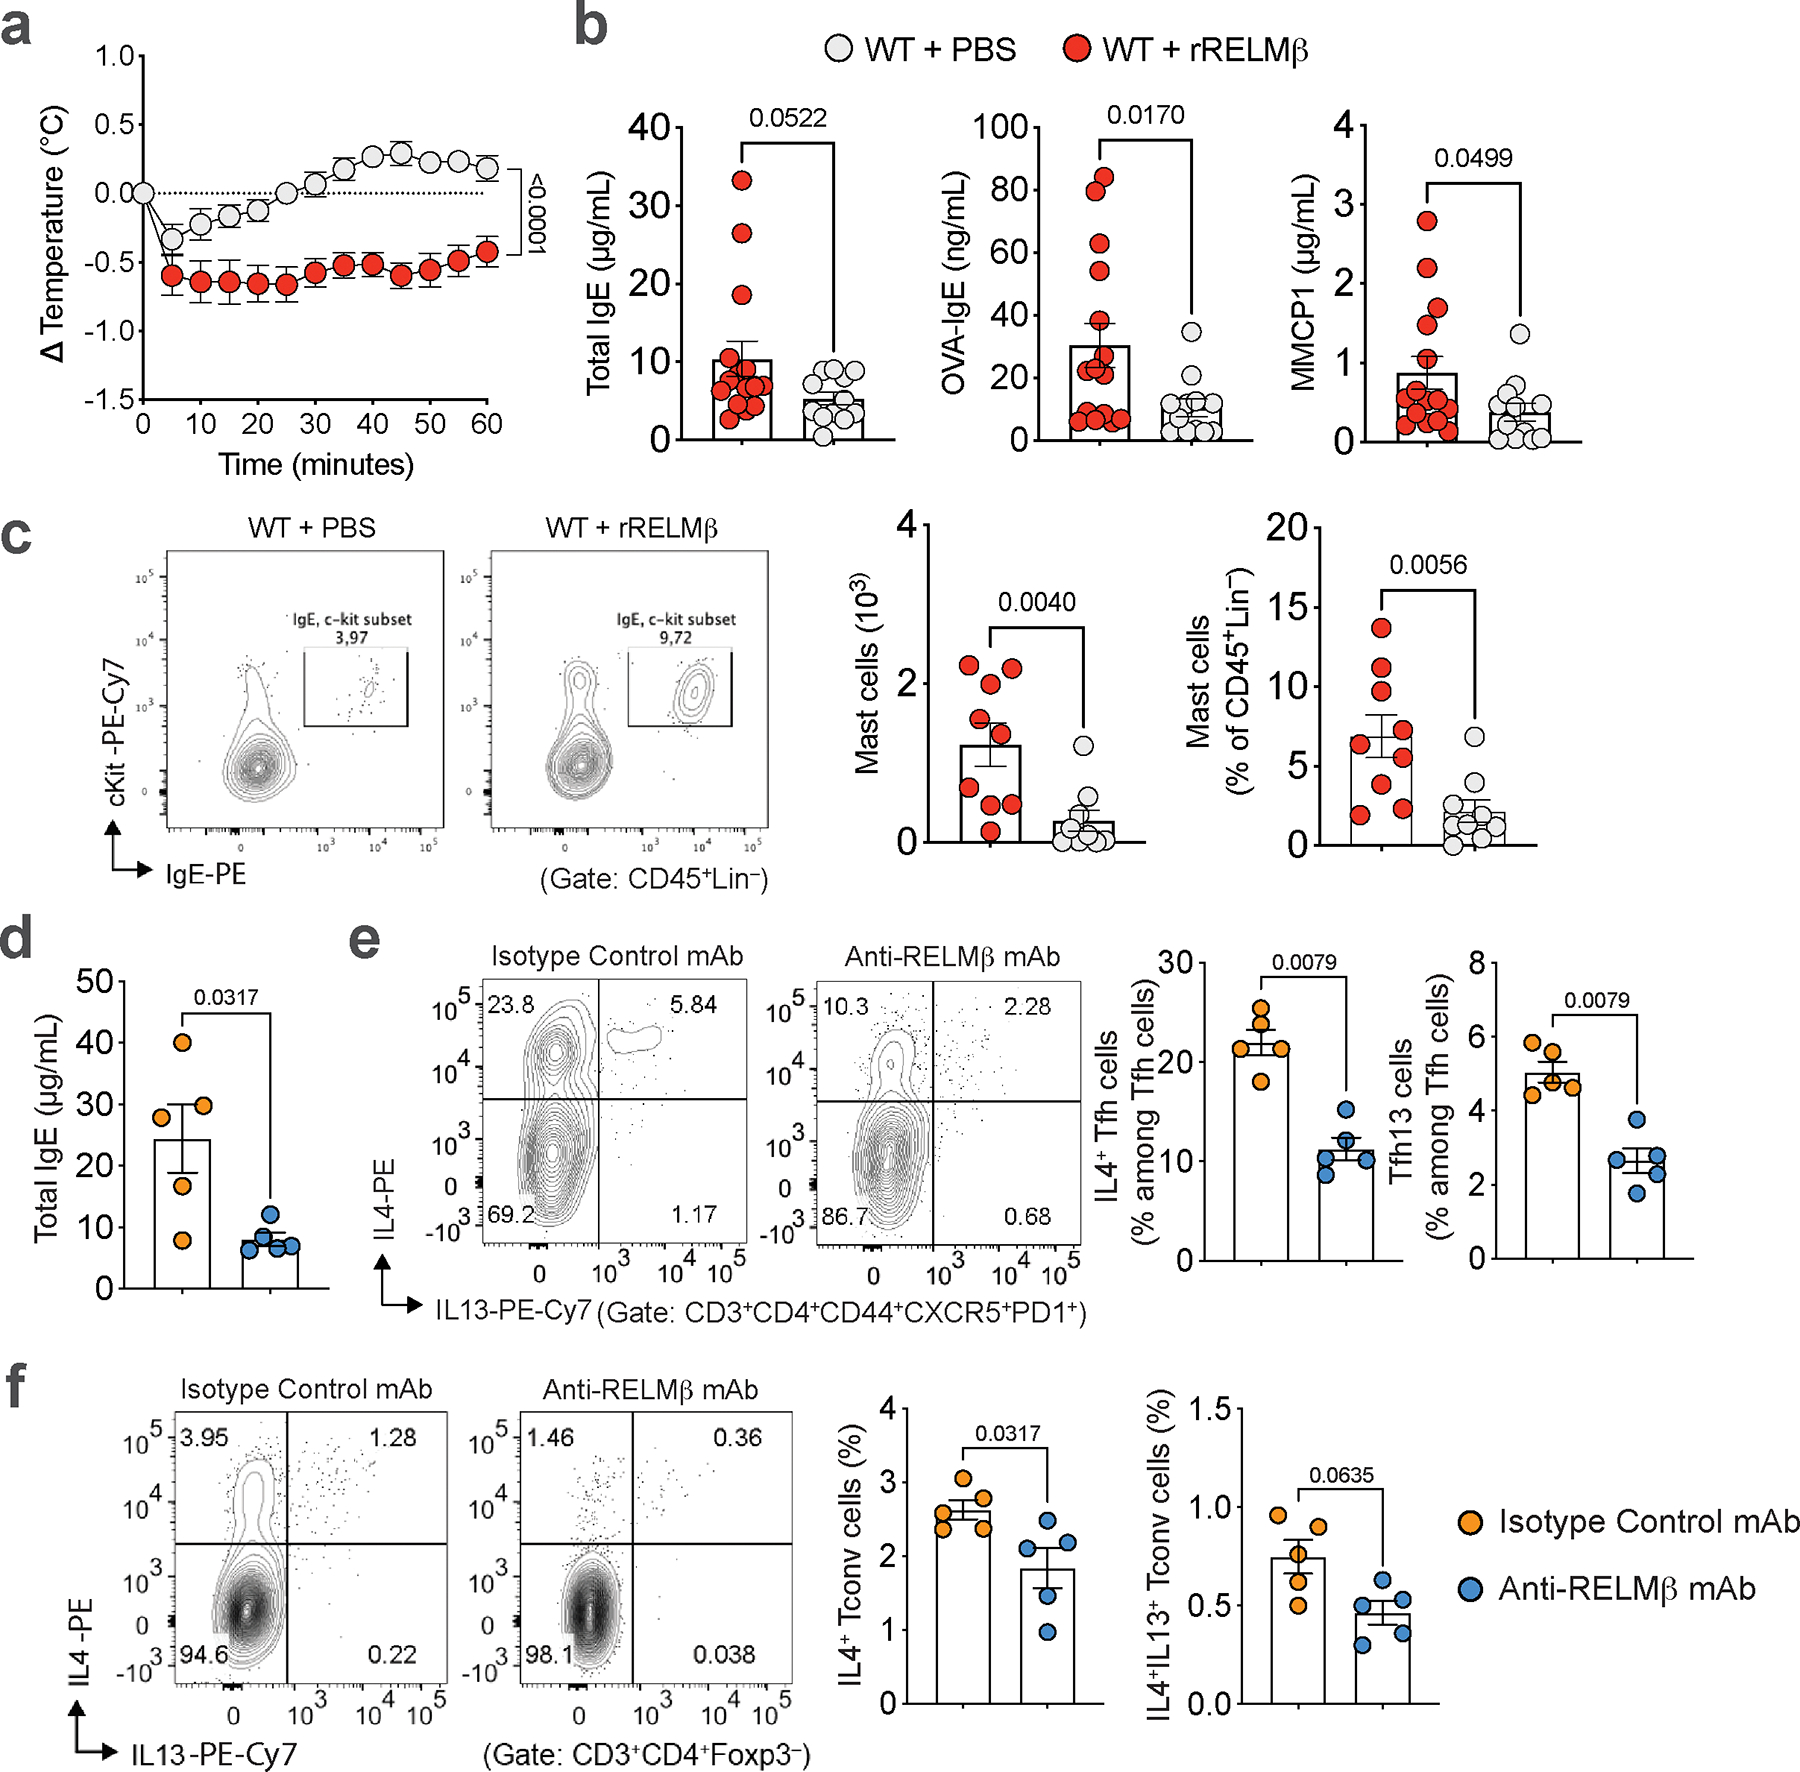
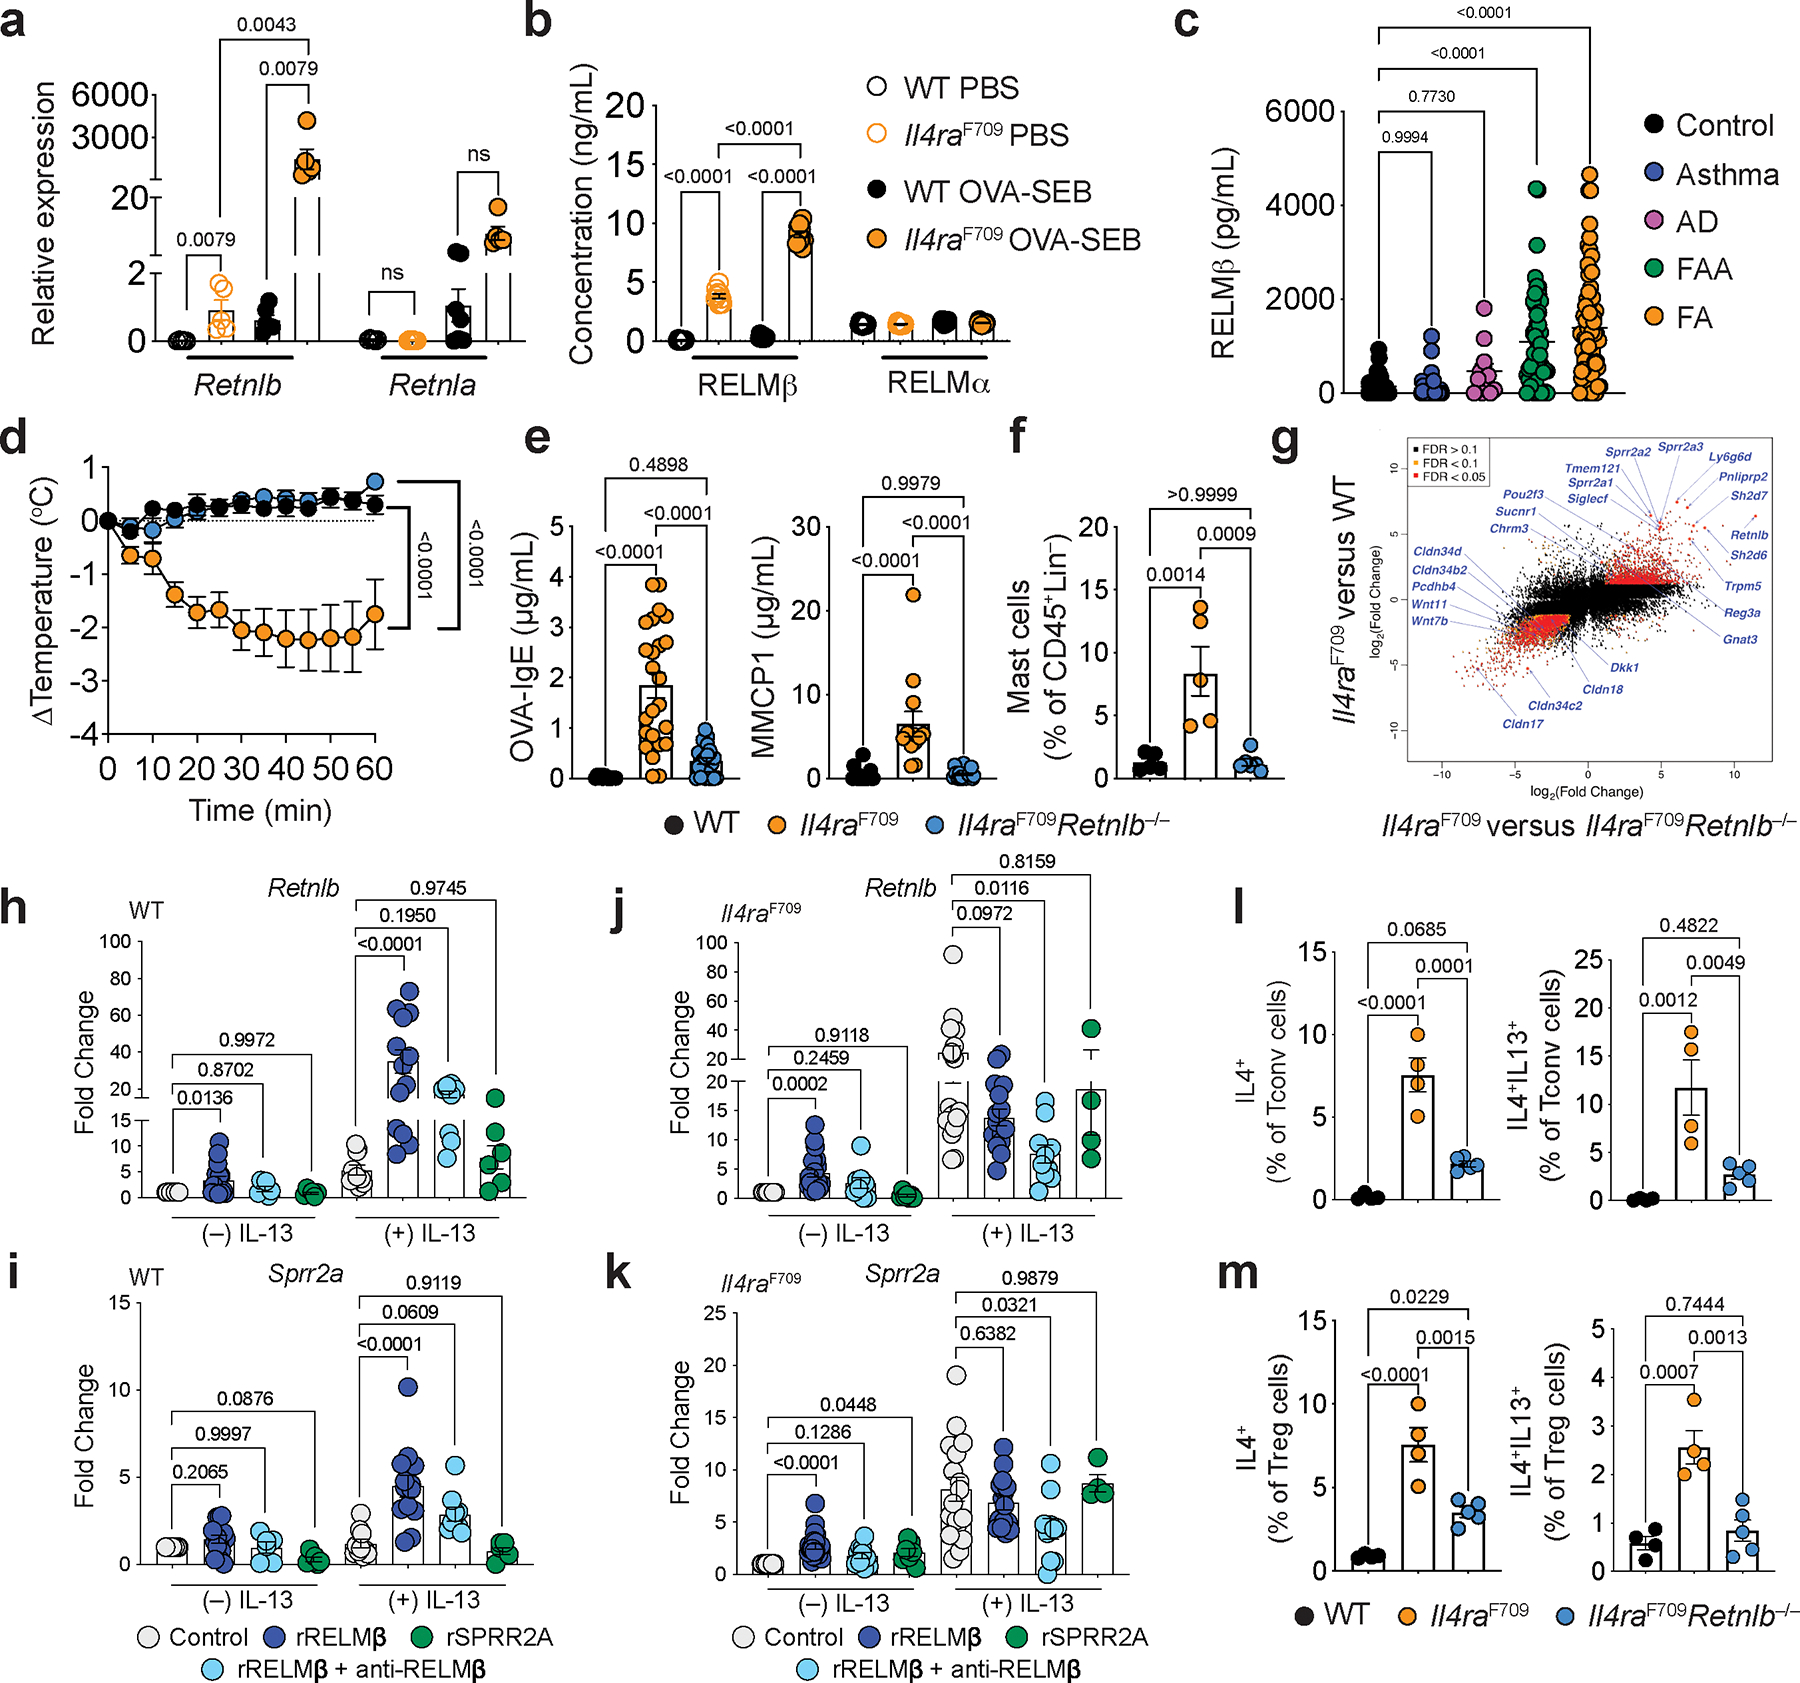
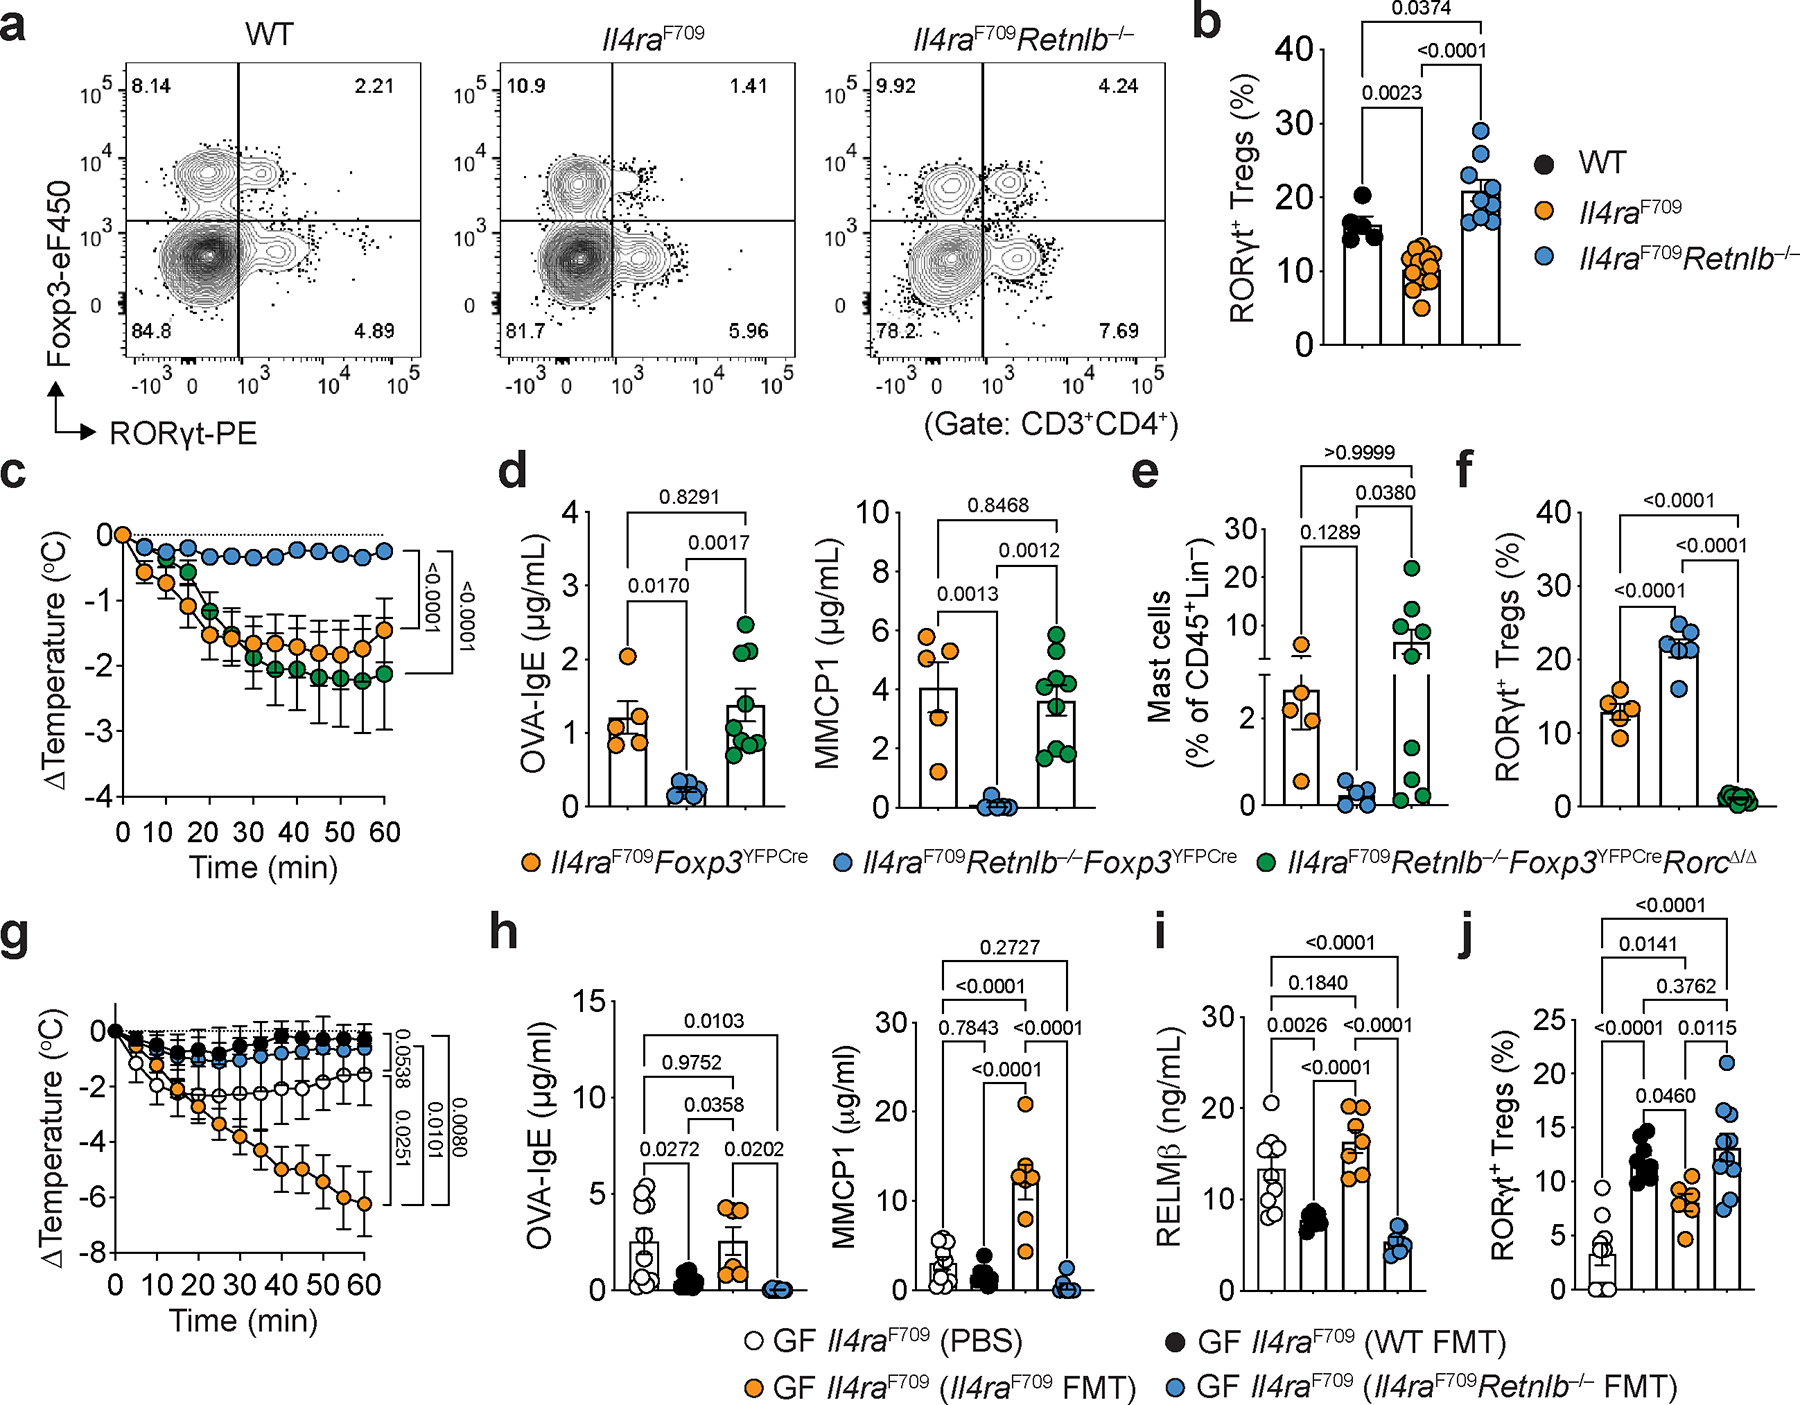
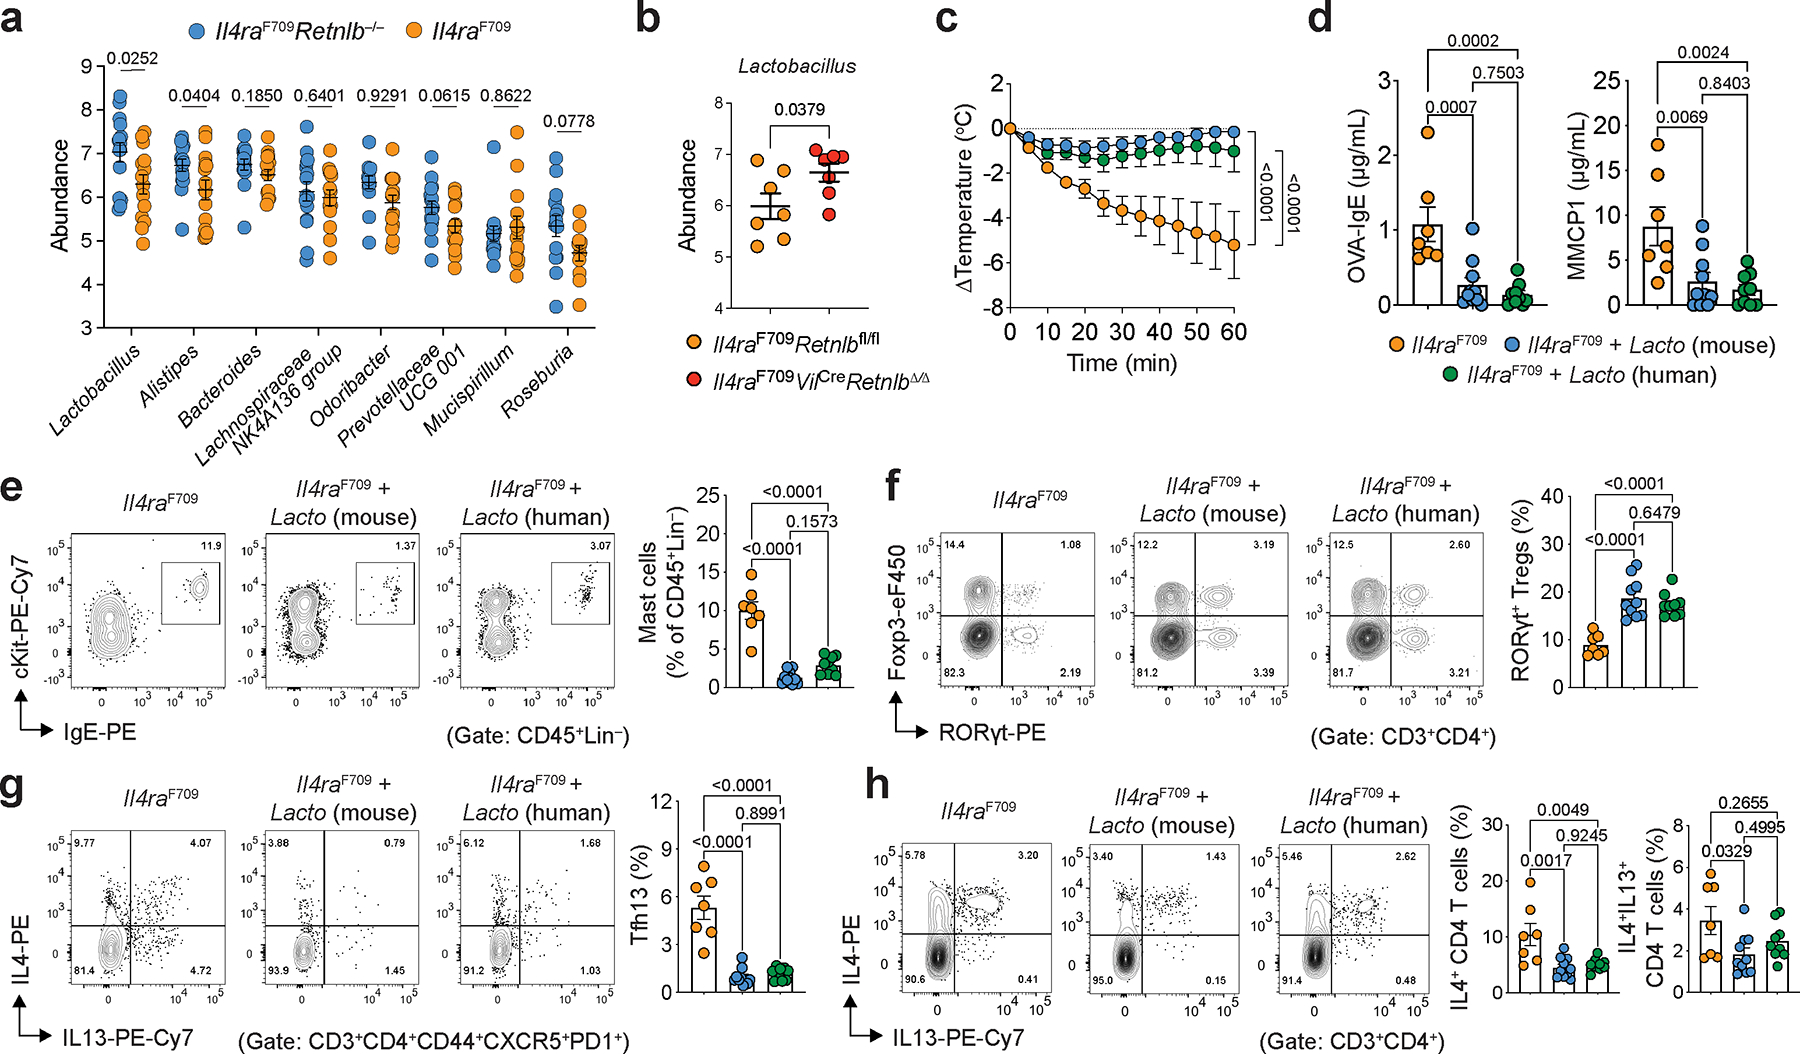
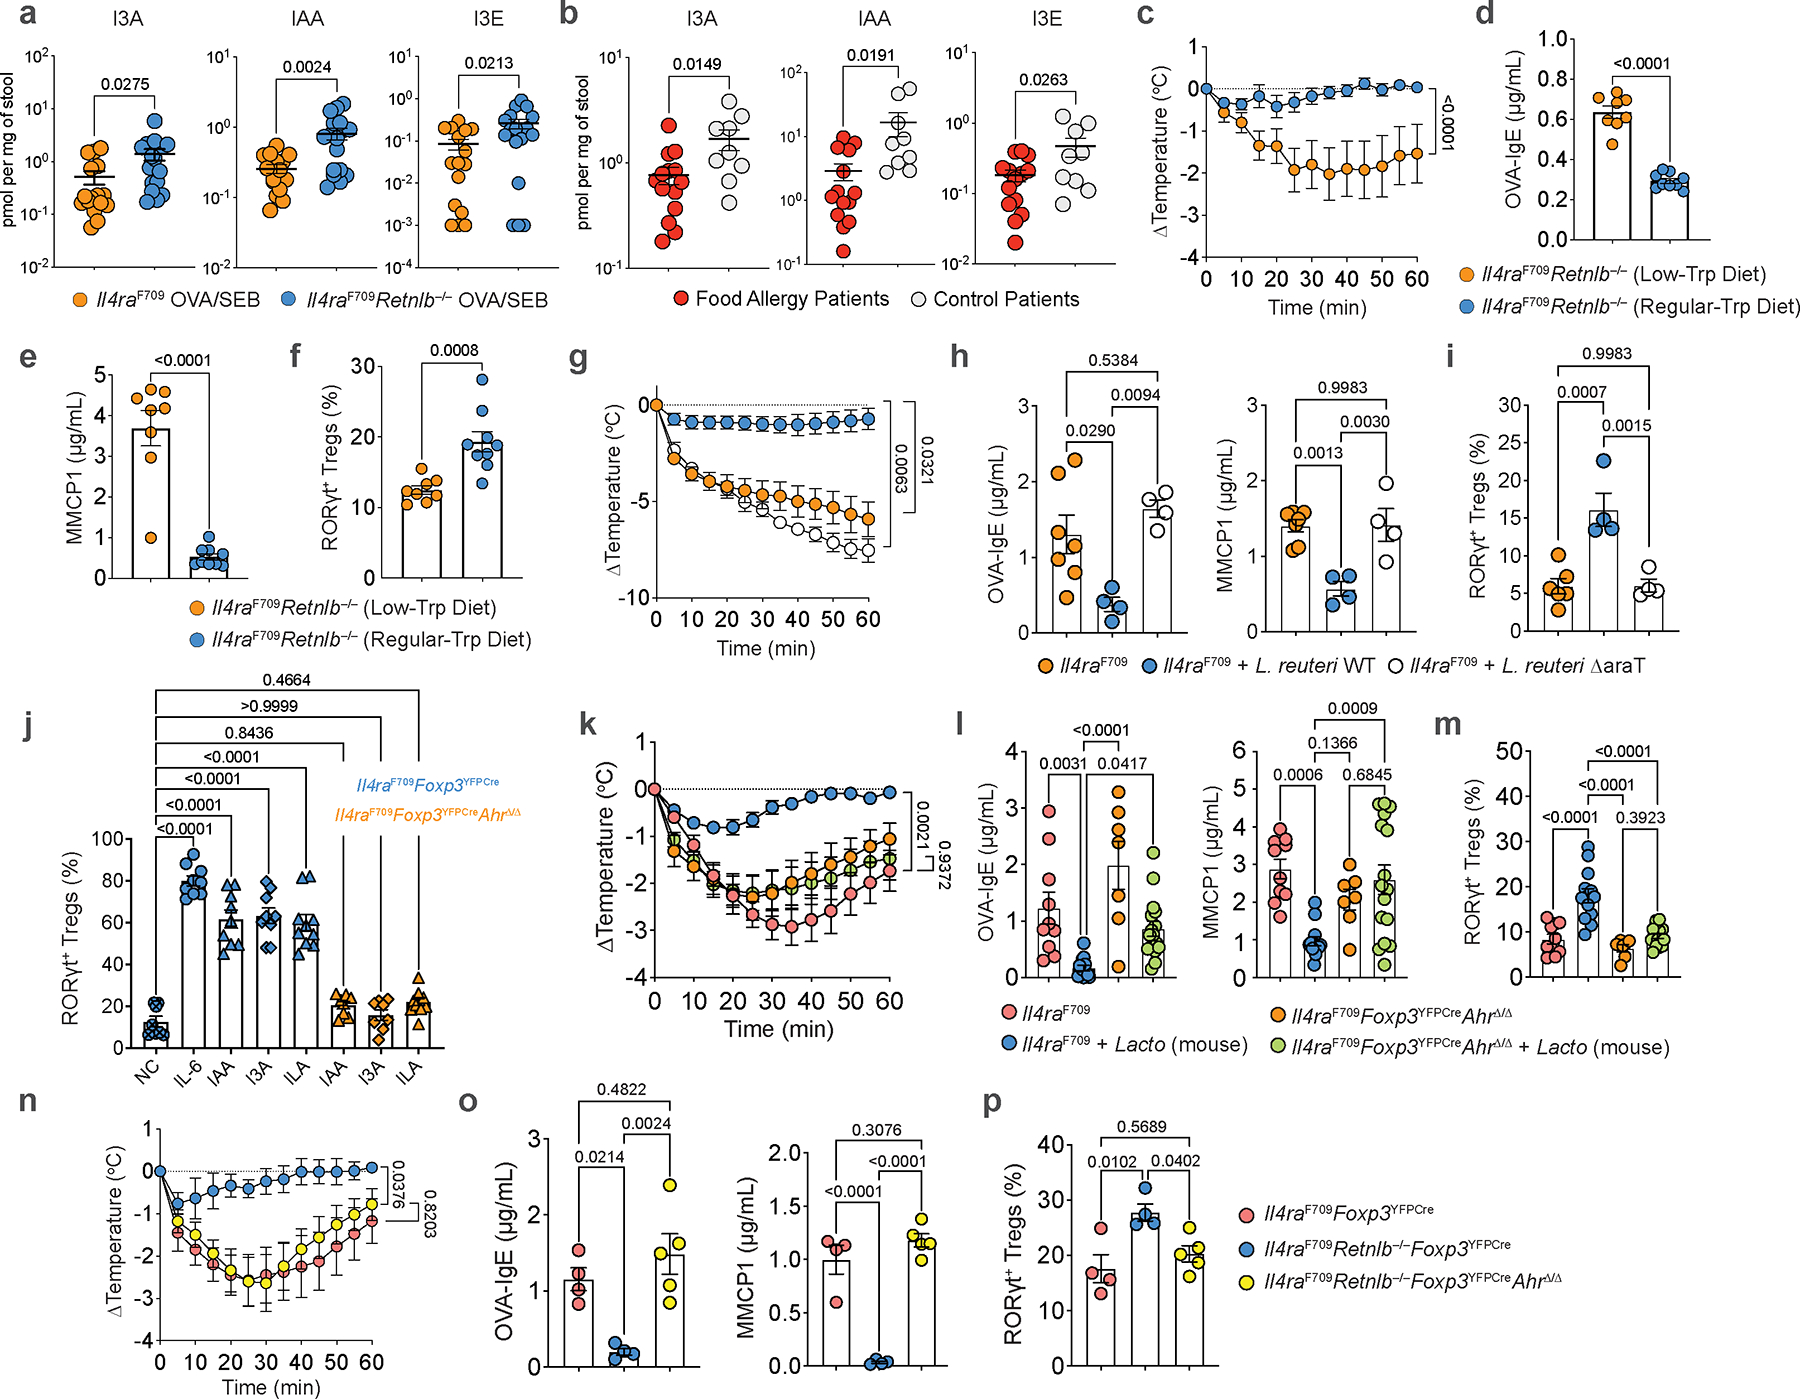
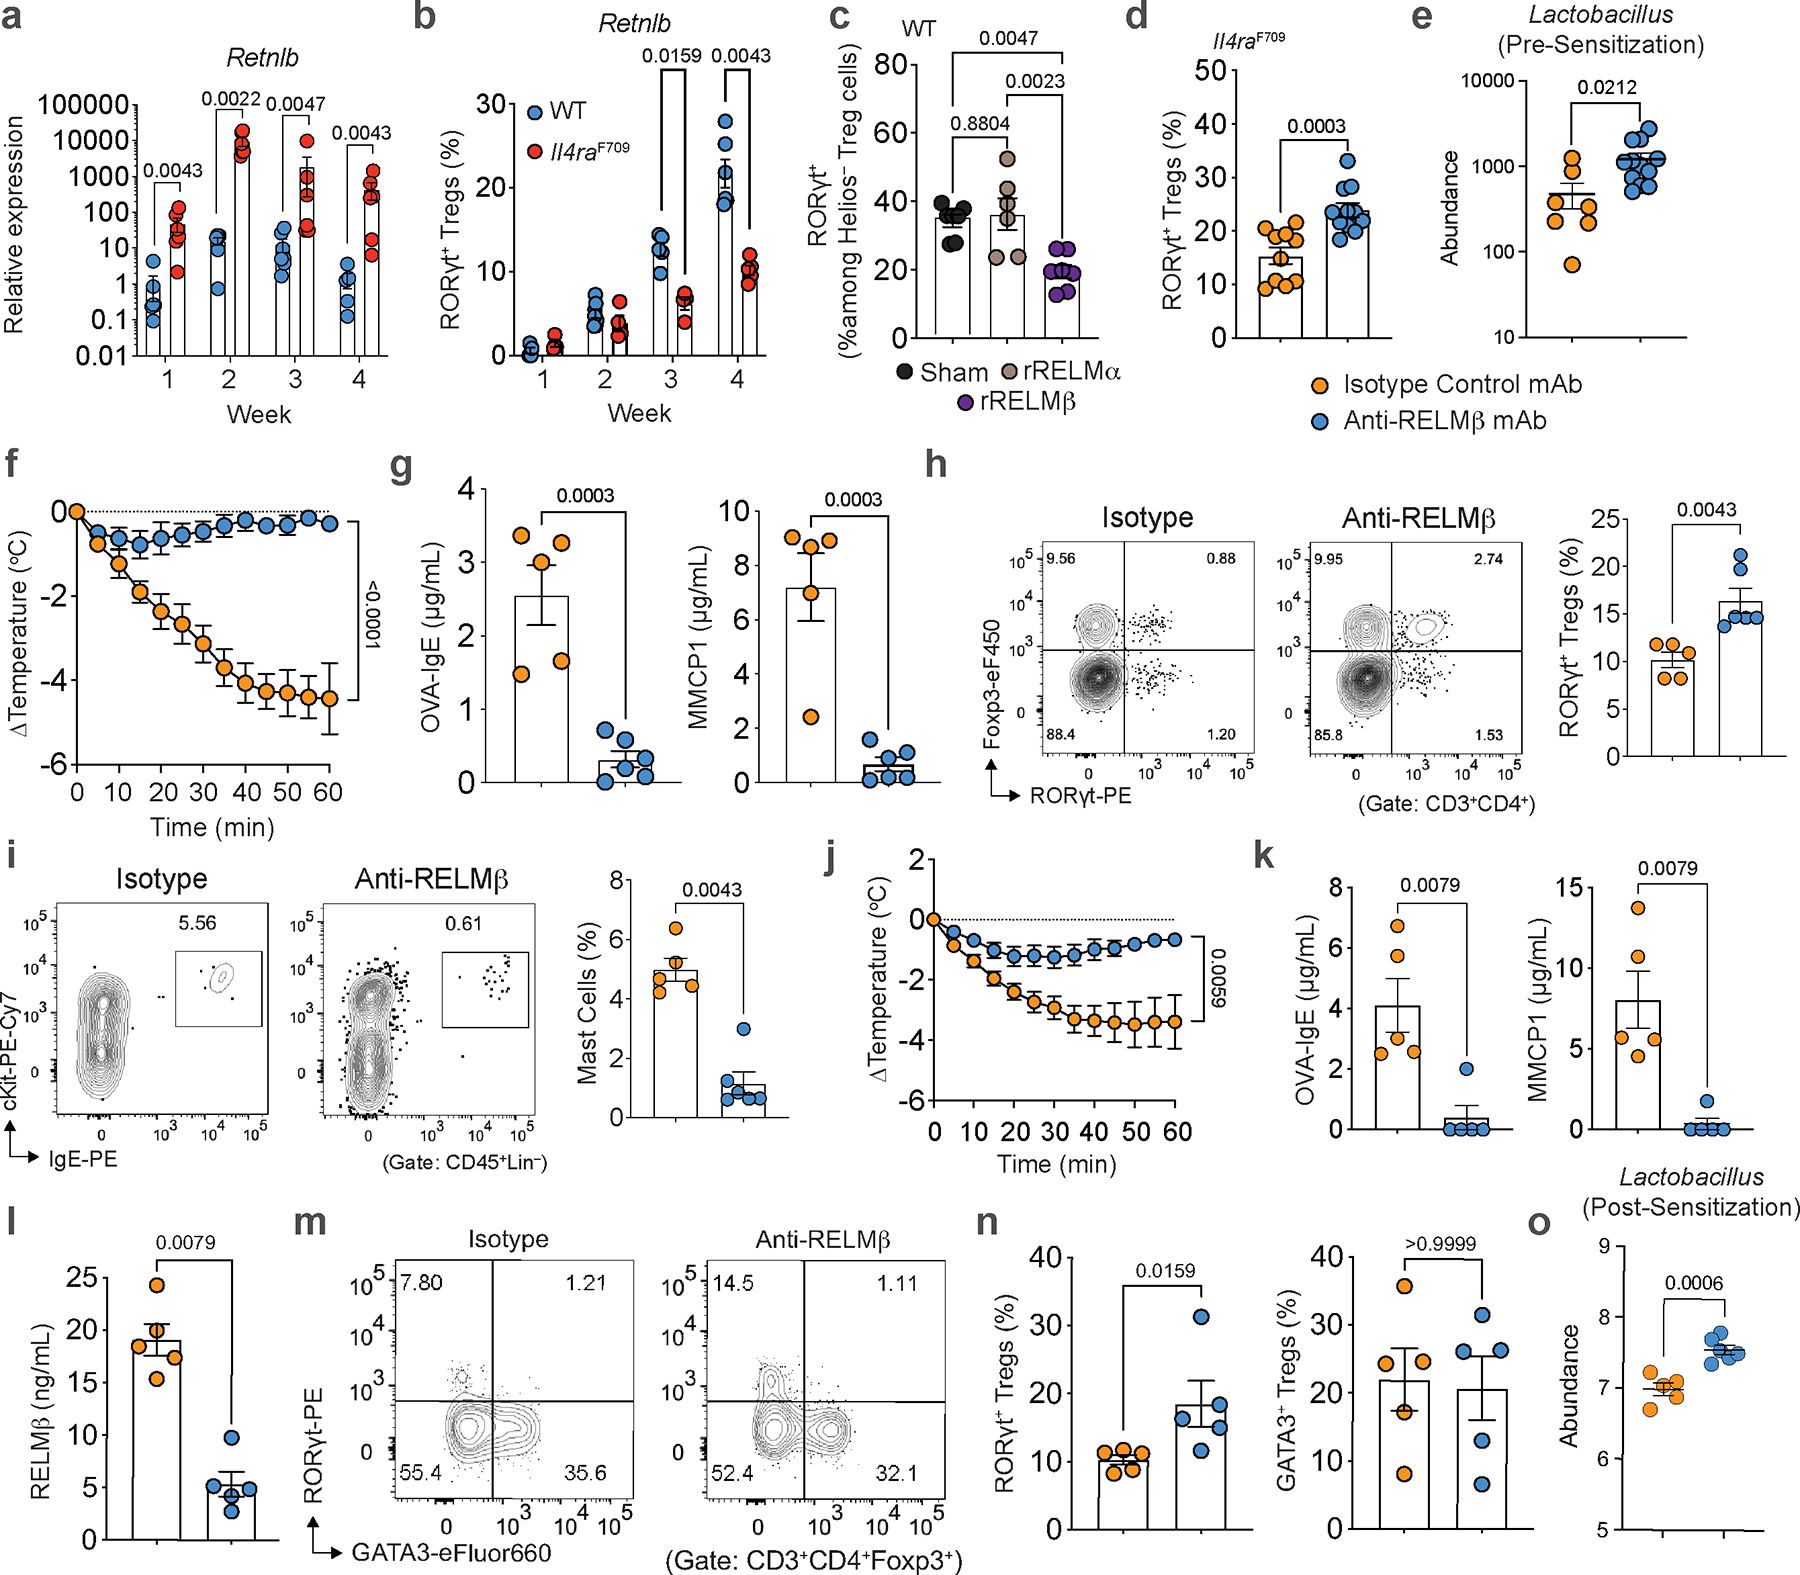
Tolerance to dietary antigens is critical for avoiding deleterious type 2 immune responses resulting in food allergy (FA) and anaphylaxis1,2. However, the mechanisms resulting in both the maintenance and failure of tolerance to food antigens are poorly understood. Here we demonstrate that the goblet-cell-derived resistin-like molecule β (RELMβ)3,4 is a critical regulator of oral tolerance. RELMβ is abundant in the sera of both patients with FA and mouse models of FA. Deletion of RELMβ protects mice from FA and the development of food-antigen-specific IgE and anaphylaxis. RELMβ disrupts food tolerance through the modulation of the gut microbiome and depletion of indole-metabolite-producing Lactobacilli and Alistipes. Tolerance is maintained by the local production of indole derivatives driving FA protective RORγt+ regulatory T (Treg) cells5 through activation of the aryl hydrocarbon receptor. RELMβ antagonism in the peri-weaning period restores oral tolerance and protects genetically prone offspring from developing FA later in life. Together, we show that RELMβ mediates a gut immune-epithelial circuit regulating tolerance to food antigens-a novel mode of innate control of adaptive immunity through microbiome editing-and identify targetable candidates in this circuit for prevention and treatment of FA.


Conflict of interest statement

Competing interests: T.A.C., E.C., E.S.-V. and A.A.-G. have a pending patent application related to methods or compositions for treating or preventing allergy or anaphylaxis (US17/801,238). T.A.C. has a provisional patent application related to RELMβ regulation of oral tolerance (US 63/722,176). G.A.K. has financial interests in Hasana Biosciences and Matoi Therapeutics. The other authors declare no competing interests.

Figures

Extended Data Fig. 1 |
Extended Data Fig. 1 |. RELMβ directs the gut epithelial AMP response in synergy with IL-13.
a, Heat-map of gene transcripts of SI epithelial cells isolated from OVA-SEB sensitized WT, Il4raF709, and Il4raF709Retnlb−/− mice (n=3/group). b, Relative expression of Retnlb, Sprr2a, Reg3a and Reg3b transcripts in SI tissue of WT, FA-prone Il4raF709, and FA-resistant Il4raF709Retnlb−/− mice (n=4/group). c, Relative expression of host AMP transcripts (Sprr2a, Reg3a, Reg3b) from qPCR analysis of small intestinal epithelial cells from mice treated with recombinant RELMβ (n=4) or vehicle (n=3). d, Relative expression of Retnlb in organoids derived from Il4raF709 mice or Il4raF709VilCreRetnlbΔ/Δ mice treated with media, rRELMβ, IL-13, and rRELMβ + IL-13 (n=6 or 8/condition). e, Relative expression of Sprr2a in organoids derived from Il4raF709 mice or Il4raF709VilCreRetnlbΔ/Δ mice treated with media, rRELMβ, IL-13, and rRELMβ + IL-13 (n=6 or 8/condition). f, Immunofluorescent microscopic imaging of organoids derived from WT mice treated with media, rRELMβ, IL-13, and rRELMβ + IL-13. g, Immunofluorescent microscopic imaging of organoids derived from Il4raF709 mice treated with media, rRELMβ, IL-13, and rRELMβ + IL-13. h, Immunofluorescent microscopic imaging of organoids derived from Il4raF709VilCreRetnlbΔ/Δ mice treated with media, rRELMβ, IL-13, and rRELMβ + IL-13. Data represent two independent experiments. i, Quantification of RELMβ in organoids derived from WT (n=5,14,12 and 17)., Il4raF709 (n=11,23,21 and 17), or Il4raF709VilCreRetnlbΔ/Δ (n=6,8,7 and 9) mice treated with media, rRELMβ, IL-13, and rRELMβ + IL-13. j, Relative expression of RETNLB in organoids derived from healthy humans treated with media, human rRELMβ, IL-13, and human rRELMβ + IL-13 (n=10, 9 and 10). k, Relative expression of SPRR2A in organoids derived from healthy humans treated with media, human rRELMβ, IL-13, and human rRELMβ + IL-13 (n=10/group). l, m, Flow cytometric analysis and frequency of Tconv cells (l) or Treg (m) IL-4+ and IL-13+ CD4+ T cell populations from SI-LPL of Il4raF709Retnlb−/− and Il4raF709 mice. For a–e,i–k, data are mean ± s.e.m. Statistical analysis was performed using unpaired two-tailed t-tests (c), one-way ANOVA (d,e,i) with Tukey’s (i), Šídák’s (d,e), or Dunn’s (j,k) post hoc tests, or repeat measure two-way ANOVA (b) with Tukey’s (b) post hoc test.
Extended Data Fig. 2 |
Extended Data Fig. 2 |. Retnlb promotes the generation of high affinity anaphylactic IgE.
a, Differential extravasation of Evan’s blue dye into the earlobes of naïve BALB/c mice that received serum from FA-prone, OVA-SEB sensitized Il4raF709 or FA-protected Il4raF709Retnlb−/− and were then challenged with OVA. b, Quantification of high- versus low-affinity IgE from Il4raF709 (n=5) or Il4raF709Retnlb−/− (n=4) mice immunized with house dust mite extract plus OVA, or Il4raF709 mice treated with vehicle (n=3). c, d, Flow cytometric analysis (c) and cell frequencies of small intestinal IL-4+ and IL-4+IL-13+ cells among Tfh cells from Il4raF709 and Il4raF709Retnlb−/− mice (n=3 and 5) (d). e, f, Flow cytometric analysis (e) and cell frequencies of small intestinal IL-4+ and IL-4+IL-13+ cells among Tfr cells from Il4raF709 and Il4raF709Retnlb−/− mice (n=3 and 5) (f). For a–f, data are mean ± s.e.m. Statistical analysis was performed using unpaired two-tailed t-tests (d,f) or repeat measure two-way ANOVA (b) with Šídák’s (b) post hoc test.
Extended Data Fig. 3 |
Extended Data Fig. 3 |. Retnlb-deficient mice are protected from FA in an epicutaneous model.
a, Core body temperature changes in WT mice epicutaneously sensitized with either PBS (n=5) or OVA (n=9) and Retnlb−/− (n=9) mice epicutaneously sensitized with OVA. b, Serum OVA-IgE concentrations, MMCP1 concentrations (n=5,9 and 7). c, Serum RELMβ concentrations (n=11,14 and 10). d, Flow cytometric analysis and frequencies of small intestinal RORγt+ Treg cells (n=5,8 and 7) or GATA3+ Treg cells (n=5,9 and 7). e, Abundance of small intestinal Lactobacilli in mice from (a) (n=6,9 and 8). f, Quantity of small intestinal indole-3-acetic acid (IAA) (n=6, 8 and 10). For a–f, data are mean ± s.e.m. Statistical analysis was performed using unpaired one-way ANOVA (b–f) with Tukey’s (b-d), Dunnett’s (e), and Dunn’s (f) post hoc tests, or repeat measure two-way ANOVA (a) with Tukey’s (a) post hoc test.
Extended Data Fig. 4 |
Extended Data Fig. 4 |. Intestinal epithelial cell derived RELMβ is essential for loss of tolerance in FA.
a, Relative expression of Retnlb from qPCR analysis of small intestinal tissue from Il4raF709Retnlbfl/fl (n=4), Il4raF709VilCreRetnlbΔ/+ (n=5) and Il4raF709VilCreRetnlbΔ/Δ (n=3) mice. b, Serum levels of RELMβ in sham (PBS)-sensitized WT, Il4raF709, Il4raF709VilCreRetnlbΔ/Δ mice (n=5, 9, 3) or OVA-SEB sensitized WT, Il4raF709, Il4raF709VilCreRetnlbΔ/Δ and Il4raF709Retnlbfl/fl mice (n=4, 8, 8 and 10), as determined by ELISA. c, Core body temperature changes in OVA-SEB sensitized and challenged Il4raF709Retnlbfl/fl (n=7), Il4raF709VilCreRetnlbΔ/+ (n=5) and Il4raF709VilCreRetnlbΔ/Δ mice (n=5). d, Serum OVA-specific IgE concentrations and MMCP1 concentrations (n=8 and 10). e, Relative expression of host AMP transcripts (Sprr2a, Reg3a, Reg3b) from qPCR analysis of small intestinal tissue from Il4raF709Retnlbfl/fl (n=4), Il4raF709VilCreRetnlbΔ/+ (n=5) and Il4raF709VilCreRetnlbΔ/Δ (n=3) mice. f, g, Flow cytometric analysis (f, g) and frequencies of HeliosRORγt+ (f) or Helios+GATA3+ Treg cells (g) from SI-LPL or MLN (n= 8 and 10). h, Core body temperature changes in OVA-SEB sensitized and OVA-challenged Il4raF709Math1Cre and Il4raF709Math1CreRetnlbΔ/Δ mice (n=5/group). i, Serum OVA-specific IgE concentrations and MMCP1 concentrations of mice in (n=5/group) (h). j, k, Flow cytometric analysis and frequencies of small intestinal HeliosRORγt+ Treg cells (j) or Helios+GATA3+ (k) of mice in (h) (n=5/group). For a-k, data are mean ± s.e.m. Statistical analysis was performed using unpaired two-tailed t-tests (a,d–g,i–k), one-way ANOVA with Šídák’s (b), or repeat measure two-way ANOVA (c,h) with Šídák’s (c,h) post hoc tests.
Extended Data Fig. 5 |
Extended Data Fig. 5 |. Goblet cell derived RELMβ is required for loss of tolerance in FA.
a,b, Flow cytometric analysis and frequencies of CLIP103–117I-Ab in Il4raF709Retnlbfl/fl (n=4) or OVA323–339I-Ab tetramer staining in Il4raF709Retnlbfl/fl OVA-SEB-sensitized mice (n=9) vs. Il4raF709Math1CreRetnlbΔ/Δ OVA-SEB-sensitized mice (n=9) in MLN CD4+Foxp3+ Treg cells (a), and the respective frequencies in SI-LPL CD4+Foxp3+ Treg cells (n=3, 9 and 9) (b). c,d, Flow cytometric analysis and frequencies of CLIP103–117I-Ab in Il4raF709Retnlbfl/fl (n=4) or OVA323–339I-Ab tetramer staining in Il4raF709Retnlbfl/fl OVA-SEB-sensitized mice (n=7) vs. Il4raF709Math1CreRetnlbΔ/Δ OVA-SEB-sensitized mice (n=9) in MLN Foxp3+RORγt+ Treg cells (c) and the respective frequencies in SI-LPL Foxp3+RORγt+ Treg cells (n=3, 8 and 9) (d). e,f, Flow cytometric analysis and frequencies of CLIP103–117I-Ab in Il4raF709Retnlbfl/fl (n=4) or OVA323–339I-Ab tetramer staining in Il4raF709Retnlbfl/fl (n=9) vs. Il4raF709Math1CreRetnlbΔ/Δ (n=9) in MLN CD4+Foxp3Tconv cells (e) and the respective frequencies in SI-LPL CD4+Foxp3Tconv cells (n=3, 9 and 9) (f). g, Antimicrobial activity of PBS, rSPRR2A, or rRELMβ on mouse L. murinus and mouse L. reuteri (n=3/condition). h, Core body temperature changes in OVA-SEB sensitized and OVA-challenged Il4raF709 and Il4raF709Sprr2a−/− mice (n=10/group). i, Serum OVA-specific IgE concentrations and MMCP1 concentrations of mice in (e) (n=10/group). j, Relative fold abundance of Lactobacilli in Il4raF709 and Il4raF709Sprr2a−/− mice post OVA-SEB sensitization and OVA-challenge (normalized against Lactobacilli in Il4raF709 mice at baseline) (n=9/group). k, Flow cytometric analysis and frequency of MLN RORγt+ Treg cells of mice in (h) (n=10/group). For a–k, data are mean ± s.e.m. Statistical analysis was performed using unpaired two-tailed t-tests (a-f; i–k), one-way ANOVA with Tukey (g), or repeat measure two-way ANOVA with Šídák’s (h) post hoc test.
Extended Data Fig. 6 |
Extended Data Fig. 6 |. Microbiome-derived indole derivatives are associated with protection from food allergy.
a, Putative enteric tryptophan catabolic pathway(s) and primary Lactobacillus tryptophan catabolic pathway highlighted in blue. b, Quantities of gut bacterial- and host-derived indole derivatives including indole-lactic acid (ILA), indole-3-propionic acid (IPA), indole, tryptamine, indoxyl-3-sulfate (I3S), indole-3-pyruvic acid (I3Py), indole-3-acetamide (IAM), skatole (3MI) in stool of OVA-SEB sensitized Il4raF709 (n=16) vs. Il4raF709Retnlb−/− (n=17) mice. c, Quantities of gut bacterial- and host-derived indole derivatives including indole-lactic acid (ILA), indole-3-propionic acid (IPA), indole, tryptamine, indoxyl-3-sulfate (I3S), indole-3-pyruvic acid (I3Py), indole-3-acetamide (IAM), skatole (3MI) in stool of control patients (n=14) or patients with food allergy (n=8 or 9). d, Core body temperature changes in OVA-SEB sensitized and OVA-challenged Il4raF709 mice treated with vehicle (n=9) or indole-3-acetic acid (IAA) (n=10). e, Serum OVA-specific IgE concentrations and MMCP1 concentrations in both groups (n=9 and 10) (d). f, Flow cytometric analysis and frequencies of small intestinal RORγt+ and GATA3+ Treg cells (d) (n=9/group). For b–f, data are mean ± s.e.m. Statistical analysis was performed using unpaired two-tailed t-tests (b,c,e,f) or repeat measure two-way ANOVA (d) with Šídák’s (d) post-hoc test.
Extended Data Fig. 7 |
Extended Data Fig. 7 |. Genetic manipulation of tryptophan catabolism in L. reuteri.
a, Genomic structure of the aromatic amino acid aminotransferase gene Lreu23DRAFT_4905 of L. reuteri 100–23 WT, the targeting vector (pGAK0001) containing the ddL-F258Y counter-selection system, and the resulting mutant (L. reuteri 100–23 ΔaraT) generated by homologous recombination. b, PCR analysis of genomic DNA from L. reuteri 100–23 WT and L. reuteri 100–23 ΔaraT using one pair of primers flanking the targeted deletion region and another pair of primers internal to the targeted deletion region. Data represent at least two independent gene deletion confirmations. c, relative colonization of L. reuteri WT and L. reuteri ΔaraT in Il4raF709 BALB/c mice before colonization and at days 1 and 10 post gavage (n=3/group). d, Relative colonization of L. reuteri WT and L. reuteri ΔaraT in Il4raF709 BALB/c mice before colonization (n=5/group) and after OVA-SEB sensitization and challenge (n=4/group). e, Quantity of small intestinal indole-3-acetic acid (IAA) in mice treated with vehicle (n=3) or colonized with L. reuteri WT (n=4) or L. reuteri ΔaraT (n=5) post OVA-SEB sensitization and challenge. f, Flow cytometric analysis of RORγt+ Treg cells from naïve WT T cells or naïve AhRΔ/Δ T cells stimulated with a positive differentiation cocktail (anti-CD3, anti-CD28, IL-2, TGF-β1, IL-6), negative differential cocktail (positive control minus IL-6), or negative differentiation cocktail supplemented with the indicated indole derivatives. For c-e, data are mean ± s.e.m. Statistical analysis was performed using one-way ANOVA (c-e) with Šídák’s post hoc test (c-e).
Extended Data Fig. 8 |
Extended Data Fig. 8 |. Indole production by immunomodulatory human bacteria protects against FA.
a, OTU-level comparison of gut microbiota in control patients (n=10) versus food allergy patients (n=18). b, Serum RELMβ concentrations in control patients (n=10) versus food allergy patients (n=18). c, Indole production by wild-type B. ovatus, B. ovatus ΔtnaA, A. shahii all versus mock (media) (n=3/condition). d, Antimicrobial activity of mock (experimental media), rSPRR2A, or rRELMβ on A. shahii and B. ovatus (n=3/condition). e, Core body temperature changes in OVA-SEB sensitized and OVA-challenged WT mice treated with vehicle, B. ovatus WT, and B. ovatus ΔtnaA (n=10, 15 and 13). f, Serum OVA-IgE concentrations and MMCP1 concentrations (n=10, 15 and 13). g, Flow cytometric analysis and frequencies of small intestinal RORγt+ Treg cells (n=10, 15 and 13). h, Flow cytometric frequency of mast cells (n=5,10 and 8). i, j, Flow cytometric analysis and cell frequencies of small intestinal Tfh13 cells (i) and IL-4+ CD4+ small intestinal T cells (j) (n=4,5 and 3). k, Relative colonization of B. ovatus WT and B. ovatus ΔtnaA in WT BALB/c mice before colonization and at day 7 post gavage (n=4,3 and 4/group). For b-k, data are mean ± s.e.m. Statistical analysis was performed using linear discriminant analysis effect size (LEfSe) with an alpha level of 0.1 and a logarithmic LDA score of 0.5 (a), unpaired two-tailed t-test (b), one-way ANOVA with Tukey’s (d,f-k) post hoc test, or repeat measure two-way ANOVA (e) with Šídák’s (e) post hoc test.
Extended Data Fig. 9 |
Extended Data Fig. 9 |. Parental microbiome transmission protects against FA development.
a, Core body temperature changes in Il4raF709 mice (n=8), Il4raF709 mice derived from Il4raF709Retnlb−/+ × Il4raF709Retnlb−/+ cross (n=11), or Il4raF709Retnlb−/− mice derived from Il4raF709Retnlb−/+ × Il4raF709Retnlb−/+ cross (n=8) sensitized with OVA-SEB and challenged with OVA. b, Lactobacillus genus abundance in OVA-SEB sensitized mouse groups represented in (a): Il4raF709 mice (n=14, same mice as in Fig. 3a), Il4raF709 mice derived from Il4raF709Retnlb−/+ × Il4raF709Retnlb−/+ cross (n=22), or Il4raF709Retnlb−/− mice derived from Il4raF709Retnlb−/+ × Il4raF709Retnlb−/+ cross (n=10). c, Serum total IgE concentrations (n=5,7 and 6), OVA-specific IgE concentrations (n=5,7 and 6), and MMCP1 concentrations (n=5,7 and 5). d, e, Flow cytometric analysis (d) and frequency of small intestinal RORγt+ Treg cells (e) (n=5,9 and 7). f, Serum concentration of RELMβ (ng/mL) (n=6,7 and 6). For a–f, data are mean ± s.e.m. Statistical analysis was performed using one-way ANOVA (b,c,e,f) with Tukey’s (b,c,e,f) post hoc test, or repeat measure two-way ANOVA (a) with Tukey’s (a) post hoc test.
Extended Data Fig. 10 |
Extended Data Fig. 10 |. Therapeutic antagonism of RELMβ in adulthood suppresses FA.
a, Core body temperature changes in OVA-SEB sensitized and OVA-challenged WT mice treated with vehicle (n=12) or rRELMβ (n=15). b, Serum total IgE, OVA-specific IgE concentrations and MMCP1 concentrations in both groups (n=12 and 15) c, Flow cytometric analysis (c) mast cell count numbers and flow cytometric analysis of cell frequencies of C-kit+IgE+ small intestinal mast cells (c) in mice shown in (a) (n=9/group). d, Serum total IgE and e, f, Flow cytometric analysis cell frequencies of small intestinal IL-4+ and IL-4+IL-13+ Tfh cells (e) and cell frequencies of small intestinal IL-4+ and IL-4+IL-13+ Tconv cells in mice (f) from (Main Fig. 5j) (n=5/group). For a–f, data are mean ± s.e.m. Statistical analysis was performed using unpaired two-tailed t-tests (b–f) or repeat measure two-way ANOVA (a) with Šídák’s (a) post hoc test.
Fig. 1 |
Fig. 1 |. Critical role of RELMβ in FA induction.
a, qPCR analysis of Retnlb and Retnla transcripts (relative expression over baseline) in jejunal tissues of WT and FA-prone Il4raF709 mice that were either sham sensitized (PBS) (n=5,5,6 and 6) or sensitized with OVA-SEB (n=6,5,7 and 5) then challenged with OVA. b, Serum levels of RELMβ in PBS or OVA-SEB sensitized WT (n=10) and Il4raF709 (n=10) mice, as determined by ELISA. c, levels of RELMβ in human serum from healthy control subjects (n=44) and, asthma (n=34), atopic dermatitis (AD) (n=12), food allergy and asthma (FAA) (n=52), or food allergy (FA) (n=67) patients. d, Core body temperature changes in WT, Il4raF709 and Il4raF709Retnlb−/− mice that were sensitized with OVA-SEB and then challenged with OVA (n=7,12 and 11). e, OVA-specific serum IgE concentrations (n=12,24 and 24). and serum MMCP1 concentrations post-challenge (n=19,13 and 19). f, Jejunal mast cells frequencies post-challenge (n=5,5 and 6). g, Log-log plot of SI epithelial cell RNA-seq analysis comparing Il4raF709 versus Il4raF709Retnlb−/− (X-axis) and Il4raF709 versus WT mice (Y-axis) (n=3/group). h, i, j, k, qPCR analysis of Retnlb and Sprr2a transcripts in intestinal organoids derived from WT (h,i) and Il4raF709 (j,k) mice that were treated with sham (media), recombinant RELMβ (rRELMβ), recombinant SPRR2A (rSPRR2A), or rRELMβ plus anti-RELMβ mAb without (WT:12,15, 6, 6; Il4raF709:15, 23, 9 and 10, 7) or with IL-13 (WT:10,13,9,6; Il4raF709:18,15,10,4). l, m, Flow cytometric frequency of Tconv cells (l) or Treg (m) IL-4+ and IL-13+ CD4+ T cell populations from SI-LPL of WT (n=4), Il4raF709 (n=4) and Il4raF709Retnlb−/− (n=5) mice. For a–m, data are mean ± s.e.m. Statistical analysis was performed using one-way ANOVA (a-c,e,f,h-m) with Šídák’s (a-b), Tukey’s (c,e,f,l,m), or Dunnett’s (h-k) post hoc tests, or repeat measure two-way ANOVA (d) with Tukey’s (d) post hoc test.
Fig. 2 |
Fig. 2 |. RELMβ suppresses FA-protective RORγt+ Treg cells.
a, b, Flow cytometric analysis of SI-LPL RORγt+ Treg cells in OVA-SEB sensitized WT, Il4raF709 and Il4raF709Retnlb−/− mice (a) and frequencies of SI-LPL CD4+Foxp3+RORγt+ Treg cells in each respective mouse strain (n=5,14 and 9) (b). c, Core body temperature changes in Il4raF709Foxp3YFPCre (n=18), Il4raF709Retnlb−/−Foxp3YFPCre (n=17), and Il4raF709Retnlb−/−Foxp3YFPCreRorcΔ/Δ (n=13), that were sensitized with OVA-SEB and then challenged with OVA. d, OVA-specific serum IgE concentrations (n=5, 6 and 9) and serum MMCP1 concentrations (n=5, 5 and 9). e, Jejunal mast cells frequencies (n=5, 5 and 9). f, SI-LPL RORγt+ Treg cell frequencies (n=5,6 and 9). g, Core body temperature changes in germ-free Il4raF709 that received shame (PBS) (n=10), fecal microbiome transplant (FMT) from WT mice (n=4), Il4raF709 mice (n=7), or Il4raF709Retnlb−/− (n=7) mice then sensitized with OVA-SEB and challenged with OVA. h, i, Serum OVA-specific IgE concentrations, (h) (n=10,7,6 and 7), serum MMCP1 concentrations, (h) (n=10,7,7 and 7) and serum RELMβ concentrations, (i) (n=10,7,7 and 7). j, Frequencies of SI-LPL RORγt+ Treg cells in each respective mouse strain (n=10,9,6 and 10). For b–j, data are mean ± s.e.m. Statistical analysis was performed using one-way ANOVA (b,d,e,f,h,i,j) with Tukey’s (b,d,e,f,h,i,j) post hoc test, or repeat measure two-way ANOVA (c,g) with Tukey’s (c,g) post hoc test.
Fig. 3 |
Fig. 3 |. RELMβ deficiency structures a tolerogenic gut microbiome.
a, Eight most abundant gut bacterial genera enriched in OVA-SEB sensitized Il4raF709Retnlb−/− (n=15) versus Il4raF709 (n=14) mice (BALB/c background). b, Lactobacillus genus abundance in OVA-SEB sensitized and challenged Il4raF709Retnlbfl/fl (n=7) and Il4raF709VilCreRetnlbΔ/Δ (n=7) mice (C57BL/6 background). c, Protection of Il4raF709 mice from FA upon bacteriotherapy with mouse Lactobacillus species found enriched in Il4raF709Retnlb−/− mice (L. reuteri and L. murinus) or human Lactobacillus species.(L. gasseri, L.reuteri and L. rhamnosus). The mice were sensitized weekly with OVA-SEB without or with the respective bacteriotherapy, then challenged orally with OVA (n=7, 10 and 9). d, OVA-specific serum IgE concentrations and serum MMCP1 concentrations in bacteriotherapy- or sham-treated mice (n=7, 10 and 9). e, f, Flow cytometric analysis and cell frequencies of C-kit+IgE+ small intestinal mast cells (n=7, 10 and 9) (e) and small intestinal RORγt+ Treg cells (n=7, 10 and 9) (f) in mice shown in (c). g, h, Flow cytometric analysis and cell frequencies of small intestinal Tfh13 cells (g) and IL-4+ and IL-4+IL-13+ CD4+ small intestinal T cells (h) (n=7, 10 and 9). For a–h, data are mean ± s.e.m. Statistical analysis was performed using unpaired two-tailed t-tests (a,b), one-way ANOVA (d–h) with Tukey’s (d–h) post hoc test, or repeat measure two-way ANOVA (c) with Tukey’s (c) post hoc test.
Fig. 4 |
Fig. 4 |. Gut microbiome-derived indole derivatives induce FA protective Treg cells via AhR.
a, Quantitation of indole-3-carboxaldehyde (I3A), indole-3-acetic acid (IAA), indole-3-ethanol (I3E) acid in feces of OVA-SEB sensitized Il4raF709 (n=16, 15 and 16) vs. OVA-SEB sensitized Il4raF709Retnlb−/− (n=17, 17 and 17) mice. b, Quantitation of indole-3-carboxaldehyde (I3A), indole-3-acetic acid (IAA), indole-3-ethanol (I3E) acid in the stools of active FA patients (n=14) vs. control subjects (n=9). c, Temperature changes in Il4raF709Retnlb−/− mice fed a tryptophan-regular (n=9) or low diet (n=8), then sensitized with OVA-SEB and challenged with OVA. d, e, f, Serum OVA-specific IgE (n=9 and 8) (d) and MMCP1 concentrations (n=9 and 8) (e) and SI-LPL RORγt+ Treg cell frequencies (n=9 and 8) (f). g, Temperature changes in sham- (n=7), wild-type L. reuteri 100–23-(n=9), or L. reuteri 100–23 ΔaraT-treated Il4raF709(n=4) treated mice. h, i, Serum OVA-specific IgE (h) and MMCP1 concentrations (h) (n=7,4 and 4), and SI-LPL RORγt+ Treg cell frequencies (i) (n=6,4 and 4). j, Frequencies of RORγt+ Treg cells differentiated from naïve Il4raF709Foxp3YFPCre or Il4raF709Foxp3YFPCreAhRΔ/Δ T cells treated with anti-CD3, anti-CD28, IL-2, TGF-β either alone [negative control (NC) (n=8)], or together with IL-6 (n=9), or with IAA (n=9 and 8), I3A (n=9 and 10), and ILA (n=10 and 10). k, Temperature changes in sham-(n=10) or mouse Lactobacillus-treated Il4raF709 mice (n=13), versus sham-(n=7) or mouse Lactobacillus-treated Il4raF709Foxp3YFPCreAhRΔ/Δ mice (n=16), all sensitized with OVA-SEB and challenged with OVA. l, m, Serum OVA-specific IgE (n=10, 13, 7 and 16) and MMCP1 concentrations (n=10, 13, 7 and 16) (l), and SI-LPL RORγt+ Treg cell frequencies (n=10,13,7 and 15) (m). n, Temperature changes in OVA-SEB sensitized and OVA-challenged Il4raF709Foxp3YFPCre (n=4), Il4raF709Foxp3YFPCreRetnlb−/− (n=4), or Il4raF709Foxp3YFPCreAhRΔ/ΔRetnlb−/− (n=5) mice. o, p, Serum OVA-specific IgE (n=4, 4 and 5) and MMCP1 concentrations (n=4, 4 and 5) (o), and SI-LPL RORγt+ Treg cell frequencies (n=4, 4 and 5) (p). For a-p, data are mean ± s.e.m. Statistical analysis was performed using unpaired two-tailed t-tests (a,b,d-f), one-way ANOVA (h-j,l,m,o,p) with Šídák’s (j) or Tukey’s post hoc test (h,i,l,m,o,p), or repeat measure two-way ANOVA (c,g,k,n) with Tukey’s (c,g,k,n) post hoc test.
Fig. 5 |
Fig. 5 |. Suppression of RELMβ in early life prevents future development of FA.
a, qPCR analysis of Retnlb transcripts in SI tissues of WT versus FA-prone Il4raF709 mice during the first four weeks of life (WT: 6,6,7 and 5; Il4raF709: 6). b, SI-LPL RORγt+ Treg cell frequencies of WT versus FA-prone Il4raF709 mice during the first four weeks of life (WT: 3,7,5 and 5; Il4raF709: 4 or 5). c, SI-LPL RORγt+ Treg cell frequencies in WT mice treated with RELMβ (n=7), RELMα (n=6), or vehicle (n=6) in early life (wk2 to wk4). d, SI-LPL RORγt+ Treg cell frequencies in Il4raF709 mice treated with anti-RELMβ (n=12) or isotype control mAb (n=10) from wk2 to wk4 of life (every other day). e, Lactobacillus genus abundance at wk4 of life in Il4raF709 mice treated with anti-RELMβ (n=7) or isotype control mAb (n=12) from wk2 to wk4 of life (every other day). f, Core body temperature changes in Il4raF709 mice treated with anti-RELMβ (n=6) or isotype control mAb (n=3) from wk2 to wk4 of life, and OVA-SEB sensitized and then OVA challenged. g, Total serum IgE, OVA-specific IgE, and MMCP1 concentrations in early-life mAb-treated mice (n=5 and 6). h, i, SI-LPL RORγt+ Treg cell (h) and mast cell frequencies (i) of early-life mAb-treated mice (n=5 and 6). j, Temperature changes in Il4raF709 mice treated with anti-RELMβ (n=10) or isotype control mAb (n=12) and concomitantly sensitized with OVA-SEB for eight weeks, and then challenged with OVA. k, OVA-specific IgE and MMCP1 concentrations in mice from (j) (n=5 and 5). l, RELMβ concentrations in mice from (j) (n=5 and 5). m, n, Flow cytometric analysis (m) and cell frequencies of SI-LPL RORγt+ Treg cells or GATA3+ Treg cells (n) in mice from (j) (n=5 and 5). o, Lactobacillus genus abundance post challenge in Il4raF709 mice treated with anti-RELMβ or isotype control mAb (n=5 and 6). For a–o, data are mean ± s.e.m. Statistical analysis: mixed-effects two-way ANOVA with Šídák’s post-hoc test (b), unpaired two-tailed t-tests (a,d,e,g–i,k,l,n,o), one-way ANOVA (c) with Tukey’s (c) post hoc test, or repeat-measure two-way ANOVA (f,j) with Šídák’s (f,j) post-hoc test.

Similar articles

Cited by

References

    1. Stephen-Victor E, Crestani E & Chatila TA Dietary and Microbial Determinants in Food Allergy. Immunity 53, 277–289, doi: 10.1016/j.immuni.2020.07.025 (2020). - DOI - PMC - PubMed
    1. Florsheim EB, Sullivan ZA, Khoury-Hanold W & Medzhitov R Food allergy as a biological food quality control system. Cell 184, 1440–1454, doi: 10.1016/j.cell.2020.12.007 (2021). - DOI - PubMed
    1. Artis D et al. RELMbeta/FIZZ2 is a goblet cell-specific immune-effector molecule in the gastrointestinal tract. Proc Natl Acad Sci U S A 101, 13596–13600, doi: 10.1073/pnas.0404034101 (2004). - DOI - PMC - PubMed
    1. Herbert DR et al. Intestinal epithelial cell secretion of RELM-beta protects against gastrointestinal worm infection. J Exp Med 206, 2947–2957, doi: 10.1084/jem.20091268 (2009). - DOI - PMC - PubMed
    1. Abdel-Gadir A et al. Microbiota therapy acts via a regulatory T cell MyD88/RORgammat pathway to suppress food allergy. Nat Med 25, 1164–1174, doi: 10.1038/s41591-019-0461-z (2019). - DOI - PMC - PubMed

MeSH terms

Substances

LinkOut - more resources