. 2025 Feb;638(8050):459-468.
doi: 10.1038/s41586-024-08422-9. Epub 2025 Jan 22.

Regional and institutional trends in assessment for academic promotion

Affiliations

Regional and institutional trends in assessment for academic promotion

B H Lim et al. Nature. 2025 Feb.

Abstract

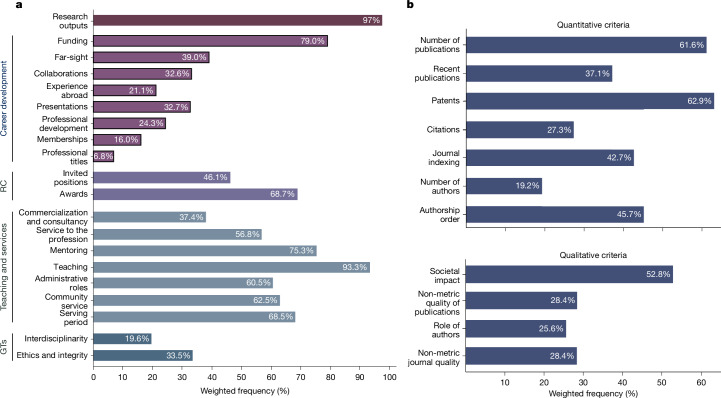
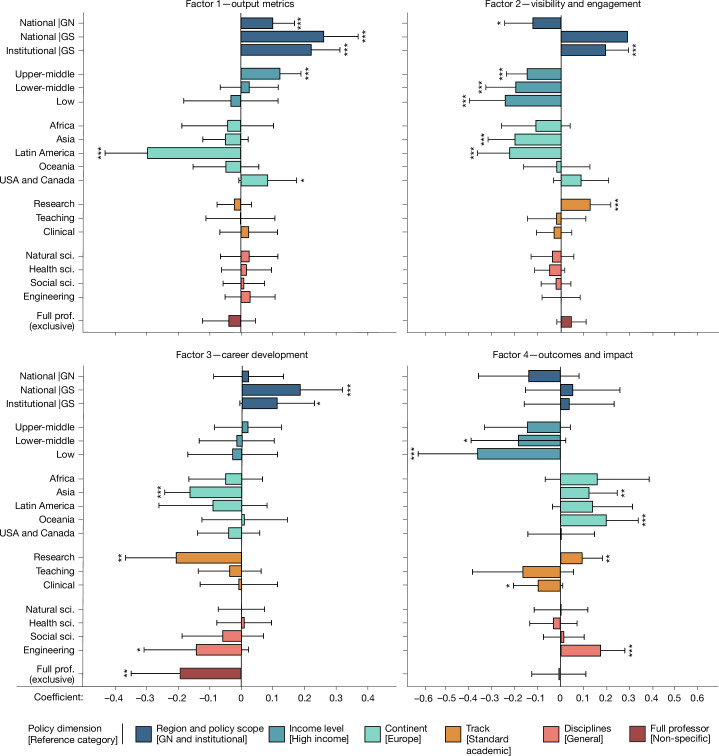
The assessment of research performance is widely seen as a vital tool in upholding the highest standards of quality, with selection and competition believed to drive progress. Academic institutions need to take critical decisions on hiring and promotion, while facing external pressure by also being subject to research assessment1-4. Here we present an outlook on research assessment for career progression with specific focus on promotion to full professorship, based on 314 policies from 190 academic institutions and 218 policies from 58 government agencies, covering 32 countries in the Global North and 89 countries in the Global South. We investigated how frequently various promotion criteria are mentioned and carried out a statistical analysis to infer commonalities and differences across policies. Although quantitative methods of assessment remain popular, in agreement with what is found in more geographically restricted studies5-9, they are not omnipresent. We find differences between the Global North and the Global South as well as between institutional and national policies, but less so between disciplines. A preference for bibliometric indicators is more marked in upper-middle-income countries. Although we see some variation, many promotion policies are based on the assumption of specific career paths that become normative rather than embracing diversity. In turn, this restricts opportunities for researchers. These results challenge current practice and have strategic implications for researchers, research managers and national governments.


Conflict of interest statement

Competing interests: The authors declare no competing interests.

Figures

Fig. 1
Fig. 1. Sample of promotion policies.
Map showing the geographical distribution of the data used for analysis. Blue colour shades (on logarithmic scale) indicate the number of estimated active researchers in each of the 121 countries from which we sourced policies. Other countries and territories are shown in grey. The area of the semicircles is proportional to, respectively, the number of institutions or agencies (yellow) and the number of policies (orange) from a given country. The map is based on geodata openly available at the Natural Earth repository, using the 50-m land polygon GeoJSON dataset (https://www.naturalearthdata.com/). The plot was generated with geopandas and matplolib wedge shape patch, as per the annotated code shared in the Code availability section. The authors do not endorse any position over any disputed area or contested border. The number of researchers was obtained from the UNESCO Institute for Statistics and UNESCO Science Reports (Supplementary Information section 1.7).
Fig. 2
Fig. 2. Trends in research assessment.
a,b, Frequency with which each of the 30 assessment criteria is estimated to affect researchers in the 121 countries surveyed. a shows 19 criteria along with the general category of research outputs, which is expanded into 7 quantitative (top) and 4 qualitative (bottom) measures shown in b (n = 532). RC, recognition; GTs, general traits.
Fig. 3
Fig. 3. Frequencies by policy type and global regions.
a, Spider plots showing the frequency of 30 criteria among institutional (grey) and national (red) policies, grouped into four spider plots according to the class of the criteria: research outputs; career development; teaching and services; and general traits and recognition. b, Bar plots comparing the frequency of qualitative and quantitative criteria for assessing research outputs within national (right) and institutional (left) policies, distinguishing between Global South (green) and Global North (grey). Institutional n = 314 (North, 141; South, 173); national n = 218 (North, 24; South, 194).
Fig. 4
Fig. 4. Factor analysis of the assessment criteria for promotion to professorship.
The heat map shows the factor loadings (a measure of correlation; Methods) of each assessment criterion in the 532 policies on each of the 4 latent factors (factors 1–4) predicted after principal factor analysis and rotated with the oblimin oblique method. ‘Uniqueness’ is the fraction of the variance that a given criterion does not share with others. Blanks denote loading <0.3 in absolute value, and other values are highlighted with a colour scale; all loadings are shown in Supplementary Table 5. We assigned factor interpretation labels to the four factors, to describe the set of criteria they cover.
Fig. 5
Fig. 5. Coefficients of the regression analyses.
Relation between the four predicted factors and policy or country characteristics noted in this study. For the categorical variables, the relation is measured in terms of deviation from a reference category shown in brackets in the figure legend. From top to bottom, categories are: region and policy scope (dark blue), income level (blue), continents (cyan), tracks (orange), disciplines (salmon), and exclusive to full professor (red). Variables with a statistically significant coefficient are indicated; ***P < 0.01, **P < 0.05, *P < 0.1; two-sided t-tests of difference from zero. Exact P values for each variable are provided in Supplementary Table 7. The number of policies within each category can be found in Extended Data Table 1. The length of the bars denotes the size of the coefficient, and the length of the lines denotes the 95% confidence intervals based on robust standard errors. Sample size (n) = 531. The values for each coefficient, their standard errors and statistical significance are reported in Supplementary Table 7. GN, Global North; GS, Global South; sci., science; Prof., professor.
Extended Data Fig. 1
Extended Data Fig. 1. Approach to assessment of research outputs by policy scope.
Application of quantitative vs qualitative criteria for the 314 institutional and 218 national policies in our dataset. Result shown is the percentage of policies mentioning each type of assessment. Number of policies (n) for each criterion is presented above each corresponding bar.
Extended Data Fig. 2
Extended Data Fig. 2. Scree plot for the factor analysis.
Showing the factors obtained, ordered by eigenvalue - denoting the level of variability captured by the factors. In the red box are the Eigenvalues for the four factors used.
Extended Data Fig. 3
Extended Data Fig. 3. Loading plots for each pair of factors.
Each scatter plot in the grid represents a pairwise comparison between factors: Factor 1: Output Metrics, Factor 2: Visibility and Engagement, Factor 3: Career Development, and Factor 4: Outcomes & Impact. Data points are colour-coded to differentiate between quantitative outputs (blue), qualitative outputs (orange), career development criteria (yellow), services (purple), and recognition (red). Ellipses represent the concentration and dispersion of data points associated with each group, indicating the variance and co-relationship strength between factors. Ellipses were overlaid using matplotlib, ellipse function, where the width and height of the ellipse were set to reflect the standard deviation for each group along the X and Y axes, respectively. N = 532.
Extended Data Fig. 4
Extended Data Fig. 4. Single variable comparison between Global North and South.
Violin plots showing median, quartiles, and the distributions of the families of criteria described by the four latent factors resulting from the principal factor analysis. Here, factor strength is the overall impact of the measured factor in explaining the observed data (factor score for each policy). Note: The correlation among criteria, the factor loadings and their variance, the factor scores and their graphical representation through kernel density and boxplots are all based on the weighted sample. N for Global North = 165 and for Global South = 367.

References

    1. Wilsdon, J. et al. The Metric Tide: Report of the Independent Review of the Role of Metrics in Research Assessment and Management (HEFCE, 2015); 10.13140/RG.2.1.4929.1363.
    1. Curry, S., Gadd, E. & Wilsdon, J. Harnessing the Metric Tide: Indicators, Infrastructures & Priorities for UK Responsible Research Assessment – Report of The Metric Tide Revisited Panel (RORI, 2022); 10.6084/m9.figshare.21701624.
    1. Fauzi, M. A., Tan, C. N. L., Daud, M. & Awalludin, M. M. N. University rankings: a review of methodological flaws. Issues Educ. Res.30, 79–96 (2020).
    1. Gadd, E. Mis-measuring our universities: why global university rankings don’t add up. Front. Res. Metr. Anal. 10.3389/frma.2021.680023 (2021). - PMC - PubMed
    1. Parker, J. Comparing research and teaching in university promotion criteria. High. Educ. Q.62, 237–251 (2008).

LinkOut - more resources