. 2025 Feb;638(8051):779-786.
doi: 10.1038/s41586-024-08443-4. Epub 2025 Jan 22.

Multiscale footprints reveal the organization of cis-regulatory elements

Affiliations

Multiscale footprints reveal the organization of cis-regulatory elements

Yan Hu et al. Nature. 2025 Feb.

Abstract

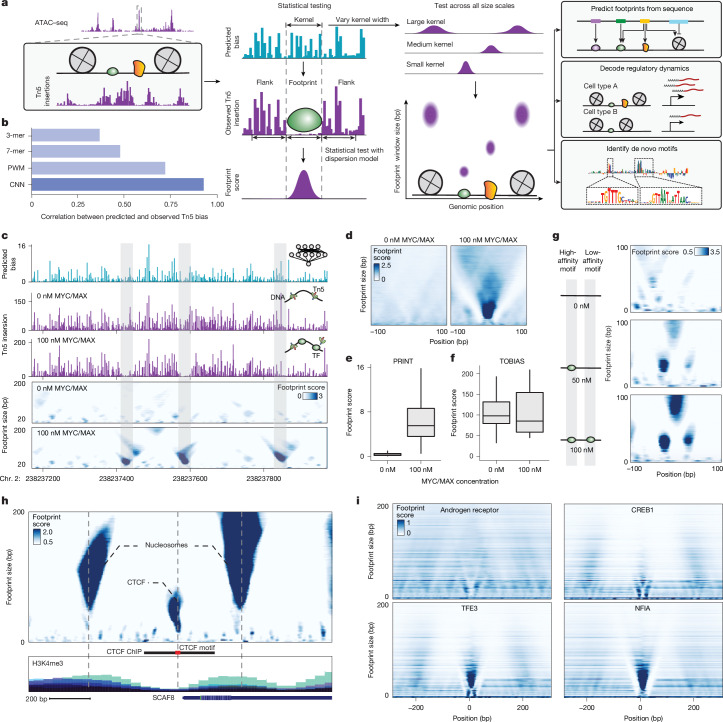
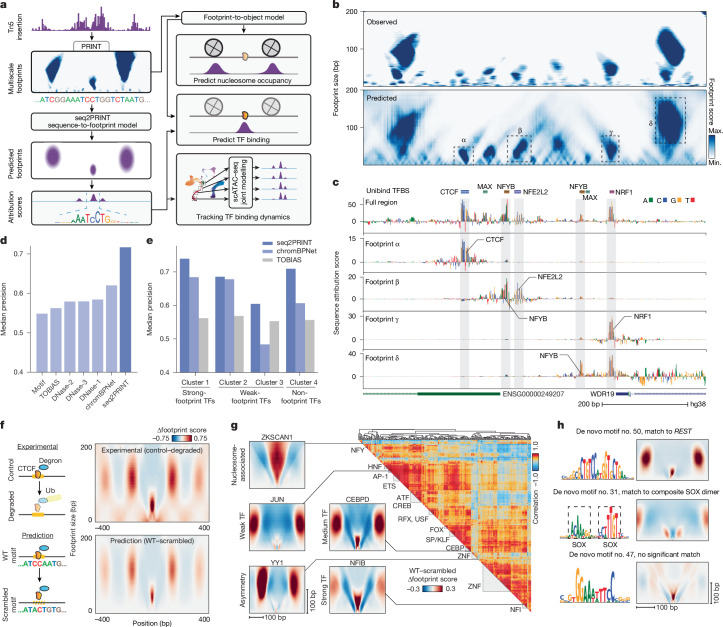
Cis-regulatory elements (CREs) control gene expression and are dynamic in their structure and function, reflecting changes in the composition of diverse effector proteins over time1. However, methods for measuring the organization of effector proteins at CREs across the genome are limited, hampering efforts to connect CRE structure to their function in cell fate and disease. Here we developed PRINT, a computational method that identifies footprints of DNA-protein interactions from bulk and single-cell chromatin accessibility data across multiple scales of protein size. Using these multiscale footprints, we created the seq2PRINT framework, which uses deep learning to allow precise inference of transcription factor and nucleosome binding and interprets regulatory logic at CREs. Applying seq2PRINT to single-cell chromatin accessibility data from human bone marrow, we observe sequential establishment and widening of CREs centred on pioneer factors across haematopoiesis. We further discover age-associated alterations in the structure of CREs in murine haematopoietic stem cells, including widespread reduction of nucleosome footprints and gain of de novo identified Ets composite motifs. Collectively, we establish a method for obtaining rich insights into DNA-binding protein dynamics from chromatin accessibility data, and reveal the architecture of regulatory elements across differentiation and ageing.


Conflict of interest statement

Competing interests: J.D.B. holds patents related to ATAC–seq, is a consultant for the Treehouse Family Foundation, and is a SAB member of Camp4 and seqWell. J.D.B. and S.M. hold a patent based on SHARE–seq. M.A.H. holds patents related to CRISPR-mediated interference and activation, and is a consultant for Akuous, Inc., DEM Biopharma and Gordian Biotechnology. A.J.W. is a scientific advisor for Frequency Therapeutics and Kate Therapeutics, is also a cofounder and scientific advisory board member and holds private equity in Elevian, Inc., a company that aims to develop medicines to restore regenerative capacity. Elevian also provides sponsored research to the Wagers laboratory. The other authors declare no competing interests.

Figures

Fig. 1
Fig. 1. Multiscale footprinting detects DNA–protein interactions across spatial scales.
a, Overview of the multiscale footprinting workflow. b, Bar plot comparing the performance of different Tn5 bias correction models. c, Predicted Tn5 bias, observed Tn5 insertion and multiscale footprints on BAC DNA incubated with either 0 nM (top) or 100 nM (bottom) MYC/MAX at example region chr. 2:238237173–238237972. d, Aggregate multiscale footprints on BAC DNA incubated with either 0 or 100 nM MYC/MAX at MYC/MAX motif sites. e,f, Box plots of footprint score at MYC/MAX motif sites with either 0 or 100 nM MYC/MAX, showing results for PRINT (e, n = 275 positions) and TOBIAS (f, n = 158 positions). Boxes show first, second and third quartiles, whiskers show the furthest point falling within the first quartile − 1.5× interquartile range (IQR) or third quartile + 1.5× IQR. g, Multiscale footprints at two adjacent MYC/MAX motif sites with 0 nM (top), 50 nM (middle) and 100 nM (bottom) MYC/MAX. h, Multiscale footprints in the cCRE region chr. 6:154732971–154733770 in HepG2. Bottom tracks are layered ENCODE histone ChIP signals. i, Aggregate multiscale footprints for example TFs including AR, CREB1, TFE3 and NFIA. CNN, convolutional neural network.
Fig. 2
Fig. 2. Decoding the genomic syntax of cCRE organization.
a, Schematic of footprint-to-object prediction and seq2PRINT models and their applications. b, Observed (top) and predicted multiscale footprints (bottom) in example region chr. 4:39181940–39182739. c, Seq2PRINT sequence attribution scores in the region depicted in b, showing attribution scores calculated with respect to multiscale footprints in the whole region (track 1) or specific footprints (tracks 2–5). d, Bar plot showing median precision of TF binding prediction by different methods. e, Bar plot showing median precision of TF binding prediction by seq2PRINT, ChromBPNet and TOBIAS for different TF clusters, as defined in Extended Data Fig. 2e. f, Left, schematic representation of experimental depletion of degron-tagged CTCF and in silico disruption of CTCF binding sites. Right, observed changes in multiscale footprints at CTCF motif sites following experimental CTCF depletion, and seq2PRINT-predicted multiscale footprint changes following in silico CTCF motif disruption. g, Left, seq2PRINT-predicted changes in multiscale footprints following in silico ablation of motif sites of example TFs. Right, heatmap showing clustering of TFs based on seq2PRINT-predicted changes following in silico motif ablation. h, Representative de novo motifs identified by TF motif discovery from sequence attribution scores (TF-MoDISco) from seq2PRINT-predicted sites, and corresponding predicted changes in multiscale footprints following in silico motif ablation (colour scale as in g). Max., maximum; min., minimum.
Fig. 3
Fig. 3. Emerging intra-cCRE dynamics in human haematopoiesis.
a, Uniform manifold approximation and projection (UMAP) of the human bone marrow SHARE–seq dataset. b, Top, ATAC–seq signal surrounding the highlighted SPI1 promoter region chr. 11:47378111–47378911. Bottom, TF binding scores derived from seq2PRINT in the same SPI1 promoter region across 1,000 pseudo-bulks. Each row represents a pseudo-bulk and each column a single base-pair position. Left-hand colour legend for cell types as in a; right-hand colour legend, accessibility of the promoter region in each pseudo-bulk. c, Percentage of all cCREs with the given complexity of TF binding modes. Individual cCRE binding patterns were decomposed into principal components, and complexity was defined as the number of components needed to explain 98% of variance. d, Left, TF binding scores derived from seq2PRINT in the locus control region HS3 enhancer region at chr. 11:5284362-5285162 across erythroid differentiation. Rows represent pseudo-bulks ordered by pseudo-time. Colour legend as in a. Middle, colour bars represent ATAC–seq signal in the same region, and RNA level of HBB. Right, nucleosome footprint scores (100 bp scale) in the same region and pseudo-bulks. e, Line plot showing TF binding scores of representative TFs within erythroid cCREs across the pseudo-time of erythroid differentiation. f, Scatter plot comparing the timing of TF binding and relative position of TF binding sites with cCRE centres. X axis, time lag between TF binding and gain of cCRE accessibility; y axis, average distance of TF binding site to cCRE centres. g, Schematic illustration showing the sequential binding of TFs and widening of cCREs during differentiation. HSC/MPP, haematopoietic stem cells/multipotent progenitors; LMPP, lymphoid-primed multipotent progenitors; CLP, common lymphoid progenitors; pro/pre-B, progenitor and precursor B cells; DC, dendritic cells; CD14mono, CD14 monocytes; CD16mono, CD16 monocytes; GMP, granulocyte–monocyte progenitors; CMP, common myeloid progenitors; MEP, megakaryocyte–erythroid progenitors; early-Ery, early erythroid cells; late-Ery, late erythroid cells; Naive B, naive B cells; Memory B, memory B cells; Plasma B, plasma B cells; pDC, plasmacytoid dendritic cells; CD4, CD4 T cells; CD8, CD8 T cells; NK, natural killer cells; Baso, basophils.
Fig. 4
Fig. 4. Intra-cCRE dynamics in haematopoietic ageing.
a, Schematic of data generation and analysis. b, UMAP of HSC and progenitor cells. c, UMAP showing donor mouse age among HSCs. d, UMAP showing activity of the ageing gene signature obtained from ref. . e, UMAP showing five major HSC subpopulations. f, Heatmap showing clustering of 100 HSC pseudo-bulks into five major subpopulations using the expression of gene programs. Colour bar represents HSC subpopulation labels of each pseudo-bulk, as in e. g, Ranking of known (left, obtained from cisBP) and de novo (right, derived from seq2PRINT) TF motifs by old-versus-young differential chromVAR score testing t-statistics (two-tailed). Top motif logos with no significant cisBP match are highlighted. h, Example composite de novo motifs of Ets homo-/heterodimers, also showing PDB structures of dimers Runx:Ets (PDB-4L0Z) and Ets:Ets (PDB-2NNY). Solvent-inaccessible nucleotide bases are highlighted purple, and core Runx and Ets motifs are shown. i, Age-associated nucleosome changes. Top, Venn diagram showing overlap between cCREs with differential nucleosomes and those with differential accessibility during ageing. Bottom, volcano plot of differential nucleosome changes during ageing, pseudocoloured by density. j, TF motif enrichment at nucleosome footprints lost during ageing (absolute difference in footprint score greater than 1 and false discovery rate (FDR) less than 0.01). Top ten enriched motifs that are upregulated (right) or downregluated (left) in ageing. k, Organization of the Wasl promoter at chr. 6:24664695–24665494 in old and young HSCs. Left, nucleosome footprints (100 bp scale); rows represent individual HSC pseudo-bulks and columns represent single bp positions. Left-hand colour bar represents HSC subpopulations as in e,f; middle colour bars represent chromatin accessibility and Wasl RNA levels in pseudo-bulks; right, top colour bar represents average seq2PRINT-predicted TF binding scores across pseudo-bulks. Heatmap shows TF binding scores in each pseudo-bulk, following centring by subtraction of column averages. l, Schematic of age-associated cCRE reorganization. Illustrations in a created using BioRender (https://biorender.com).
Extended Data Fig. 1
Extended Data Fig. 1. Tn5 bias modelling and footprinting.
a, Scatter plot comparing single nucleotide observed Tn5 insertion bias on BAC RP11-910P5 from replicate 1 and 2. Pearson’s correlation coefficient = 0.97, p-value = 2.2 × 10−16. b, Heatmap showing Pearson correlation coefficient of observed Tn5 on all BACs among 5 replicates. c, Motif logo of Tn5 sequence bias. d, Schematic illustration of the Tn5 bias prediction model. e, Histogram of local GC-content in a +/− 10 bp window for top 2000 genomic positions where the neural network Tn5 bias model achieved the highest improvement in prediction error compared to the PWM bias model. f, Histogram of local GC-content in a +/− 10 bp window for bottom 2000 genomic positions where the neural network Tn5 bias model achieved the least improvement in prediction error compared to the PWM bias model. g-h, Scatter plot showing the performance of the Tn5 bias model (trained on BAC data) on human genomic DNA (g) and BAC naked DNA (h) at different sequencing coverage. Performance is evaluated using the Pearson correlation coefficient between predicted and observed Tn5 bias. i, Tracks showing observed Tn5 insertion and Tn5 bias on human genomic DNA, as well as the Tn5 bias predicted by the neural network model trained on BAC data. Observed Tn5 bias is calculated by dividing the Tn5 insertion at each position by the local average Tn5 insertion within a +/− 50 bp window. Showing example region at chr1:37452355-37453354. j-k, Bar plots showing correlation between observed Tn5 bias and Tn5 bias predicted by ChromBPNet and PRINT, respectively. The ChromBPNet model was trained on (j) HepG2 and (k) K562 ATAC data. l, Bar plot showing the frequency of calling false positive footprints by previous ATAC-footprinting methods and PRINT. m-v, Testing our footprinting framework in an example cCRE region. m-q, Results for BAC naked DNA. m, Observed raw Tn5 insertion counts. n, Observed Tn5 bias. o, Tn5 bias predicted by the convolutional neural network. p, Footprint scores with bias correction. q, Footprint scores without bias correction. r-v, Results for HepG2 chromatin ATAC-seq. r, Observed raw Tn5 insertion counts. s, Observed-expected deviation of centre / (centre + flank) insertion ratio. t, Footprint scores with model-based bias correction. u, Footprint scores with bias correction using ground truth bias in n. v, Footprint scores without bias correction.
Extended Data Fig. 2
Extended Data Fig. 2. Multiscale footprinting detects binding of diverse TFs.
a-d, Box plots showing footprint scores at motif sites or background (non-motif) sites with 0 nM or 100 nM TFs. Showing results for PRINT (a, c) and TOBIAS (b, d). Both CEBPA (a-b) and MYC/MAX (c-d) were tested for footprinting. Number of single base pair positions included were (a) n = 207880, (b) n = 104895, (c) n = 207880, and (d) n = 104896. Boxes show 1st, 2nd, and 3rd quartile. Whiskers show the farthest point falling within the 1st quartile − 1.5 interquartile range (IQR) or 3rd quartile + 1.5 IQR. e, Heatmap showing clustering of multiscale aggregate footprints of different TFs. Each row is the multiscale aggregate footprints of a specific TF. Left colour bar shows TF cluster membership. Right colour bar shows the TF family each TF belongs to. Showing footprint results with footprint window diameter of 20 bp, 40 bp, and 60 bp, respectively. f, Aggregate multiscale footprints of BHLHE40 in CD8 + T cells. g, Footprint at different scales at bound and unbound USF1 motif sites as defined by ChIP-exo data. h, Multiscale footprints at example NRF1 and USF1 binding sites indicated by ChIP-exo.
Extended Data Fig. 3
Extended Data Fig. 3. Footprint-to-nucleosome prediction.
a, Tracks showing observed Tn5 insertion, nucleosome occupancy predicted by NucleoATAC and our footprint-to-nucleosome model, as well as ground truth nucleosome occupancy measured by chemical mapping. b, c, Precision-recall curve of NucleoATAC and PRINT for nucleosome mapping. Predicted nucleosome centres are considered to be a true positive prediction if it is within 75 bp (c) or 50 bp (d) from the nearest ground truth nucleosome centre. d-f, Line plots showing the relationship between model performance and local coverage or distance to nearest cCRE.
Extended Data Fig. 4
Extended Data Fig. 4. The seq2PRINT framework.
a, Schematic illustration of the seq2PRINT model. b-c, Down-sampling test for seq2PRINT. Showing (b) Pearson correlation coefficient between predicted and ground truth multiscale footprints and (c) median precision of TF binding prediction at top 10% predicted binding sites. Here, ground truth footprints were defined as observed footprints without any down-sampling. d, Waterfall plot showing precision improvement of seq2PRINT over ChromBPNet for individual TFs. e, Observed footprints (40 bp scale) at bound and unbound motif sites for ATF3 and YY1. Bound and unbound motif sites are defined by overlap with ChIP-seq peaks. f, TF binding scores predicted by seq2PRINT at bound and unbound motif sites for ATF3 and YY1. g, Observed changes in multiscale footprints at GR binding sites after dexamethasone treatment to induce relocalization of GR into the nucleus and binding to DNA. h, seq2PRINT-predicted differences in multiscale footprints at GR motif sites comparing WT GR motif and in silico disruption of GR motif. (Pearson correlation=0.73 with observed changes). i, Observed changes in multiscale footprints at Stat2 binding sites in B cells after IFN treatment. j, seq2PRINT-predicted differences in multiscale footprints at Stat2 binding sites comparing WT Stat2 motif and in silico disruption of Stat2 motif. (Pearson correlation=0.23 with observed changes). k, Heatmap showing clustering of TFs based on Jaccard similarity of motif matches. Rows and columns are individual TFs.
Extended Data Fig. 5
Extended Data Fig. 5. Single cell multi-omic profiling of human bone marrow.
a, Tn5 insertion enrichment around TSSs. b, Fragment size distribution. c, Scatter plot showing library size and fraction of reads in peaks (FRIP) of single cells. Dashed lines represent thresholds of FRIP = 0.3 and library size = 250. Density is computed using the kde2d function in the MASS package and rescaled to reflect relative fold of enrichment compared to the cell with the lowest observed density. d, Dot plot showing gene scores (ATAC signal within a region around promoter) of marker genes across cell types. e, Dot plot showing RNA levels of marker genes across cell types. f, Heatmap showing RNA expression z-scores of cell type marker gene signatures in each cluster. Rows represent annotated clusters in our human bone marrow dataset. Columns represent individual cell-type signatures obtained from PanglaoDB and CellMarker2.0. g, UMAP showing donor origin of single cells. h, Line plot showing single cell coverage for each cell type as a function of the number of pseudo-bulks. i, UMAP showing the positions of pseudo-bulk centres for all 1000 pseudo-bulks we generated. j-m, Example pseudo-bulks. Black dots represent member cells within the pseudo-bulk.
Extended Data Fig. 6
Extended Data Fig. 6. TF and nucleosome dynamics across human hematopoiesis.
a, Schematic illustration of using LoRA to scale up seq2PRINT training on large numbers of samples (pseudo-bulks). b, Bar plot comparing run time of training separate seq2PRINT models on 1000 pseudo-bulks versus using LoRA fine-tuning. c, Box plot comparing the Pearson correlation coefficient between predicted and observed footprints by either training separate seq2PRINT models on 1000 pseudo-bulks versus using LoRA fine-tuning. Boxes show first, second, and third quartiles. Whiskers show the farthest point falling within the first quartile − 1.5 IQR or third quartile + 1.5 IQR. d-g, Heatmaps of TF binding scores predicted by seq2PRINT in example loci across all 1000 pseudo-bulks. Each row represents a pseudo-bulk and each column represents a single base-pair position. Left: colour legend for cell types with matching colours as Fig. 3a. Right: accessibility of the cCRE region in each pseudo-bulk. h, Line plot showing TF binding scores of representative TFs within the HS3 enhancer shown in Fig. 3d across the pseudo-time of erythroid differentiation. i-m, cCRE reorganization within the HBB promoter across erythroid differentiation. i, Heatmap of TF binding scores predicted by seq2PRINT in the HBB promoter at chr11:5226700-5227499. j, Multiscale footprints in the same region as i in early- and late-erythroid cells. k-m, Zoomed-in results in the sub-region chr11:5227022-5227208. k, Line plot of footprint scores at 40 bp scale in early- and late- erythroid cells. Showing mean and standard deviation across 7 human donors. l, MPRA log2 variant effect sizes obtained from ref.  in the same region as k. m, Sequence attribution scores in the same region as k and l generated by seq2PRINT in early- and late-erythroid cells. n, Change in the maximum distance between adjacent nucleosomes in erythroid cCREs across differentiation pseudo-time. Showing median and 25-75 percentile range at each pseudo-time. o-r, Line plot showing TF binding scores of representative TFs within (o) low complexity and (p) high complexity erythroid cCREs across the pseudo-time of erythroid differentiation. q-r, Scatter plot comparing the timing of TF binding and relative position of TF binding sites to cCRE centers in (q) low complexity and (r) high complexity erythroid cCREs. s, Scatter plot comparing the timing of TF binding across B lymphocyte differentiation and relative position of TF binding sites to cCRE centres. Horizontal axis: time-lag between TF binding and gain of cCRE accessibility. Vertical axis: average distance of TF binding site to cCRE centers.
Extended Data Fig. 7
Extended Data Fig. 7. Generation of the mouse hematopoietic stem cell aging dataset.
a-b, Flow cytometry gating strategy for isolation of haematopoietic progenitor cells (lineage negative, gate bolded; Live Lin) and haematopoietic stem cells (HSCs, gate bolded; Live Lin Sca1+ cKit+ CD48 CD150+) from the bone marrow (BM) of young (a, n = 10) and aged (b, n = 5) male C57BL6/J mice. Representative FACS plots shown from one young and one aged mouse. For individual FACS plots from each mouse, see Supplementary Data 3. c, Sorting results confirming purity of resorted HSCs was greater than 99%. d, Frequency of FACSorted HSCs in young and aged mice (two-tailed t-test; t13 = 9.283, p = 4.2 × 10−7). The frequency was determined from collecting 100k events for each animal. Displayed is the mean frequency in each group with error bars representing the standard error of mean (SEM). e-g, QC metrics of the dataset. e, Fragment size distribution. f, TSS enrichment. g, Depth-FRIP scatter plot.
Extended Data Fig. 8
Extended Data Fig. 8. Characterizing age-related changes in mouse HSCs.
a, UMAP showing gene scores of cell type marker genes Cd3d, Elane, Hlf, and Gata1, respectively. b, Percentage of old cells in the 100-cell nearest neighbourhood for FACS sorted HSCs (left) or lineage- cells (right). c-d, UMAP showing (c) RNA and (d) ATAC levels of aging marker genes (Clu, Selp, Nupr1) in HSCs. e, Volcano plot of differential RNA testing (old-versus-young). P-values were calculated using a two-sided Wald test by DESeq2. f, UMAP showing example pseudo-bulks. Black dots represent member cells within each pseudo-bulk. g, Heatmap showing clustering of pseudo-bulks (columns) and Spectra gene programs (rows). Pseudo-bulks were grouped into 5 major HSC subpopulations as labelled at the top. h-i, UMAP showing expression of gene signatures for Mk-biased and multi-lineage HSCs. Gene signatures were obtained from ref. . j-m, Box plots showing expression of example Spectra gene programs across HSC subpopulations (n = 100 pseudo-bulks). Boxes show first, second, and third quartiles. Whiskers show the farthest point falling within the first quartile − 1.5 IQR or third quartile + 1.5 IQR. P-values were derived using a two-sided t-test.
Extended Data Fig. 9
Extended Data Fig. 9. Age-associated cCRE reorganization.
a-b, Ranking of known (left, obtained from cisBP) and de novo (right, derived from seq2PRINT) TF motifs by subpopulation-specific old-vs-young differential t-statistics (two-tailed) of chromVAR scores in (a) the Mk-biased subpopulation and (b) the multi-lineage subpopulation. c-d, Scatter plots comparing the results in a-b between subpopulations for (c) cisBP TF motifs, and (d) de novo TF motifs learned by seq2PRINT. e, Scatter plot comparing old-vs-young differential testing t-statistics (two-tailed) of de novo TF motifs and the correlation of chromVAR scores between each de novo motif and its best matched known cisBP motif. f, Example CpG-containing de novo motifs that are down-regulated during aging. g, Bar plot showing differential RNA results for partner TFs forming composite motifs with Ets1. h, UMAP showing chromVAR motif scores of de novo motif #10 and #18. i, seq2PRINT-predicted impact on multiscale footprints by example composite de novo motifs containing Ets1 and Runx1. j, Left: different configurations of Runx-Ets composite de novo motifs detected by seq2PRINT in HSCs. Showing the orientation and spacing of the Runx and Ets motifs. Right: AlphaFold3-predicted structures of Ets1 and Runx1 on example composite motifs. Solvent inaccessible nucleotide bases are highlighted purple and the core Runx and Ets motifs are shown. k, Age-associated chromatin accessibility changes. Top: density plot of old - young log2 fold changes in accessibility for individual cCREs. Bottom: volcano plot with the same horizontal axis values. l-q, Age associated nucleosome changes in Mk-biased (l-n) and multi-lineage (o-q) HSC subpopulations. l, o, Top: density plot of old - young nucleosome footprint score changes at individual nucleosomes detected by PRINT. Bottom: volcano plot with the same horizontal axis values. m, n, p, q, TF motif enrichment at nucleosomes footprints lost during ageing (absolute difference in footprint score > 1 and FDR < 0.01). Top 10 enriched motifs of TFs that are down-regulated (m, p) or up-regulated (n, q) in ageing.
Extended Data Fig. 10
Extended Data Fig. 10. Examples of age-associated cCRE reorganization.
a-f, Example promoter regions with age-associated cCRE reorganization, showing results for chr7:127273660-127274460 (a-c), chr11:72606801−72607600 (d-f). a, d, Multiscale footprints in young and old HSCs, and old-young differences. b, e, Nucleosome footprints (100 bp scale) across pseudo-bulks. Rows represent individual HSC pseudo-bulks and columns represent single base-pair positions. Left colour bar represents the HSC sub-populations with the same colour coding in Fig. 3e,f. Right colour bars: chromatin accessibility and RNA levels of the corresponding gene across pseudo-bulks. c, f, Top colour bar shows the average seq2PRINT-predicted TF binding scores across pseudo-bulks. Heatmap shows TF binding scores in each pseudo-bulk, after centring by subtracting column averages.

References

    1. Gasperini, M., Tome, J. M. & Shendure, J. Towards a comprehensive catalogue of validated and target-linked human enhancers. Nat. Rev. Genet.21, 292–310 (2020). - PMC - PubMed
    1. Lai, W. K. M. & Pugh, B. F. Understanding nucleosome dynamics and their links to gene expression and DNA replication. Nat. Rev. Mol. Cell Biol.18, 548–562 (2017). - PMC - PubMed
    1. Calo, E. & Wysocka, J. Modification of enhancer chromatin: what, how, and why? Mol. Cell49, 825–837 (2013). - PMC - PubMed
    1. ENCODE Project Consortium. et al. Expanded encyclopaedias of DNA elements in the human and mouse genomes. Nature583, 699–710 (2020). - PMC - PubMed
    1. Buenrostro, J. D., Giresi, P. G., Zaba, L. C., Chang, H. Y. & Greenleaf, W. J. Transposition of native chromatin for fast and sensitive epigenomic profiling of open chromatin, DNA-binding proteins and nucleosome position. Nat. Methods10, 1213–1218 (2013). - PMC - PubMed

MeSH terms

LinkOut - more resources