. 2025 Mar;639(8055):700-707.
doi: 10.1038/s41586-024-08450-5. Epub 2025 Jan 22.

Complete human recombination maps

Affiliations

Complete human recombination maps

Gunnar Palsson et al. Nature. 2025 Mar.

Abstract

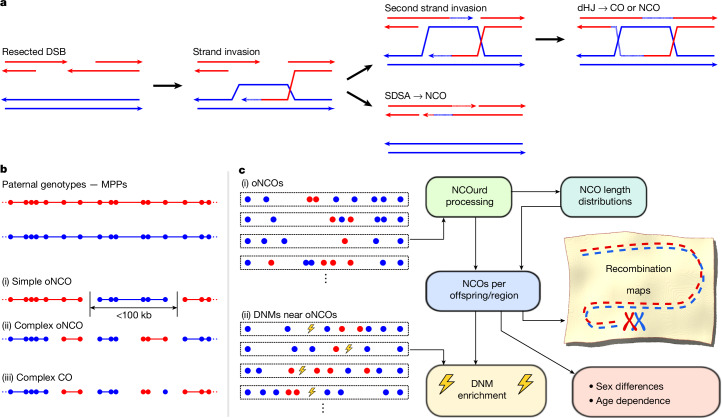
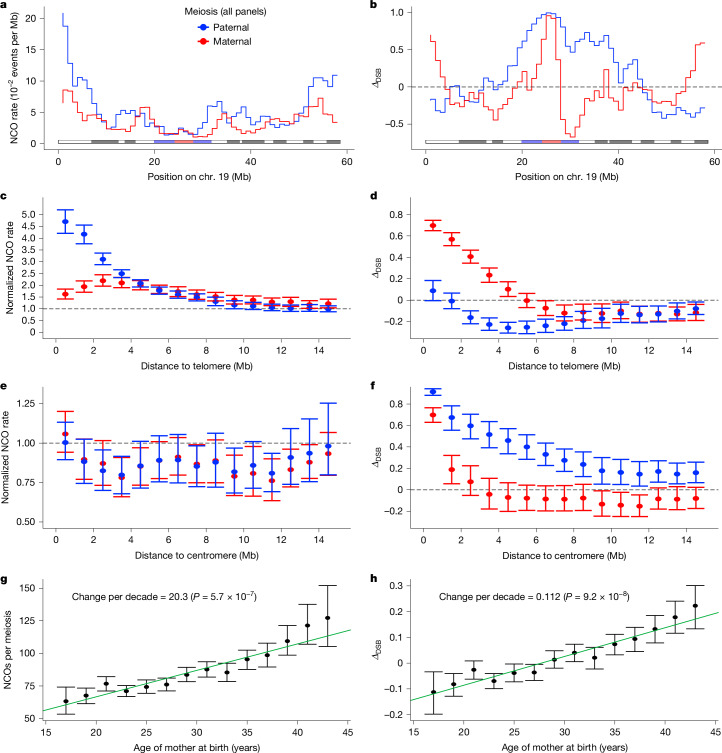
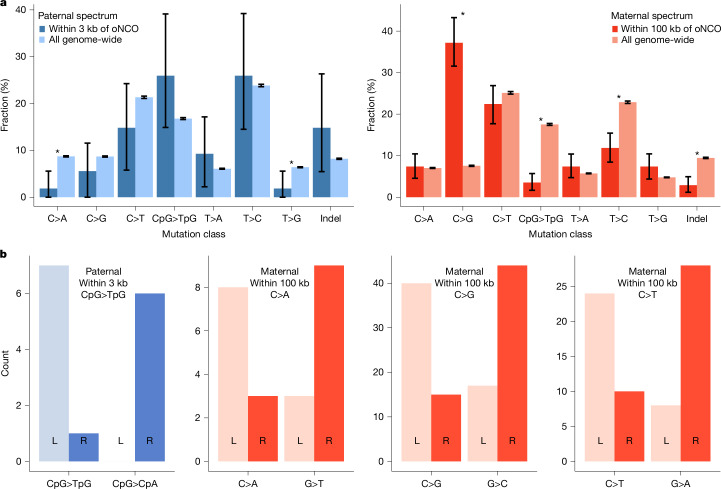
Human recombination maps are a valuable resource for association and linkage studies and crucial for many inferences of population history and natural selection. Existing maps1-5 are based solely on cross-over (CO) recombination, omitting non-cross-overs (NCOs)-the more common form of recombination6-owing to the difficulty in detecting them. Using whole-genome sequence data in families, we estimate the number of NCOs transmitted from parent to offspring and derive complete, sex-specific recombination maps including both NCOs and COs. Mothers have fewer but longer NCOs than fathers, and oocytes accumulate NCOs in a non-regulated fashion with maternal age. Recombination, primarily NCO, is responsible for 1.8% (95% confidence interval: 1.3-2.3) and 11.3% (95% confidence interval: 9.0-13.6) of paternal and maternal de novo mutations, respectively, and may drive the increase in de novo mutations with maternal age. NCOs are substantially more prominent than COs in centromeres, possibly to avoid large-scale genomic changes that may cause aneuploidy. Our results demonstrate that NCOs highlight to a much greater extent than COs the differences in the meiotic process between the sexes, in which maternal NCOs may reflect the safeguarding of oocytes from infancy until ovulation.


Conflict of interest statement

Competing interests: All authors are employees of deCODE genetics/Amgen.

Figures

Fig. 1
Fig. 1. Meiosis, NCOs and data analysis.
a, Schematic view of NCO and CO resolution. A DSB is induced on one chromosome (red) and the 5′ strands near the DSB are resected. The 3′ strands invade the homologous chromosome (blue), and DNA is synthesized (dotted lines) to bridge the DSB. When only one strand invades, the synthesis-dependent strand annealing (SDSA) pathway is used, leading to NCOs. When both strands invade, a double Holliday junction (dHJ) is generated; this is the primary source of COs. b, Schematic view of recombination events. The points denote MPPs in a meiosis, with the colour indicating the grandparental origin of each MPP. Short haplotype segments are gene conversion candidates flanked by background haplotypes forming (i) a simple oNCO with a single converted segment or (ii) a complex oNCO with alternating gene-converted and non-gene-converted segments if background haplotypes are of the same grandparental origin, or otherwise (iii) a CO with associated gene conversions. c, Schematic overview of the NCOurd process and subsequent analysis. (i) oNCOs are specified by a set of gene-converted MPPs (red) and the surrounding background haplotype MPPs (blue). Our previously described method (NCOurd) derives length distributions for NCOs from the oNCOs. These are used to compute the numbers of NCOs per offspring or region. NCOs per offspring allow us to explore sex differences and age dependence of the meiotic process, as well as interactions with DNMs estimated from (ii) DNMs found near oNCOs. NCOs per region are used to compute the number of NCOs throughout the genome to create maps of NCO activity and DSB resolution.
Fig. 2
Fig. 2. Recombination map and maternal age effects.
a, NCO maps for chromosome (chr.) 19. b, ΔDSB measure for chr. 19. Cytobands are shown below the graphs, with the centromere indicated in red, gneg bands in white, all gpos bands in grey, and gvar and stalk bands in blue. c,d, Average values of NCO (c) and ΔDSB (d) recombination maps near telomeres, with the NCO data normalized to the autosomal average. Error bars show 95% confidence intervals computed by bootstrapping 1,000 samples on the basis of map data for the 22 autosomes. e,f, As in c (e) and d (f), but for map values near centromeres. Dashed lines represent genome-wide averages. g,h, Results for per-offspring NCO count (g) and ΔDSB (h) of maternal meioses versus maternal age. Offspring are grouped by maternal age in bins of size 2 years; the points show group averages, omitting bins with fewer than 25 offspring. Error bars show 95% confidence intervals computed by bootstrapping 1,000 samples from the 5,240 probands. Green lines show linear regression results using the inverse of the size of the confidence intervals as weight. P values for regression results were based on Student’s t-distribution.
Fig. 3
Fig. 3. Mutation spectra.
a, Mutation spectra for phased DNMs proximal to oNCOs and genome-wide. DNMs were considered to be proximal to oNCOs if they were within 3 kb and 100 kb for paternally and maternally phased DNMs, respectively. The length of the bars indicates the mutation class fraction for the complete cohort of the study. Error bars show 95% confidence intervals computed by bootstrapping 1,000 samples; asterisks indicate mutation classes in which the NCO-proximal and genome-wide spectra were significantly different (P < 0.05, bootstrap test). b, Strand asymmetry for phased DNMs around oNCOs. L and R denote DNMs to the left and right of the oNCO centre, respectively.
Extended Data Fig. 1
Extended Data Fig. 1. Co-conversion probability and oNCO extent.
a| Proportion of gene converted markers as function of distance from the first marker of oNCOs. b| Proportion of markers that are within the oNCO (gene converted or not) as a function of distance from the first marker of oNCOs. The fraction of markers within oNCOs for a given distance provides a lower bound on fraction of oNCOs shorter than that distance.
Extended Data Fig. 2
Extended Data Fig. 2. Variation of recombination maps with distance to nearest telomere.
The figure shows the average map values vs. distance to the nearest telomere, computed on a grid of 3 Mb overlapping windows and normalized individually with respect to their genome-wide mean. The x-coordinates for the telomere distance are shifted slightly in opposite directions for paternal/maternal meiosis so that error bars don’t overlap for nearby points. The error bars indicate 95% confidence intervals and are computed by bootstrap sampling 1000 times from the set of windows within each distance bin.
Extended Data Fig. 3
Extended Data Fig. 3. Variation of recombination maps with GC content.
The GC content is computed on the same overlapping 3 Mb windows as the maps, split into deciles and the average map values computed for the windows that fall into each decile. All maps except ΔDSB are normalized individually with respect to their genome-wide mean. The x-coordinate in the figures shows the median GC content in each decile, shifted slightly in opposite directions for paternal/maternal meioses so that errors bars don’t overlap for nearby points. The error bars indicate 95% confidence intervals and are computed by bootstrap sampling the map values 1000 times from the set of windows within each decile.
Extended Data Fig. 4
Extended Data Fig. 4. Variation of recombination maps with replication timing.
The replication timing is computed on the same overlapping 3 Mb windows as the maps, split into deciles and the average map values computed for the windows that fall into each decile. All maps except ΔDSB are normalized individually with respect to their genome-wide mean. The x-coordinate in the figures corresponds to the median replication time in each decile, shifted slightly in opposite directions for paternal/maternal meioses so that errors bars don’t overlap for nearby points. Early replication time corresponds to replication timing of 1.0, Mid corresponds to 0.0, and Late corresponds to −1.0. The error bars indicate 95% confidence intervals and are computed by bootstrap sampling the map values 1000 times from the set of windows within each decile.
Extended Data Fig. 5
Extended Data Fig. 5. Distribution of NCO-proximal DNMs.
The count of phased SNP/Indel DNMs near oNCOs vs. distance from the center of the oNCO.
Extended Data Fig. 6
Extended Data Fig. 6. Comparison of mutation spectra for phased DNMs.
DNMs are considered proximal to oNCOs and COs if they are within 3 kb and 100 kb for paternally and maternally phased DNMs, respectively. The length of bars indicates the mutation class fraction, computed for 5400 probands. Error bars represent 95% confidence intervals, computed using 1000 bootstrap samples.
Extended Data Fig. 7
Extended Data Fig. 7. Strand asymmetry spectra for SNP DNMs.
The count of phased SNP DNMs within the regions of enriched DNM rate around oNCOs, i.e. within 3 kb for paternal DNMs and within 100 kb for maternal DNMs. Strand asymmetry of DNM variants and their complement is observed in four mutation classes: maternal C > A (Fisher’s test p-value: 0.039), maternal C > G (Fisher’s test p-value: 2.3·10−6), and maternal C > T (Fisher’s test p-value: 7.0·10−5), and paternal CpG > TpG (Fisher’s test p-value: 4.7·10−3).

References

    1. Halldorsson, B. V. et al. Characterizing mutagenic effects of recombination through a sequence-level genetic map. Science363, eaau1043 (2019). - PubMed
    1. Kong, A. et al. A high-resolution recombination map of the human genome. Nat. Genet.31, 241–247 (2002). - PubMed
    1. Bhérer, C., Campbell, C. L. & Auton, A. Refined genetic maps reveal sexual dimorphism in human meiotic recombination at multiple scales. Nat. Commun.8, 14994 (2017). - PMC - PubMed
    1. Broman, K. W., Murray, J. C., Sheffield, V. C., White, R. L. & Weber, J. L. Comprehensive human genetic maps: individual and sex-specific variation in recombination. Am. J. Hum. Genet.63, 861 (1998). - PMC - PubMed
    1. Frazer, K. A. et al. A second generation human haplotype map of over 3.1 million SNPs. Nature449, 851–861 (2007). - PMC - PubMed

LinkOut - more resources