. 2025 Feb;638(8052):1065-1075.
doi: 10.1038/s41586-024-08453-2. Epub 2025 Jan 22.

Mapping cells through time and space with moscot

Affiliations

Mapping cells through time and space with moscot

Dominik Klein et al. Nature. 2025 Feb.

Abstract

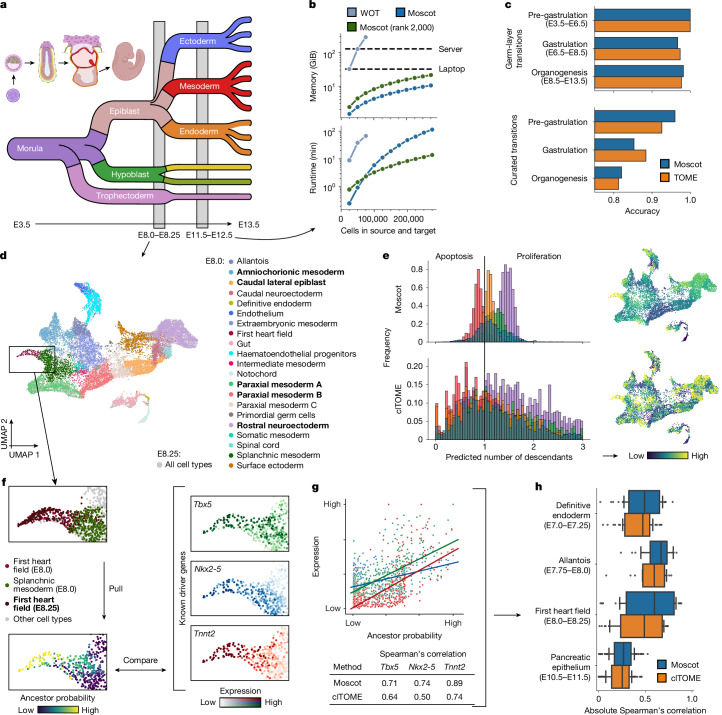
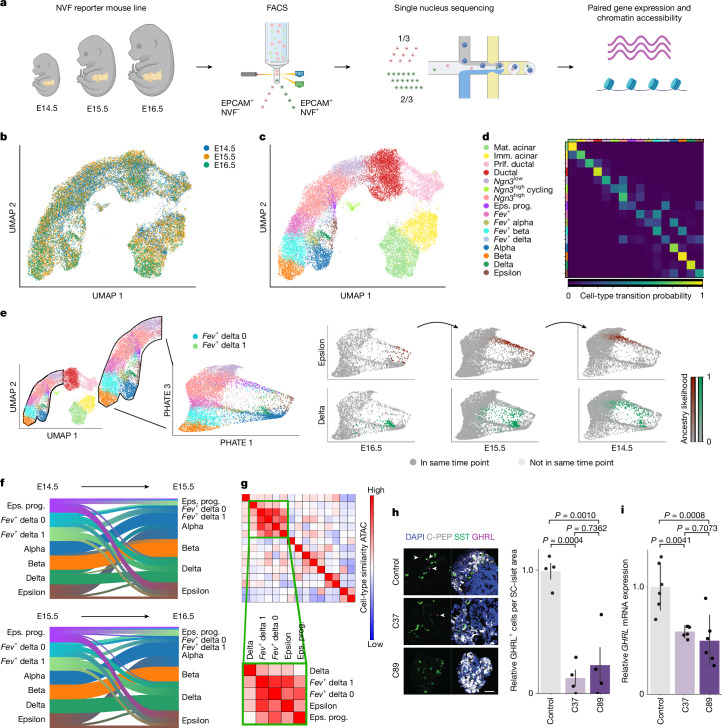
Single-cell genomic technologies enable the multimodal profiling of millions of cells across temporal and spatial dimensions. However, experimental limitations hinder the comprehensive measurement of cells under native temporal dynamics and in their native spatial tissue niche. Optimal transport has emerged as a powerful tool to address these constraints and has facilitated the recovery of the original cellular context1-4. Yet, most optimal transport applications are unable to incorporate multimodal information or scale to single-cell atlases. Here we introduce multi-omics single-cell optimal transport (moscot), a scalable framework for optimal transport in single-cell genomics that supports multimodality across all applications. We demonstrate the capability of moscot to efficiently reconstruct developmental trajectories of 1.7 million cells from mouse embryos across 20 time points. To illustrate the capability of moscot in space, we enrich spatial transcriptomic datasets by mapping multimodal information from single-cell profiles in a mouse liver sample and align multiple coronal sections of the mouse brain. We present moscot.spatiotemporal, an approach that leverages gene-expression data across both spatial and temporal dimensions to uncover the spatiotemporal dynamics of mouse embryogenesis. We also resolve endocrine-lineage relationships of delta and epsilon cells in a previously unpublished mouse, time-resolved pancreas development dataset using paired measurements of gene expression and chromatin accessibility. Our findings are confirmed through experimental validation of NEUROD2 as a regulator of epsilon progenitor cells in a model of human induced pluripotent stem cell islet cell differentiation. Moscot is available as open-source software, accompanied by extensive documentation.


Conflict of interest statement

Competing interests: F.J.T. consults for Immunai, Singularity Bio, CytoReason, Cellarity and Omniscope, and has ownership interest in Dermagnostix and Cellarity. The remaining authors declare no competing interests.

Figures

Fig. 1
Fig. 1. Moscot enables efficient multimodal OT across single-cell applications.
a, Schematic of a generic OT pipeline for single-cell genomic analyses (from left to right): experimental shifts (for example, time points and different spatial slides) lead to disparate cell populations. Previous biological knowledge (for example, proliferation rates and spatial arrangement) is often available and should be used to guide the mapping process. OT aligns cellular distributions by minimizing the displacement cost. The learnt mapping facilitates various downstream analysis opportunities. b, Moscot introduces three key innovations that unlock the full power of OT. First, it supports multimodal data across all models. Second, it overcomes previous scalability limitations to enable atlas-scale applications. Third, moscot is a unified framework with a consistent API across biological problems, which will facilitate usability and enable extensions to new problems in a straightforward manner. Panels a and b were created using BioRender (https://www.biorender.com).
Fig. 2
Fig. 2. Moscot faithfully reconstructs atlas-scale developmental trajectories.
a, Schematic of an example mouse embryogenesis atlas, which includes 20 time points and 1.7 million cells. b, Benchmark of peak memory consumption (top, on CPU) and computation time (bottom, on GPU) for increasing numbers of cells, subsampled from the E11.5–E12.5 time point pair (Methods and Supplementary Table 1). We compared WOT with default moscot.time and low-rank moscot.time (rank 2,000) (Supplementary Note 3; WOT was run on CPU as it does not support GPU acceleration). c, Accuracy comparison between TOME and moscot.time in terms of germ-layer and cell-type transition scores by developmental stage (Methods and Supplementary Table 2). d, Uniform manifold approximation and projection (UMAP) projection of the E8.0–E8.25 time point pair, coloured by original cluster annotations. e, Growth-rate estimates of moscot.time (top) and clTOME (bottom) for the five most prevalent E8.0 cell types in d (highlighted in bold) as histograms (left) and on UMAP projections (right). The black vertical bar denotes a growth rate of one. f, The ancestor probability for E8.25 first heart field cells (left) versus gene-expression levels of known driver genes Tbx5, Nkx2-5 and Tnnt2 (right; Methods and Supplementary Table 7) calculated using moscot.time. g, Quantification of the comparison in f using Spearman’s correlation. Genes are coloured as in f, and each dot denotes a cell and lines indicate a linear data fit. h, Distribution (n = 36 genes (definitive endoderm), n = 18 (allantois), n = 39 (heart field), n = 106 (pancreatic epithelium); vertical lines correspond to quarters, whiskers are outliers) of absolute Spearman’s correlation values between ancestor probabilities and known driver-gene expression for moscot.time and clTOME (Methods and Supplementary Table 4). Panel a was created using BioRender (https://www.biorender.com).
Fig. 3
Fig. 3. Moscot enables multimodal mapping and alignment of spatial transcriptomic data.
a, Schematic of a multimodal single-cell reference dataset being mapped onto a spatial dataset. b, Spatial correspondence is associated with prediction accuracy in moscot. Linear fit of the median Spearman’s correlation between true and imputed gene expression with respect to the spatial correspondence (Methods) of 12 datasets. c, Liver sections with annotations mapped from the CITE-seq dataset (Extended Data Fig. 3). The square marks the cropped tiles in df. d, Measured gene expression for Vwf (endothelial cell marker) and Axin2 (hepatocytes and endothelial marker). Vwf is used to identify all epithelial cells that define the boundaries of CVs and PVs. Axin2 is a positive marker for CVs. e, Predicted gene expression for Adgrg6 and Gja5, known endothelial cells markers for PVs. f, Predicted protein expression of folate receptor β, a marker for Kupffer cells (top) and imputed cell types for Kupffer cells and endothelial cells (bottom). g, Schematic of the proceess of aligning sections from multiple slides to a common reference sample. h, Visualization of a tile of the spatial sections of the mouse brain for section 1 coloured by batch (left) and by expression of Slc17a7 (right). i, Visualization of a tile of the spatial sections of the mouse brain for section 2 coloured by batch (left) and by expression of Slc17a7 (right). Panels a and g were created using BioRender (https://www.biorender.com).
Fig. 4
Fig. 4. Inference of spatiotemporal dynamics with moscot.
a, Schematic of spatiotemporal trajectory inference of mouse embryogenesis. b, Accuracy of curated transitions across developmental stages (Methods and Supplementary Table 5) for the temporal and spatiotemporal application of moscot compared with TOME. c, Mapping heart cells across time points (bottom) and ground-truth annotation of the heart lineage (top). d, Heart-lineage driver genes found by interfacing moscot with CellRank 2 (refs. ,). Top, Tbx20 encodes a TF known to have various fundamental roles in cardiovascular development. Bottom, Myl7 encodes a protein related to metabolism and heart regeneration (Supplementary Table 7). e, Transferring high-resolution cell-type annotations only provided in the latest time point (E16.5) to earlier time points. f, Pearson’s correlations of gene expression with neuronal (x axis) and fibroblast (y axis) fate probabilities. Annotated genes are among the top 20 driver genes and were previously associated with fibroblasts and neuronal lineage (Supplementary Tables 7 and 8). g, Spatial visualization of sample neuronal-driver genes, Neurod2 and Sox11 (Supplementary Table 8). Cere gran NeuB, cerebellar granule neuroblast; corti, cortical; CR, Cajal–Retzius cell; fibro, fibroblast; die, diencephalon; dors, dorsal; endo, endothelial; ery, erythrocyte; Fb, forebrain; Glu, glutamatergic; neu, neuron; Hb, hindbrain; hypo, hypothalamus; Mb, midbrain; VH, ventromedial hypothalamus. Panel a was created using BioRender (https://www.biorender.com).
Fig. 5
Fig. 5. Moscot reveals lineage ancestries of delta and epsilon cells.
a, Schematic of the experimental protocol to generate paired gene expression and ATAC data that capture the development of the mouse pancreas. b,c, Multimodal UMAP join embedding, coloured by time (b) and cell-type annotation (c) (Methods). d, Heatmap visualizing descendancy probabilities of cell types in E14.5 as obtained using moscot.time. e, UMAP embedding coloured as in c, including the refined Fev+ delta populations. The inset highlights the cells that a PHATE embedding is computed for. The top row shows epsilon cells at E16.5 (left) as well as the progenitor population at E15.5 (middle) and E14.5 (right) as predicted by moscot. The bottom row shows the corresponding plots for delta cells. f, Sankey diagram of the cell-type transitions between E14.5 and E15.5 (top) and E15.5 and E16.5 (bottom). g, Similarity in ATAC profile between different cell types (Methods). The green boxes highlight the cell types for which ancestry was focused on. h, Representative confocal microscopy images (left) and quantification (right) of ghrelin-expressing cells in control and NEUROD2 KO (C37 and C89) stem-cell-derived islets (SC islets) at stage 6, day 14 (Methods). White arrowheads indicate GHRL+ cells. Scale bar, 50 µm. n = 4 independent experiments, mean and s.e.m. reported. i, Quantitative PCR analysis of expression levels of GHRL at stage 6, day  14 (n = 6 biologically independent samples). Data are represented as the mean and s.d. (Methods). P  values (h,i) were calculated using one-sided analysis of variance test with Tukey’s multiple comparison correction. Eps. prog., epsilon progenitors; FSC, forward scatter; imm., immature; mat., mature; prlf., proliferating; SSC, side scatter. Panel a was created using BioRender (https://www.biorender.com).
Extended Data Fig. 1
Extended Data Fig. 1. Low-rank approximates full-rank Sinkhorn at faster running times.
a. Runtime in minutes to compute a coupling matrix (left) and to evaluate algorithm performance (right), across time points on the embryogenesis data of Fig. 2, for full-rank Sinkhorn (default moscot.time) and low-rank Sinkhorn for various ranks (Methods). b. Cell number per time point. c. Comparing low and full-rank approaches in terms of the germ-layer (top) and curated transition (bottom) metrics of Fig. 2, for individual time points (left) and aggregated over time-windows (right, Methods).
Extended Data Fig. 2
Extended Data Fig. 2. Metacells do not resolve PGCs and metacell mapping degrades driver gene correlation for Pancreatic epithelium.
a. UMAP of E9.5 cells, visualizing individual cells (small dots) and metacells (large dots) computed using Metacell-2 (Methods). Colors indicate PGCs and cell types that co-occur in metacells with PGCs. The zoom-in highlights PGCs, which are not captured by any metacell. b. Bar chart over cell-type composition for the six metacells at E9.5 containing most PGCs. No metacell received the “PGC” label because they are dominated by other cell types. c,d. Comparing moscot mapping at E10.5-11.5 on the single cell versus metacell levels in terms of the curated transition and germ layer scores (c) and correlation between Pancreatic epithelium ancestor probabilities and known driver gene expression (d; Methods).
Extended Data Fig. 3
Extended Data Fig. 3. Overview of CITE-seq data and mapped annotations.
a. UMAP embedding of single-cell (left) and CITE-seq (right) dataset, respectively. Labels were provided in the original publication. b. Cell type annotation mapped in spatial coordinates. All cell types visualized in space (left), and spatial plot of only Kupffer cells (blue) and Endothelial cells (red,right). Boxes in solid lines correspond to insets in Fig. 3. c. Top five differentially expressed proteins (five genes/proteins per cluster in rows) in original CITE-seq dataset (left) and predicted cell types and protein expression in space (right).
Extended Data Fig. 4
Extended Data Fig. 4. Alignment of spatial transcriptomics data of sections of the mouse brain.
a. Spatial visualization of the three coronal sections from three different mouse brains before the alignment. b. Spatial visualization of the three coronal sections after affine alignment. c. Spatial visualization of the three coronal sections after warping alignment. d.-f. Original, affine transform and warped transformed tissue slices from the second set of three coronal sections from three different mouse brains.
Extended Data Fig. 5
Extended Data Fig. 5. Analysis of development lineages by interfacing moscot.spatiotemporal with CellRank 2.
a. UMAP representation of the spatiotemporal atlas of mouse embryogenesis (MOSTA) over eight time points, from E9.5 to E16.5 colored by time points. b. UMAP colored by macrostates identified by CellRank 2. c. Projection of cell’s absorption probabilities towards identified macrostates. Cells colored by lineage annotation. d. CellRank 2 fate probabilities for heart fate visualized in spatial coordinates e. Spatial visualization of driver genes identified for the heart development lineage, Myh6 (top) and Gata4 (bottom).
Extended Data Fig. 6
Extended Data Fig. 6. Summary statistics and visualization of the pancreatic endocrinogenesis dataset.
a. Distribution of cell types per time point. b. UMAP embeddings based on graphs constructed from gene expression (left, Methods) and open chromatin accessibility (right, Methods).
Extended Data Fig. 7
Extended Data Fig. 7. Fev expression over pseudotime per lineage.
a. Normalized expression of Fev over pseudotime computed with cellrank.pl.gene_trends building on CellRank’s pseudotime kernel. b. Normalized gene expression of Fev and each islet hormone for the respective lineage plotted over pseudotime.
Extended Data Fig. 8
Extended Data Fig. 8. Similarity of cell types based on different modalities.
a. Aggregated correlation matrix of refined cell types based on processed gene expression, computed via scanpy’s dendrogram function, followed by scanpy.pl.correlation_matrix. The gene expression data was preprocessed by normalization (scanpy.pp.normalize_total) and log1p-transformation, followed by 30-dimensional PCA computation. b. Aggregated correlation matrix of cell types based on processed ATAC peak counts, computed via scanpy.tl.dendrogram followed by scanpy.pl.correlation_matrix. The peak counts were preprocessed using tfidf-transformation (muon.atac.pp.tfidf), followed by normalization and log1p-transformation, before computing a singular value decomposition and removal of dimensions which are highly correlated with library size. c. Aggregated correlation matrix of cell types based on both gene expression and open chromatin accessibility. After scaling both modalities to unit variance, the processed gene expression was concatenated with the processed LSI embedding.
Extended Data Fig. 9
Extended Data Fig. 9. NEUROD2 knockout experiments in human iPSCs-derived islet cells.
a. Insulin mean intensity and the number of SST-positive cells measured with immunostaining (Methods) for control, clone 37 and clone 89 (n = 4 independent experiments, standard error shown). b. Relative mRNA expression of Ins2, SSt, HHEX, and GCG measured with qPCR (n = 7 biologically independent samples for Ins2, Sst, n = 4 for Hhex, n = 7 for Gcg). We report mean and standard deviation (Methods), p-values obtained from one-sided ANOVA test with Tukey multiple comparison correction.
Extended Data Fig. 10
Extended Data Fig. 10. Delta and epsilon motif activity calculated with moscot.time.
a. Motif with cisBP identifier M09209_2.00, a marker motif identified for the delta population. For a motif to be active both the motif activity score (top) and the gene expression (associated transcription factor, here Isl1) should be high. Delta cells and their conjectured progenitors are underlaid in green (Supplementary Table 30). b. Motif with cisBP identifier M09438_2.00, which we identified to be a marker motif for the epsilon population (Supplementary Table 31). The motif is associated with the Tead1 transcription factor (Methods).

References

    1. Peyré, G. & Cuturi, M. Computational Optimal Transport: With Applications to Data Science (Now Publishers, 2019) 10.1561/9781680835519.
    1. Schiebinger, G. et al. Optimal-transport analysis of single-cell gene expression identifies developmental trajectories in reprogramming. Cell176, 928–943 (2019). - PMC - PubMed
    1. Nitzan, M., Karaiskos, N., Friedman, N. & Rajewsky, N. Gene expression cartography. Nature576, 132–137 (2019). - PubMed
    1. Zeira, R., Land, M., Strzalkowski, A. & Raphael, B. J. Alignment and integration of spatial transcriptomics data. Nat. Methods19, 567–575 (2022). - PMC - PubMed
    1. Cuturi, M. Sinkhorn distances: lightspeed computation of optimal transport. In Advances in Neural information Processing Systems 26 (eds Burges, C. J. et al.) 1– 9 (Curran Associates Inc., 2013).