. 2025 Feb;638(8051):823-828.
doi: 10.1038/s41586-024-08455-0. Epub 2025 Jan 22.

A map of the rubisco biochemical landscape

Affiliations

A map of the rubisco biochemical landscape

Noam Prywes et al. Nature. 2025 Feb.

Erratum in

  • Author Correction: A map of the rubisco biochemical landscape.
    Prywes N, Phillips NR, Oltrogge LM, Lindner S, Taylor-Kearney LJ, Tsai YC, de Pins B, Cowan AE, Chang HA, Wang RZ, Hall LN, Bellieny-Rabelo D, Nisonoff HM, Weissman RF, Flamholz AI, Ding D, Bhatt AY, Mueller-Cajar O, Shih PM, Milo R, Savage DF. Prywes N, et al. Nature. 2025 Feb;638(8052):E47. doi: 10.1038/s41586-025-08707-7. Nature. 2025. PMID: 39930266 Free PMC article. No abstract available.

Abstract

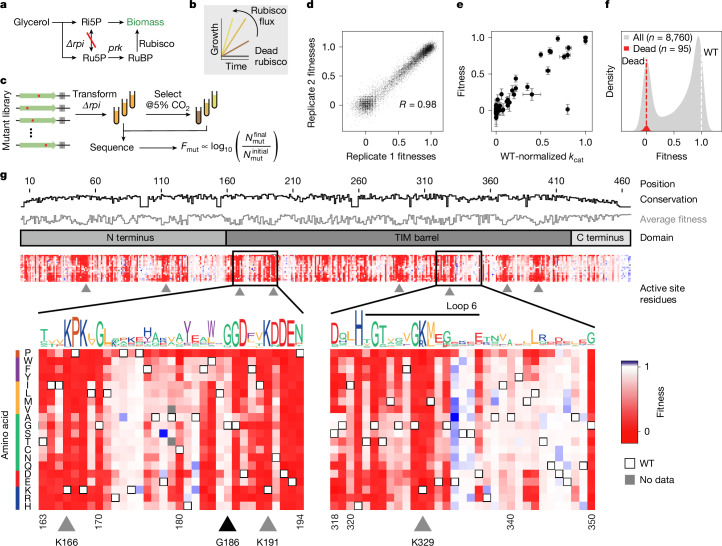
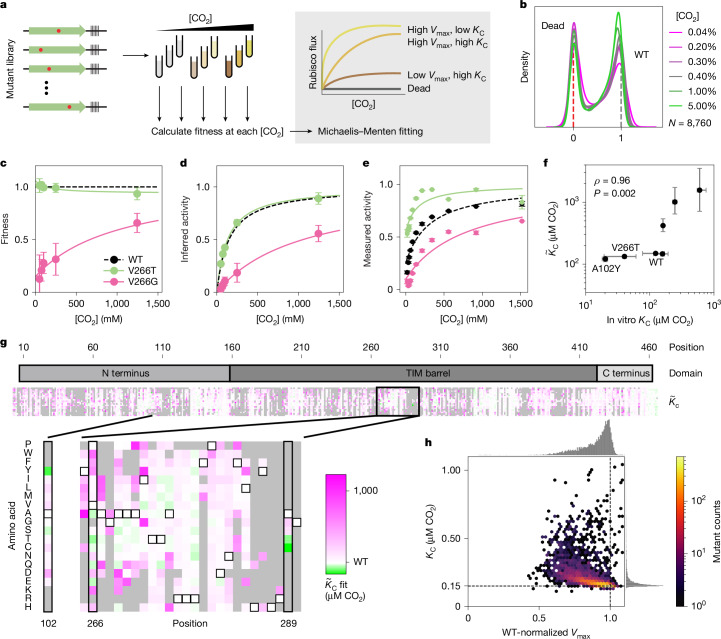
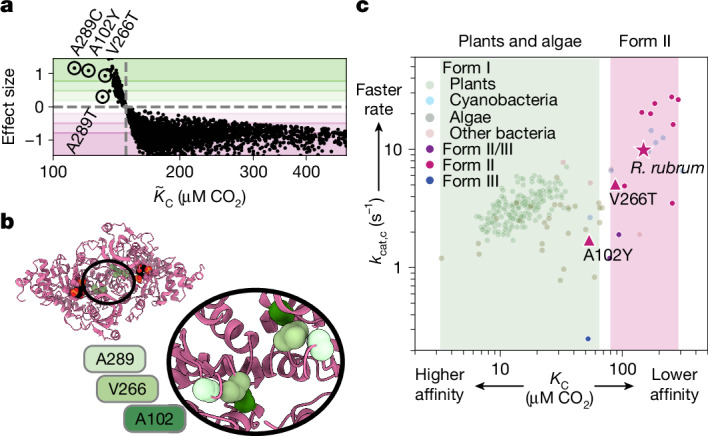
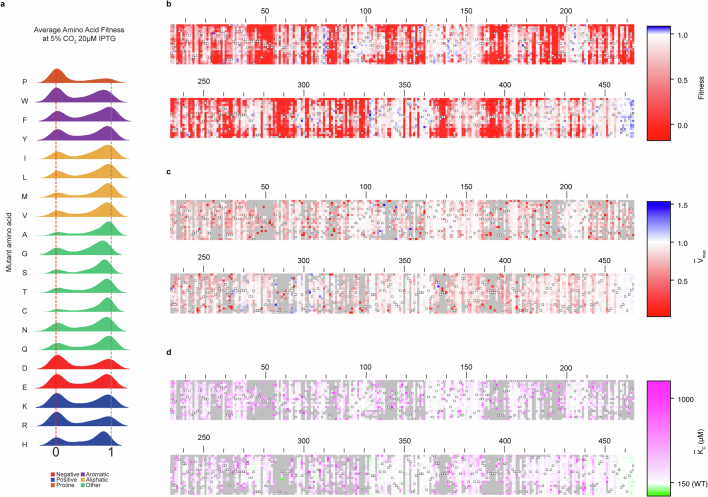
Rubisco is the primary CO2-fixing enzyme of the biosphere1, yet it has slow kinetics2. The roles of evolution and chemical mechanism in constraining its biochemical function remain debated3,4. Engineering efforts aimed at adjusting the biochemical parameters of rubisco have largely failed5, although recent results indicate that the functional potential of rubisco has a wider scope than previously known6. Here we developed a massively parallel assay, using an engineered Escherichia coli7 in which enzyme activity is coupled to growth, to systematically map the sequence-function landscape of rubisco. Composite assay of more than 99% of single-amino acid mutants versus CO2 concentration enabled inference of enzyme velocity and apparent CO2 affinity parameters for thousands of substitutions. This approach identified many highly conserved positions that tolerate mutation and rare mutations that improve CO2 affinity. These data indicate that non-trivial biochemical changes are readily accessible and that the functional distance between rubiscos from diverse organisms can be traversed, laying the groundwork for further enzyme engineering efforts.


Conflict of interest statement

Competing interests: D.F.S. is a co-founder and scientific advisory board member of Scribe Therapeutics. The other authors declare no competing interests.

Figures

Fig. 1
Fig. 1. A deep mutational scan individually characterizes all single-amino acid mutations in rubisco.
a, Summary of the metabolism of Δrpi—the rubisco-dependent strain. b, Δrpi grows with a rate proportional to the flux through rubisco. c, Schematic of library selection. A library of rubisco single-amino acid mutants was transformed into Δrpi then selected in minimal medium supplemented with glycerol at elevated CO2. Samples were sequenced before and after selection and barcode counts were used to determine the relative fitness of each mutant. d, Correspondence between two example biological replicates; each point represents the median fitness among all barcodes for a given mutant. e, Fitness of 77 mutants with measurements in previous studies compared with the rate constants measured in those studies (kcat). The outlier is I190T (see Methods for discussion). Fitness error values are the s.e.m. of nine replicate enrichment measurements; kcat errors are from the literature, where available. f, Variant fitnesses (grey) were normalized between values of 0 and 1, with 0 representing the average of fitnesses of mutations at a panel of known active site positions (red distribution, average is plotted as a red dashed line) and 1 representing the average of wild-type (WT) barcodes (white dashed line). g, Heatmap of variant fitnesses. Conservation by position and sequence logo were determined from a MSA of all rubiscos. Black triangle, G186 (an example of a position with high conservation that is mutationally tolerant); grey triangles, active site positions. Ri5P, ribose 5-phosphate; Ru5P, ribulose-5-phosphate; RuBP, ribulose-1,5-bisphosphate; TIM, triosephosphate isomerase.
Fig. 2
Fig. 2. Fitness values provide structural, functional and evolutionary insights into rubisco.
a, Structure of R.rubrum rubisco homodimer (Protein Data Bank (PDB) 9RUB) coloured by the average fitness value of a substitution at every site. Asterisks denote active sites. b, Variant effects for amino acids in different parts of the homodimer complex. c, Close-up view of the active site and the mobile Loop 6 region. Radar plots show the fitness effects of all mutations at a given position. d, Comparison of average fitness at each position against phylogenetic conservation among all rubiscos. Positions coloured as in b. Positions 215 and 257 form a tertiary interaction (Extended Data Fig. 8c), position 186 is highly conserved with no known function.
Fig. 3
Fig. 3. K~C and V~max can be inferred from fitness across a CO2 titration.
a, Schematic of rubisco selection in [CO2] titration and some examples of inferred Michaelis–Menten curves of mutants with varying KC and Vmax. b, Variant fitnesses at different [CO2]. c, Measured fitnesses at different [CO2] for two mutants (error bars, s.d. of the mean for N = 3 biological replicates). d, The same data as in c plotted under the assumptions of the Michaelis–Menten equation (error bars, s.d. of the mean for N = 3 biological replicates). e, Individually measured rubisco kinetics for the same two mutants from c and d (points, medians of N = 3 measurements; error bars, s.d.). f, Comparison between rubisco KC values measured in vitro (spectrophotometric assay) and those inferred from fitness values (K~C). ρ is calculated from a Spearman correlation; P value reflects the result of a two-sided permutations test analysis. K~C error bars, inner quartiles of the bootstrap fits (Methods); in vitro KC error bars, s.d. from N = 3 measurements. g, Heatmap of K~C values for all mutants for which the coefficient of variation is less than 1 (N = 5,687 mutants, 65% of total). Two positions with high-affinity mutations are highlighted in the inset expanded below. Variants for which the K~C fits had a coefficient of variation above 1 are in grey. h, Two-dimensional histogram of mutant K~C and V~max values from g with hexagonal bins. Dashed lines, WT values.
Fig. 4
Fig. 4. Single-amino acid mutations can traverse the functional landscape.
a, K~C versus effect size for each mutant. Effect size is the difference between the mutant K~C and WT KC divided by the coefficient of variation of K~C. b, PDB structure 9RUB; inset on the C2 symmetry axis is expanded below. Each position appears twice due to proximity to the C2 axis. c, kcat versus KC of the indicated mutants (as measured by 14C assay) versus all measured rubiscos from refs. ,). Shaded regions indicate known ranges of K~C values for plants and algae in green and Form II bacterial rubiscos in pink. Star, WT R.rubrum; triangles, mutants A102Y and V266T.
Extended Data Fig. 1
Extended Data Fig. 1. R. rubrum rubisco structure.
Left, Overall structure of the 2-large subunit (L2) homodimer with active sites and C2-symmetry axis labelled with a black two-fold axis symbol- formula image
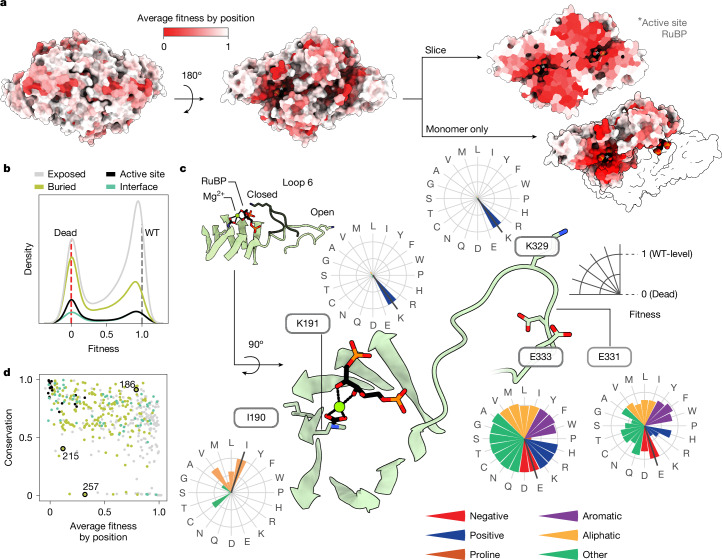
. (PDB: 9RUB). Centre, Ribbon diagram of one monomer with the 3 subdomains labelled. View is of the interfacial side. Right, Close-up view of the active site. Closed form of loop 6 is from the 8RUC structure. Active site residues and RuBP substrate are labelled.
Extended Data Fig. 2
Extended Data Fig. 2. Δrpi is a rubisco-dependent E. coli strain with a growth rate that correlates to rubisco flux.
a) Schematic of the Δrpi strain of rubisco-dependent E. coli. PRK and rubisco compensate for the deletion of RPI and rescue growth. b) Growth rates and yields across a titration of rubisco induction by [IPTG]. (N = 4) c) Growth rates and yields across a titration of [CO2]. Yields were calculated up to 40 h. (N = 4) d) A heatmap of growth rates across a two-dimensional titration of CO2 and IPTG. e) Growth rates and yields across a titration of [O2]. Yields were calculated between 15 and 40 h. The BW25113 contained the same plasmid as Δrpi but with GFP in place of rubisco. Growth rates could not be calculated for the control due to non-exponential growth behavior. (N = 6) f) Immunoblots for soluble rubisco with DnaK as a loading control. Left half is wild-type R. rubrum rubisco, right half is the higher-expressing I164T mutant. Samples are of Δrpi cells grown in selection media (see Methods) with different concentrations of IPTG. g) Growth rates of Δrpi cells expressing either WT or I164T rubisco grown in selection media with different concentrations of IPTG. (N = 4) h) Ratio of band intensities from f as a function of IPTG concentration. i) A panel of mutants from the literature and their associated kcat measurements normalised to WT. The WT value is ≈11/s. j) Growth curves of Δrpi expressing the mutants from i. Colouring in i and j is on the same scale and reflects kcat values from the literature. k) Growth rate values calculated from the curves in j, plotted against the normalised kcat values. l) Raw barcode-averaged mutant enrichment values for the same mutants as in k measured in one nanopore sequencing experiment. Error bars in b, c, g and e determined from the SEM of at least four replicates. Error bars in k determined as standard deviations of three or more replicates. Error bars in l determined as standard deviations of three different barcodes (N = 3) for each mutant. Errors in literature values are shown from studies where they were reported.
Extended Data Fig. 3
Extended Data Fig. 3. Library construction and characterization pipeline.
a) Library construction procedure. Step 1) Clone a codon-optimised R. rubrum rubisco sequence into pUC19. Step 2a) Choose locations to split the gene which are appropriate for the cloning of subpool libraries. Step 2b) PCR amplify the sub-libraries from an oligo pool containing all 8778 mutations. Step 3) PCR amplify the backbone with a space missing for the ligation of an oligo subpool. Step 4) Ligate each oligo subpool to its appropriate backbone. Step 5) Combine the sub libraries, cut the full, mutated genes out and ligate them into a PCR-amplified and barcoded backbone. After transformation scrape the desired number of colonies for selection. b) Library sequencing strategy. The library was characterised by long read sequencing. Barcode abundances were measured by short-read sequencing before and after selection (see methods).
Extended Data Fig. 4
Extended Data Fig. 4. Library characterization by long-read sequencing.
a) A histogram of reads of plasmids from PacBio sequencing. The y-axis represents the number of reads of plasmids with a given number of reads (i.e. the bar at 50 on the x-axis is as tall as the number of reads of barcodes with 50 reads). We were able to generate a consensus sequence for any barcode with more than 1 read leaving us with 327,149 possible barcodes. b) A rarefaction plot estimating the overall library complexity, a negative binomial distribution was fit and we estimated a real library complexity of ≈180,000 barcodes. c) A plot of how many mutants (of the possible 19) were in our library at each position (black dashes, left axis) and how many barcodes (green dashes, right axis). d) A heatmap of how many barcodes were characterised for each mutation. e) A histogram of mutants by how many barcodes they had. f) Statistics on the completeness of the library. Overall we had >99% of the mutations in our lookup table.
Extended Data Fig. 5
Extended Data Fig. 5. Pairplots of replicate fitness values.
Fitness values for each mutant are calculated as described in the methods for each replicate individually. These replicates are 3 sets of technical replicates of 3 biological replicates. Replicates 1, 4 and 7 are technical replicates (same with 2/5/8 and 3/6/9). Replicates 7–9 were collected on a different day. Pearson correlations reported for each pair of replicates. The distribution of fitness values is reported along the diagonal and pairwise correlations are reported between replicated off the diagonal. Pearson R is reported in the bottom-left half.
Extended Data Fig. 6
Extended Data Fig. 6. Comparisons between biochemically measured rubisco kinetic parameters and those same parameters as inferred from fitness values.
a and b) Fitness vs. kcat values, fitness error is the standard error of the mean for 9 replicates, c and d) K~C vs. KC values, K~C error bars reflect the inner quartiles of the bootstrap fits (see Methods). Measurements are from the literature in a and c, values are measured in this study by the spectrophotometric assay in b and d. Black points in b were purified 3 independent times (x-axis error bars are standard error), all other data in grey are from individual purifications and have no errors reported. Inset shows mutants with fitness values near or above 1 (WT-level). Dashed line indicates a 1:1 correspondence between fitness and in vitro measurements, WT is indicated with a square. X-axis error bars in a and c are taken from the literature when available. X-axis errors in d and Y-axis errors in a-d are explained in the methods. N = 3 biological replicates in all cases. Outlier mutation is labelled in a and b and is discussed in Methods. Red indicates K~C estimates with coefficient of variation >1. e) K~C coefficient of variation as a function of fitness. f) V~max coefficient of variation as a function of V~max. g) K~C coefficient of variation as a function of fitness V~max coefficient of variation. h) Correlation of V~max and Fitness. Only mutants with a coefficient of variation <1 are plotted here; mutants with coefficients of variation >1 typically have low fitness and are thus harder to fit to a Michaelis-Menten model.
Extended Data Fig. 7
Extended Data Fig. 7. Histograms of fitness effects of mutations to each amino acid individually.
a) A histogram of fitness effects of all mutations to the specified amino acid (i.e. the plot for proline is the histogram of the fitness effects of mutations to proline at each position where there isn’t a proline naturally). Plots are coloured by the biophysical properties of the amino acids. b) A heatmap of all fitness values. Fitness is the normalized enrichment value for selections carried out at 5% CO2 with 20 μM IPTG. c) A heatmap of all V~max values. d) A heatmap of log(K~C) values. K~C has units of μM CO2.
Extended Data Fig. 8
Extended Data Fig. 8. “Recent” evolution of a tertiary contact and phylogenetic comparisons.
a) Conservation vs. Tolerance among bacterial Form II rubiscos. As in Fig. 2c, mutational tolerance is the average fitness effect of all mutations at a given position. Here conservation is determined from an MSA of all Form II bacterial rubiscos (see methods). P-value is determined from the Spearman correlation and is thus a two-sided test. Positions 215 and 257 form a tertiary contact in R. rubrum and other Form II rubiscos and are thus more conserved than among all rubiscos. b) Alignment of 9RUB and 8RUC, R. rubrum (green) and spinach (orange) rubisco respectively. c) Rotated view and zoom of M215 and H257 from R. rubrum. The loop containing them in R. rubrum is truncated in spinach. d) Pairwise identities between rubisco sequences across Forms. Representative rubisco sequences from were compared for pairwise identity. Form I sequences were picked to have a maximum sequence identity between one another of 85% in order to sample sequences more evenly (out of fear of oversampling plant sequences). Form II and III sequences were chosen randomly.
Extended Data Fig. 9
Extended Data Fig. 9. Specificity and KM,RuBP measurements for A102Y and V266T.
a) Specificity values measured by Membrane Inlet Mass Spectrometry (N = 3 for each mutant measured in this study). Comparisons to literature values are displayed when available. Literature data for WT is from. Error bars represent the SEM of all measurements compiled in that published analysis. Literature data for H44N and D117V is from. Error is taken from Extended Data Table 2 in that publication. P-values reflect a Welch’s two-sided t-test in comparison to WT, with a permutation test to determine P-values. Red numbers indicate P > 0.05. b) KM,RuBP values fit from spectrophotometric assays of rubisco carboxylation along an 8 point RuBP titration. Each point in the titration was measured in technical triplicate. Error bars indicate the square root of the diagonals of the covariance matrix during fitting. All three triplicate measurements were used to perform the fit.

Update of

References

    1. Bar-On, Y. M. & Milo, R. The global mass and average rate of rubisco. Proc. Natl Acad. Sci. USA116, 4738–4743 (2019). - PMC - PubMed
    1. Bar-Even, A. et al. The moderately efficient enzyme: evolutionary and physicochemical trends shaping enzyme parameters. Biochemistry50, 4402–4410 (2011). - PubMed
    1. Bouvier, J. W., Emms, D. M. & Kelly, S. Rubisco is evolving for improved catalytic efficiency and CO2 assimilation in plants. Proc. Natl Acad. Sci. USA121, e2321050121 (2024). - PMC - PubMed
    1. Bathellier, C., Tcherkez, G., Lorimer, G. H. & Farquhar, G. D. Rubisco is not really so bad. Plant Cell Environ.41, 705–716 (2018). - PubMed
    1. Prywes, N., Phillips, N. R., Tuck, O. T., Valentin-Alvarado, L. E. & Savage, D. F. Rubisco function, evolution, and engineering. Annu. Rev. Biochem.92, 385–410 (2023). - PubMed

MeSH terms

Substances