. 2025 Mar;639(8054):483-492.
doi: 10.1038/s41586-024-08466-x. Epub 2025 Jan 22.

Tissue-resident memory CD8 T cell diversity is spatiotemporally imprinted

Affiliations

Tissue-resident memory CD8 T cell diversity is spatiotemporally imprinted

Miguel Reina-Campos et al. Nature. 2025 Mar.

Abstract

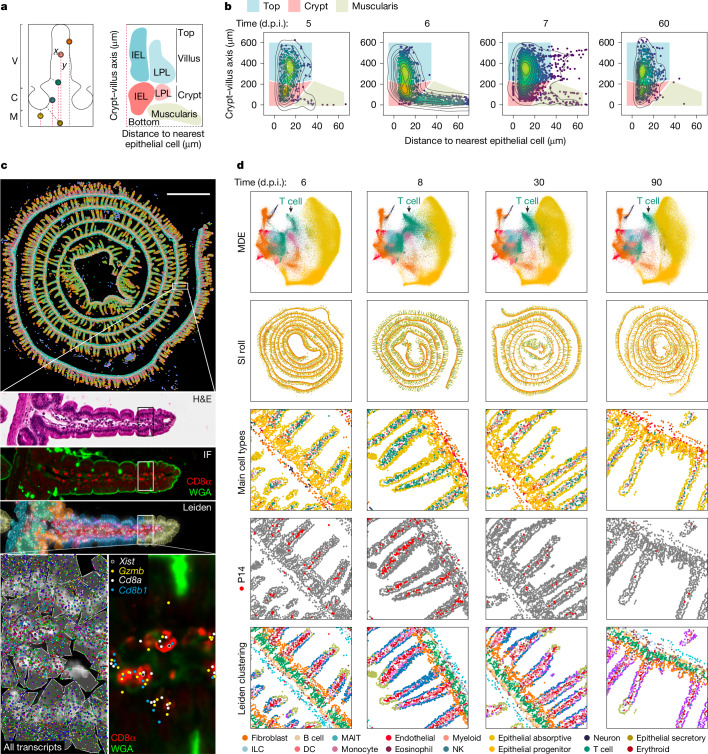
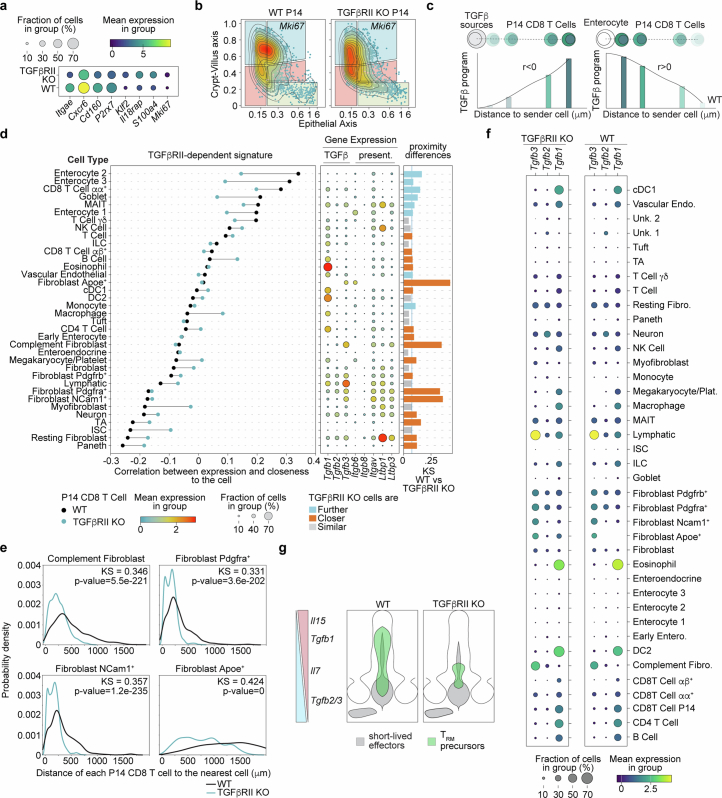
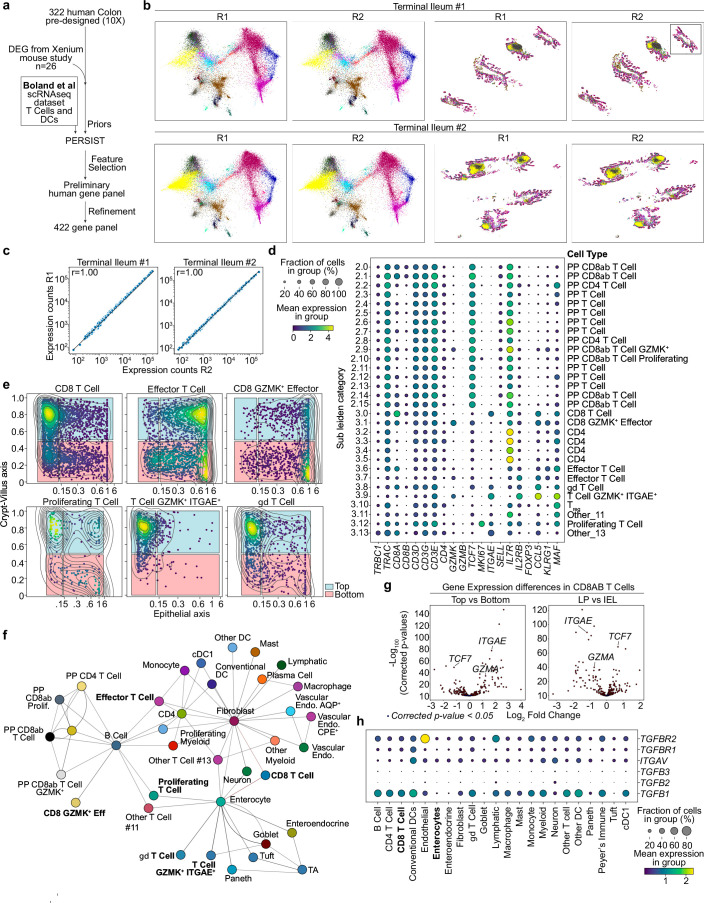
Tissue-resident memory CD8 T (TRM) cells provide protection from infection at barrier sites. In the small intestine, TRM cells are found in at least two distinct subpopulations: one with higher expression of effector molecules and another with greater memory potential1. However, the origins of this diversity remain unknown. Here we proposed that distinct tissue niches drive the phenotypic heterogeneity of TRM cells. To test this, we leveraged spatial transcriptomics of human samples, a mouse model of acute systemic viral infection and a newly established strategy for pooled optically encoded gene perturbations to profile the locations, interactions and transcriptomes of pathogen-specific TRM cell differentiation at single-transcript resolution. We developed computational approaches to capture cellular locations along three anatomical axes of the small intestine and to visualize the spatiotemporal distribution of cell types and gene expression. Our study reveals that the regionalized signalling of the intestinal architecture supports two distinct TRM cell states: differentiated TRM cells and progenitor-like TRM cells, located in the upper villus and lower villus, respectively. This diversity is mediated by distinct ligand-receptor activities, cytokine gradients and specialized cellular contacts. Blocking TGFβ or CXCL9 and CXCL10 sensing by antigen-specific CD8 T cells revealed a model consistent with anatomically delineated, early fate specification. Ultimately, our framework for the study of tissue immune networks reveals that T cell location and functional state are fundamentally intertwined.


Conflict of interest statement

Competing interests: M.R.-C. is a co-founder, scientific adviser and board member of TCura Bioscience, Inc. A.F. is a co-founder, CEO and board member of TCura Bioscience. B.B. receives consulting fees from Bristol Myers Squibb and Pfizer and research grants from Merck and Gilead. A.W.G. is a co-founder of TCura Bioscience, Inc. and serves on the scientific advisory board of ArsenalBio and Foundery Innovations. The other authors declare no competing interests.

Figures

Fig. 1
Fig. 1. Characterization of the spatial and transcriptional state of antigen-specific CD8 T cells in response to acute viral infection in the mouse SI with spatial transcriptomics.
a, Left, a coordinate system to define morphological axes in the SI. C, crypt; M, muscularis; V, villus. Right, the distance to the nearest epithelial cells and the distance to muscularis form the basis of an IMAP. The top of the villus and the crypt regions house both intraepithelial lymphocytes (IEL) and lamina propria lymphocytes (LPL). b, An IMAP representation of P14 T cell localization measured by immunofluorescence (staining at the indicated days after infection. Two biological replicates for n = 3 mice per timepoint, representative data from one mouse are shown. The gates for the top of the villus (blue), the crypt (red) and the muscularis (beige) highlight the different regions. The points, representing cell positions, are coloured by kernel density estimates over the IMAP (x, y) coordinates. c, An overview of the Xenium-based spatial transcriptomics data structure: row 1, Xenium output of a mouse intestine (8 d.p.i.), with cells coloured by Leiden cluster; row 2, a magnification of a villus showing H&E staining; row 3, confocal immunofluorescence images of CD8α and WGA; row 4, Xenium DAPI staining with cell boundary segmentation masks coloured by Leiden cluster; row 5, a further subregion magnification of the same villus depicting Xenium DAPI staining overlaid by cell boundary segmentation and all transcripts assigned to cells (left) and an immunofluorescence image of CD8α and WGA overlaid with transcript locations for Cd8a, Cd8b, Gzmb and female P14-specific Xist transcript locations overlaid (right). d, An overview of the processed Xenium data of mouse SI at 6, 8, 30 and 90 d.p.i. (columns): row 1, cells in a joint minimum distortion embedding (MDE) of all SI Xenium samples coloured by cell type; row 2, in situ spatial positioning of the cells; rows 3–5, magnifications coloured by cell type (row 3), with P14 clusters/cells highlighted in red (row 4) and coloured by Leiden cluster (row 5). One of two biological replicates for each timepoint is shown. DC, dendritic cell; ILC, innate lymphoid cell; MAIT, mucosal-associated invariant T; NK, natural killer cell.
Fig. 2
Fig. 2. Intestinal regionalization along key axes informs TRM cell diversity in the mouse intestine.
ac, The spatial position and joint MDE embedding, coloured by their crypt–villus axis position (a), longitudinal axis position (b) and epithelial axis position (c). One of two biological replicates for each timepoint is shown. d, IMAPs of P14 CD8 T cells in samples from each timepoint (one of two replicates for each timepoint), with coloured gates dividing the top, crypt and muscularis (left) and the number of P14 CD8 T cells positioned in each gate across timepoints (two biological replicates for each timepoint) (right). Data are mean ± s.e.m. e, Combined time-course samples (n = 8, four timepoints with two biological replicates each) were pooled to create a swarm plot of Spearman rank correlation coefficients (ρ) between each axis and every gene expressed in at least 5% of P14 cells, with select correlated genes annotated. Genes are considered positively correlated (red) when ρ > 0.05, negatively correlated (blue) when ρ < −0.05 and not correlated (grey) otherwise. f, The convolved gene expression of P14 CD8 T cells along the crypt–villus axis at every timepoint (n = 2 pooled biological replicates). g, IMAP representations of P14 CD8 T cells at 90 d.p.i. coloured by kernel density estimates weighted by expression counts of select genes (one of two biological replicates is shown). h, The expression of each gene in IMAP-gated regions of P14 CD8 T cells at 90 d.p.i. (n = 2 replicates, R1 and R2). i, The convolved gene expression of P14 CD8 T cells along the epithelial axis at every timepoint (n = 2 pooled biological replicates). j, IMAP representations of P14 CD8 T cells at 90 d.p.i. (one of two biological replicates is shown) coloured by kernel density estimates weighted by UCell signature enrichment of progenitor-like TRM cells (cluster 3 (ref. )) and differentiated TRM cells (terminal state, cluster 29) with signature scores in IMAP-gated regions (n = 2). IE, intraepithelial; LP, lamina propria; Max., maximum; Min., minimum.
Fig. 3
Fig. 3. Differential cytokine gradients and cellular communities across intestinal niches.
a,b, A representation of the connectome between cell subtypes at an individual cell resolution in a villus at 8 d.p.i. (a) and an aggregated network format in which edges between nodes represent a normalized Squidpy interaction score lying above a 0.1 threshold (10% of the connections) (b). Node (x, y) positions were determined by running a Kamada–Kawai layout algorithm on the Squidpy interaction matrix of the two replicates at 8 d.p.i. Positions were visualized using igraph. For each timepoint, the interaction scores between nodes are averaged across the two biological replicates. c, Squidpy interaction scores between cell subtypes and P14-cell regional groupings—top, crypt and muscularis as depicted in Fig. 2d. The colour of the heat-map position reflects the strength of contact. Interaction scores are averaged across the eight samples, and values are row-normalized. d, The convolved gene expression of cytokines along the crypt–villus axis ordered and displayed with scVelo pooled across all time-course samples for all cells (n = 8). e, Gene expression trends for TGFβ isoforms separated by timepoint (n = 2 biological replicates pooled) with representative TGFβ isoform expression depicted spatially at their positions on a villus from a SI (8 d.p.i.). A generalized additive model is used to fit a curve to the expression counts of each ligand along the crypt–villus axis, followed by z-score scaling for comparison across trends. f, A heat map showing the pathways contributing the most to incoming signalling of each P14-cell regional grouping. The relative strengths of each pathway were calculated using spatial CellChat on n = 2 samples from four timepoints. g, The spatiotemporal differentiation model for intestinal TRM cells. ISC, intestinal stem cell; cDC1, conventional type 1 dendritic cell; Comp, complement.
Fig. 4
Fig. 4. CXCR3 promotes the early accumulation of short-lived effector cells in the lamina propria, lower villus area and muscularis.
a, A dot plot of Cxcl9 and Cxc10 expression in the indicated cells for time courses with and without infection. b, Gene expression trends for Cxcl9 and Cxcl10 (Cxcl9/10) separated by timepoint (n = 2 biological replicates pooled), with representative expression depicted spatially at their positions on the villus. Scale bar, 50 μm. c, sgRNA-containing P14 CD8 T cells (yellow arrows, middle image) shown spatially in the intestinal villus at three levels of magnification as detailed by white rectangles from left to right. The left image is coloured by graph-based clustering. The red line (right image) indicates nuclear segmentation. Scale bar, 5 μm. d, The gene expression of each sgRNA-containing P14 CD8 T cell. n = 2 pooled biological replicates with 1,548 sgCd19, 1,030 sgThy1 and 562 sgCxcr3 cells. Pairwise two-sided t-tests with Benjamini–Hochberg test correction. ***P < 0.001. e, An IMAP representation of each sgRNA-containing P14 CD8 T cell population with annotated percentages in each gate. f, The gene expression of each sgRNA-containing P14 CD8 T cell split by spatial gate. n = 2 pooled biological replicates with cell numbers per gate shown in Supplementary Table 12. Pairwise two-sided t-test of the mean expression levels, with Benjamini–Hochberg correction. *P < 0.05, **P  < 0.01. Data are presented as mean ± s.e.m. (d,f). g, The proposed mechanism of CXCR3-dependent CD8 T cell villus distribution. KO, knockout; WT, wild type.
Fig. 5
Fig. 5. CD8 T cell phenotypic diversity in the human ileum is spatially imprinted.
a,b, Spatial transcriptomics of two human terminal ileum sections using 10x Xenium: joint MDE embedding coloured by cell type (a) and mean relative frequencies of each cell type pooled across all sections (b). Data show mean ± s.e.m. Two adjacent sections per donor. c, An overview of the human Xenium data. From left to right: terminal ileum with cell masks coloured by cell type; villus magnification showing H&E staining and Xenium DAPI staining with cell boundaries overlaid and coloured by Leiden cluster, crypt–villus axis and epithelial distance; further zoom-in showing Xenium DAPI with cell masks and detected transcripts and select transcripts overlaid over DAPI staining (1 representative of n = 1,423 CD8αβ T cells). Scale bar, 300 μm. d, An IMAP representation of CD8αβ T cells coloured by kernel density estimates weighted by mouse P14 cell signatures at the top of the villus (left) or or crypt (right). The human IMAP gates define the top villus (blue) and crypt (red), split into intraepithelial (left) and lamina propria (right). CD8αβ T cells were pooled across all replicates (n = 1,423); Peyer’s patches (PP) excluded. e,f, The convolved gene expression of CD8αβ T cells along the crypt–villus axis (e) and epithelial axis (f). All human samples were pooled (n = 2 donors, two adjacent sections each), excluding Peyer’s patches. g, The expression of select genes in CD8 T cells are Spearman rank correlated with distances to other cell types. Red indicates that expression increases when CD8 T cells are near, whereas blue indicates that expression decreases. Correlations calculated per sample (n = 4); mean coefficient shown. h, A heat map showing the top pathways contributing to incoming signalling of different immune cell groupings. Relative strengths calculated using spatial CellChat on all human samples. The heat map was column-normalized across all cell subtypes; only specific immune subtypes are shown. CD8αβ T cells grouped as effector or stem-like on the basis of enrichment of mouse-derived UCell signatures. Enrichment z-scored before classifying CD8αβ T cells. CLEC, C-type lectins; Treg, T regulatory cell.
Extended Data Fig. 1
Extended Data Fig. 1. Related to Fig. 1. Targeted detection of LCMV-specific CD8 T cell responses in the mouse small intestine with spatial transcriptomics.
a, Schematic of the experimental workflow for mouse takedown at progressing timepoints post infection (p.i.) with LCMV. An object classifier in QuPath is used to identify P14 and epithelial cells from IF staining of intestinal sections. (1 representative field of view out of n > 20 similar) b, Diagram of the methodology used to design the Xenium mouse SI probe panel. Using snRNA-seq data from the mouse small intestine, a 350 gene set was designed to maximize Adjusted Rand Index (ARI) and Adjusted Mutual Information (AMI) scores of classifier-derived Leiden cluster predictions. c, Genes least informative for predicting cell type are continuously pruned using recursive feature elimination with ARI and AMI of classifier-derived Leiden cluster predictions calculated at each pruning step. d, Pearson residual correlations of total gene abundances between timepoint biological replicates. e, Snapshots from a Xenium spatial transcriptomics day 6 small intestine show unique cell types in close spatial proximity. Canonical cell type marker gene transcript positions are colored to show a (from left to right) P14 T Cell (Xist+Cd8α+Cd3e+) and cDC1 (Clec9a+Xcr1+), P14 T Cell and Endothelial (Pecam1+), P14 T Cell and Fibroblast (Acta2+), P14 T Cell and Lymphatic (Lyve1+), and Cd8α T Cell (Cd8α+Cd3e+) and Neuron (Rbfox3+). Predicted cell segmentation boundaries are colored by the “Type” annotation. f, Cell type frequency percentages across n = 2 replicates per timepoint. g, Absolute cell numbers quantified by flow cytometry for the indicated cell types and time points after LCMV infection (n = 5). Two-way ANOVA with Dunnett’s method. Bars indicate the mean +/- SEM. ***p-value < 0.001. h, Xist expression within detected P14 CD8 T cells (Xist+) at each time point (n = 13000, n = 8412, n = 1155, n = 433 cells in 6 dpi, 8 dpi, 30 dpi, and 90 dpi respectively across 2 biological replicates per time point). Pairwise t-tests on the mean expression values with Benjamini-Hochberg correction applied ***p-value < 0.001. i, Experimental design for a female:male P14 CD8 T cell transfer in B6 mice. j, Relative frequencies of female to male ratios in the indicated tissues 30 days p.i. Unpaired two-sided t-test with Tukey’s HSD, *p-value < 0.05. Data are presented as the mean +/− Tukey’s HSD confidence interval. k, Frequency of P14 CD8 T cells by sex and CD103 and CD69 expression analyzed by flow cytometry in the indicated tissues 30 days p.i. Unpaired t-test with Tukey’s HSD. No significant p-values detected. Data are presented as the mean +/− Tukey’s HSD confidence interval. 2 independent biological duplicates of n = 3 and n = 5 specimens are pooled (j and k). Panels a and i reproduced from ref. . Source Data
Extended Data Fig. 2
Extended Data Fig. 2. Related to Fig. 2. Spatial framework of the mouse intestinal villus shows cell positioning dynamics over time after an LCMV infection.
IMAPs of all cell subtypes from each time point (two biological replicates for each time point combined), with colored gates dividing the top IE, top LP, crypt IE, crypt LP, and muscularis.
Extended Data Fig. 3
Extended Data Fig. 3. Related to Fig. 2. Spatial transcriptional patterning of mouse intestinal cells over the course of an LCMV infection revealed by spatial transcriptomics.
a, Frequency of P14 CD8 T cells present in binned segments of equal length of the longitudinal axis for n = 2 replicates per time point. b, Heatmap depicting the percentage of genes in every cell subtype correlated with each axis using all combined time course samples (n = 8). Heatmap colors indicate for all genes expressed in a particular cell type, few of them correlate with the corresponding axis (white), or most of them correlate with the corresponding axis (dark red). c, UCell enrichment of epithelial zonation signatures in epithelial cells from pooled Xenium replicates ordered by crypt-villus axis position. Signatures are the top 30 differentially expressed, overlapping genes per zone. d, UCell enrichment of proximal and distal epithelial signatures in epithelial cells from each Xenium replicate, binned and ordered by longitudinal position. Zwick signatures include all overlapping genes with Spearman’s ρ > 0.5 between expression and longitudinal segment order. e, IF staining of CD8α, TCF1 and GZMB of a mouse intestine 30 days after LCMV infection. Representative picture of 3 independent samples. Scale bars are 2 μm. f, Gene expression of indicated genes for P14 CD8 T cells grouped by the spatial gates shown in Fig. 2d over time; n = 2 replicates per time point. g, Gene expression of indicated genes for intestinal P14 CD8 T cells over time after an LCMV infection profiled by scRNA-seq. h, IMAPs of day 90 P14 CD8 T cells (one of two biological replicates) colored by Blimp1high differentiated and Id3high progenitor-like TRM signatures enrichment derived from Milner et al.
Extended Data Fig. 4
Extended Data Fig. 4. Related to Fig. 3. Immune response to LCMV profiled by whole-transcriptome spatial sequencing of the mouse small intestine.
a, VisiumHD results on mouse small intestine roll 8 days after LCMV infection colored by graph-based clustering. b, VisiumHD spots colored by imputed crypt-villus axis values. c, Ratios of overlapping gene expression at the top vs. bottom in epithelial cells from day 8 pi Xenium and VisiumHD dataset. r: Pearson correlation coefficient. d, Convolved gene expression of cytokines along the imputed crypt-villus axis in the VisiumHD dataset. Red labels indicate genes that were included in the Xenium gene panel. e, Transcript reassigning based on H&E nuclei segmentation to achieve single-nuclei level gene expression data (left) and example (right). Reg3b is plotted to showcase the single-nuclei level data. f, Incoming signals across CD8αβ regional subtypes in the VisiumHD dataset.
Extended Data Fig. 5
Extended Data Fig. 5. Related to Fig. 3. Spatial immune landscapes of the healthy mouse small intestine.
a, Pearson residual correlations of total gene abundances between biological replicates of an uninfected mouse intestine profiled by Xenium. b, Convolved gene expression by all cells along the crypt-villus and epithelial axes. 2 biological replicates combined. c, Cell type interaction igraph of the uninfected mouse small intestine. 2 biological replicates combined. d, IMAP of CD8αβ T cells in the uninfected small intestine. 2 biological replicates combined. e, expression IMAP for indicated genes in the uninfected intestine. 2 biological replicates combined. f, Convolved gene expression within uninfected CD8αβ T cells along the crypt-villus axis.
Extended Data Fig. 6
Extended Data Fig. 6. Spatial control of TGFβ signaling controls SI CD8 T cell positioning and differentiation.
a, CellChat circle plots showing top enriched interactions between TGFβ isoform senders and regionally gated P14 receivers across all 8 SI samples (4 timepoints, 2 replicates each). Each cell subtype is represented by a node, and a directed edge is displayed from a top sender subtype to a receiver P14 regional subtype for significant TGFβ sender-P14 interactions. b, Violin plots depicting the log-normalized TGFβRI and TGFβRII expression counts within P14s across each timepoint. Violins are plotted with Scanpy, scaled by width, and black dotted lines mark expression quartiles. c, The expression of TGFβ isoforms and genes involved in TGFβ presentation as measured by Xenium. d, Female wild type or TGFβR2 KO P14 cells were transferred into male C57BL/6 recipients. MERSCOPE-based spatial transcriptomics of the SI was done on day 8 after LCMV infection. One WT and one TGFBR2KO SI were profiled from one biological replicate with 3 mice per condition. Plots show the joint MDE embedding colored by cell type (top), in situ spatial positioning of the cells (middle), and close-ups (bottom). e, Schematic for MERSCOPE gene panel design process. Most important genes for defining cell types were identified using XGBoost on a group of immune datasets, before adding biologically important genes and filtering out MERSCOPE-incompatible genes. f, (left) IMAP positioning and kernel density estimate (weighted by gene expression, bottom) coloring of WT and TGFβR2 KO P14 cells. Cells are gated into top intraepithelial, top lamina propria, crypt intraepithelial, crypt lamina propria, and muscularis. (middle) Quantification of P14 cells localized in the muscularis, crypt or top of villus. (right) IMAP colored by kernel density estimates weighted by expression counts of Itgae. g, Contacting P14s and conventional dendritic cells in zoomed-in regions of the SI. DAPI staining is overlaid with scattered points representing the positions of select transcripts. h, Change in frequency of each cell type between WT and TGFβR2 KO conditions. Frequency values reflect proportional increases or decreases of TGFβR2 KO cell type counts relative to WT. i, IMAPs of WT and TGFβR2 KO P14 T cells colored by enrichment of the core TRM signature from Milner et al., and the TGFβ program derived from Nath et al..
Extended Data Fig. 7
Extended Data Fig. 7. Spatial control of TGFβ signaling controls SI CD8 T cell positioning and differentiation.
a, Top differentially expressed genes between WT and TGFβR2 KO P14 cells. The dot plot is colored by the mean expression of each gene, and the dot size reflects the percentage of P14 cells in which the corresponding gene is expressed. b, IMAP representations of WT and KO P14 cells colored by kernel density estimates weighted by expression counts of the proliferation marker Mki67. c and d, TGFβR2 dependent signature enrichment and distance to each cell subtype were calculated for all P14 cells, and Spearman rank correlated against each other (c). (d) For every subtype, (left) the correlation coefficients between signature enrichment and P14 cell proximity to the subtype among both WT and TGFβR2 KO P14 CD8 T cells, (middle) the expression of TGFβ isoforms and genes involved in TGFβ presentation in the WT sample, and (right) a non-parametric two-sided Kolmogorov–Smirnov statistic indicating the significance of difference of the distance distributions between P14 CD8 T cells and the corresponding cell type in both WT and TGFβR2 KO. The color of the bars indicates whether P14 CD8 T cells are closer to a given cell type in WT (blue) or TGFβR2 KO (red), and a line indicating effect relevance is positioned at 0.08. Supplemental Table 8 presents the cell counts used in the statistical test for the n = 1 experiment across each condition. e, Comparisons of the distance between WT or TGFβR2 KO P14 cells and selected other cell subtypes. A two-sided Kolmogorov–Smirnov statistic indicates the difference between the WT and KO distributions for each subtype. The plotted lines show the positional density using a 1D kernel density estimate. f, A comparison of TGFβ isoform expression between cell subtypes in WT and TGFβR2 KO. g, Proposed mechanism of TGFβ-dependent upward TRM differentiation.
Extended Data Fig. 8
Extended Data Fig. 8. Related to Fig. 4. Optical readout of sgRNA-containing antigen-specific CD8 T cells in the mouse intestine integrated in the Xenium assay.
a, Flow cytometry histograms showing quantification of Thy1 and CXCR3 of Cas9eGFP P14 CD8 T cells transduced with Thy1 and Cxcr3-targeting sgRNAs. Representative of two independent biological replicates. b, Dot plot gene expression of the three least expressed genes in the 350 gene panel for all cells in the small intestine, all time points and replicates (n = 8) combined. c, Frequency of CD8 T cells containing one, two or three different sgRNAs. 2 biological duplicates combined. d, Expression of pseudo-gene barcodes in the perturbed day 8 small intestine. e, Capture of pseudo-gene barcodes along the spatial areas of the small intestine defined by IMAP for each perturbation. Two-sample t-test of the mean expression levels, with Benjamini-Hochberg correction applied, *p-value < 0.05. Sample sizes shown in Supplemental Table 12.
Extended Data Fig. 9
Extended Data Fig. 9. Related to Fig. 5. Immune landscape of the human small intestine revealed by spatial transcriptomics.
a, Schematic for designing the Xenium human SI gene panel. The Xenium base human colon panel was expanded with canonical immune genes, the human homologs of top spatially differentially expressed genes from the Xenium mouse data, and computationally derived genes that best capture the heterogeneity within immune cell types found in scRNA-seq data from Boland et al. b, Xenium processed terminal ileum samples divided into two rows corresponding to the two human donors. Adjacent tissue sections were taken from both donors and are positioned side-by-side within the joint MDE embedding (left) and spatially (right). Cells are colored by their annotations in Fig. 5a. c, Scattered raw gene expression abundances between the technical replicates of both human ileums overlayed with a line of best fit. The Pearson residual correlation coefficient (r) is calculated between the gene abundances of both samples. d, Expression of genes used to annotate immune subtypes. Colors of dots indicate the mean expression of the gene in each subcluster, and size of the dots correspond to the percentage of cells in each subcluster expressing the gene. The final cell subtype annotations of each subcluster are shown as y-ticks along the right side of the plot. e, IMAP positioning of select T-Cell subtypes within all (n = 4) human sections (Peyer’s Patches excluded). Cells are colored by kernel density estimates of their coordinate location within the IMAP. IMAP gates are positioned as in Fig. 5d. f, Aggregated physical interaction network where edges between nodes represent a normalized Squidpy interaction score lying above a 0.1 threshold (10% of the connections). Nodes are positioned using a Kamada-Kawai layout algorithm on the averaged interaction matrix of all human sections. g, Differential expression testing of all genes expressed in at least 5% of human CD8αβ T Cells using diffxpy. A two-tailed Wald test yielded a fold change and adjusted p-value (padj) for each gene (X) between human CD8αβ T cells gated in the crypt versus those gated in the top of the villus, and (X) human CD8αβ T cells gated intraepithelial versus those gated in the lamina propria. All genes are plotted by their log2 fold change and -log100(padj), and significantly differentially expressed genes (padj <0.05) are colored red. h, Expression of TGFβ isoforms and genes involved in TGFβ presentation across cell types after pooling the cells from all human sections (n = 4).

Update of

References

    1. Milner, J. J. et al. Heterogenous populations of tissue-resident CD8+ T cells are generated in response to infection and malignancy. Immunity52, 808–824 (2020). - PMC - PubMed
    1. Masopust, D. & Soerens, A. G. Tissue-resident T cells and other resident leukocytes. Annu. Rev. Immunol.10.1146/annurev-immunol-042617-053214 (2019). - PMC - PubMed
    1. Reina-Campos, M. et al. Metabolic programs of T cell tissue residency empower tumour immunity. Nature621, 179–187 (2023). - PMC - PubMed
    1. Crowl, J. et al. Tissue-resident memory CD8+ T cells possess unique transcriptional, epigenetic and functional adaptations to different tissue environments. Nat. Immunol.23, 1121–1131 (2022). - PMC - PubMed
    1. Milner, J. J. et al. Runx3 programs CD8+ T cell residency in non-lymphoid tissues and tumours. Nature552, 253–257 (2017). - PMC - PubMed

MeSH terms

Substances