. 2025 Jan 22;57(2):65.
doi: 10.3758/s13428-024-02581-3.

Towards a characterization of human spatial exploration behavior

Affiliations

Towards a characterization of human spatial exploration behavior

Valentin Baumann et al. Behav Res Methods. .

Abstract

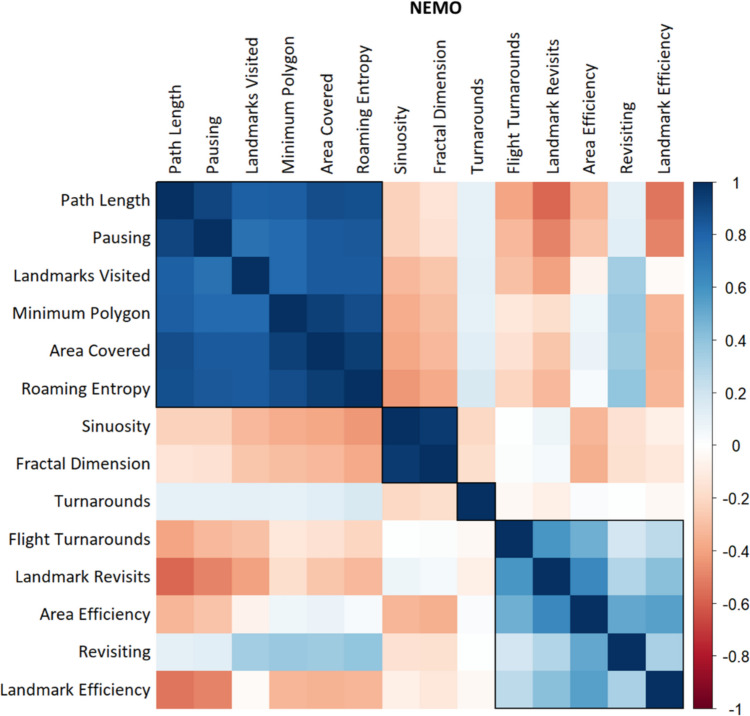
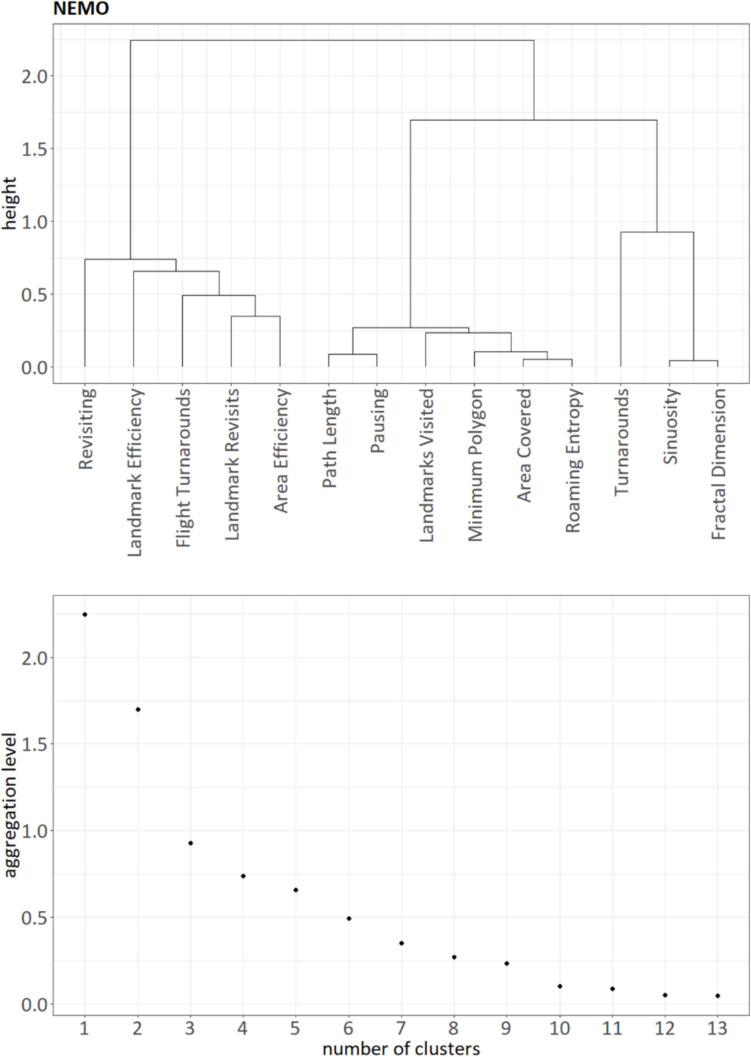
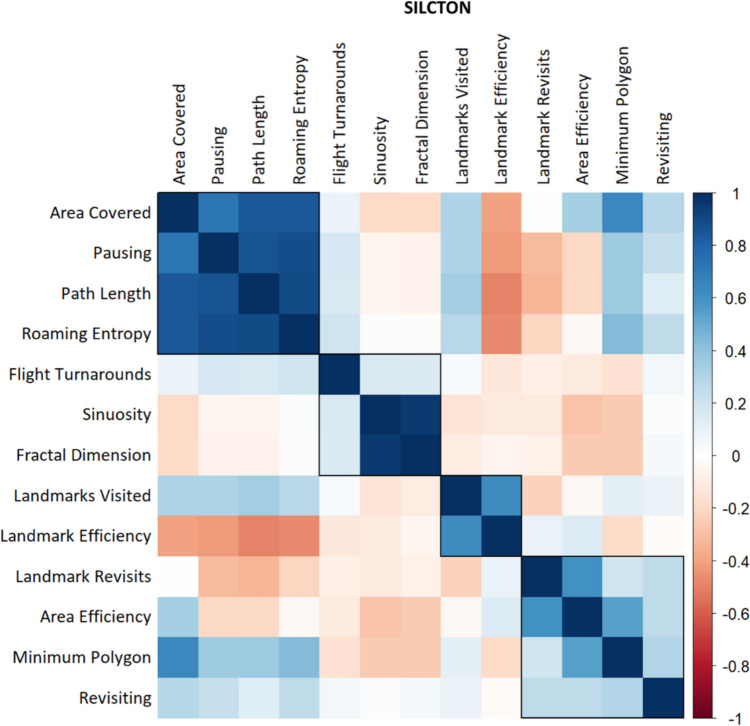
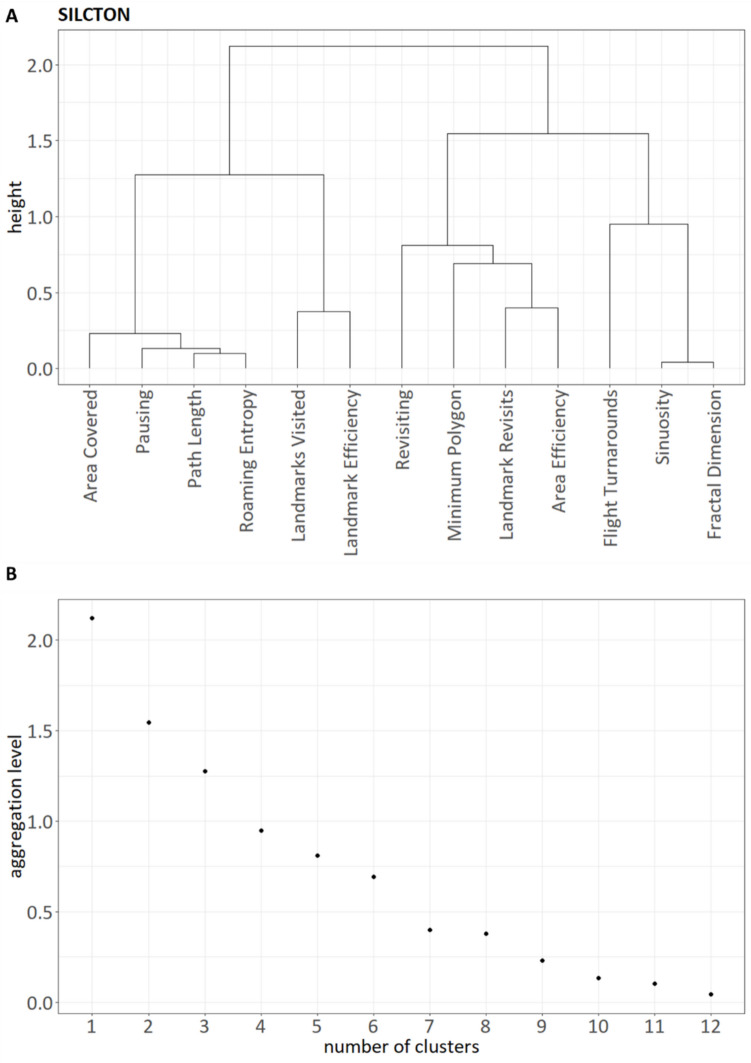
Spatial exploration is a complex behavior that can be used to gain information about developmental processes, personality traits, or mental disorders. Typically, this is done by analyzing movement throughout an unknown environment. However, in human research, until now there has been no overview on how to analyze movement trajectories with regard to exploration. In the current paper, we provide a discussion of the most common movement measures currently used in human research on spatial exploration, and suggest new indices to capture the efficiency of exploration. We additionally analyzed a large dataset (n = 409) of human participants exploring a novel virtual environment to investigate whether movement measures could be assigned to meaningful higher-order components. Hierarchical clustering of the different measures revealed three different components of exploration (exploratory behavior, spatial shape, and exploration efficiency) that in part replicate components of spatial exploratory behavior identified in animal studies. A validation of our analysis on a second dataset (n = 102) indicated that two of these clusters are stable across different contexts as well as participant samples. For the exploration efficiency cluster, our validation showed that it can be further differentiated into a goal-directed versus a general, area-directed component. By also sharing data and code for our analyses, our results provide much-needed tools for the systematic analysis of human spatial exploration behavior.

Keywords: Exploratory behavior; Human exploration; Novelty seeking; Spatial exploration; Virtual environment.


Conflict of interest statement

Declarations. Ethics approval: Not applicable (see Schomaker et al., 2022; as well as Brunec et al., 2022). Consent for publication: Not applicable (see Schomaker et al., 2022; as well as Brunec et al., 2022). Conflicts of interest: The authors declare no competing interests.

Figures

Fig. 1
Fig. 1
Visualization of the different exploration measures proposed in the current article (all trajectories from the NEMO dataset). For each participant, the raw data give a two-dimensional trajectory (A). Landmark Visits and Landmark Revisits can be calculated by defining a regular area around the landmark coordinates (e.g., circles with 10-m radius, shown in blue), while area exploration can be represented as a heatmap showing the frequency of visits to each bin, which is used in the Area Covered (C) as well as the Roaming Entropy calculation (D). Tortuosity as measured by Fractal Dimension or Sinuosity increases the more a trajectory deviates from a straight line (E). The trajectory resampled to the flight scale reveals Turnarounds (F, turnarounds marked by gray circles), which have been suggested to represent less efficient exploration behavior
Fig. 2
Fig. 2
Overview of one of the two virtual environments used in the NEMO dataset (A). Twenty landmark objects were positioned throughout the environment at intersections and road endpoints, which participants could explore freely (B). In the SILCTON datasets, the map represented a university campus with several buildings (C). Here, participants were given the explicit goal of finding eight specifically named buildings (D, building position marked by the red stars)
Fig. 3
Fig. 3
Similarity matrix for all investigated measures of exploration behavior in the NEMO dataset (note that while ClustofVar uses the squared Pearson correlation as similarity measure, the plot shows the standard Pearson correlation for better interpretability). The rectangular boxes represent the three main clusters determined by our hierarchical cluster analysis, plus a potential fourth cluster consisting of the original Turnarounds measure. We inverted the measures Pausing, Revisiting, and Landmark Revisits as well as Turnarounds and Flight Turnarounds for this plot to ensure consistent meaning in respect to the other measures (higher score = higher exploratory behavior/higher efficiency)
Fig. 4
Fig. 4
Results of the hierarchical clustering shown as a dendrogram (A) and as a plot of the aggregation levels (B) for then NEMO dataset. Measures that join at a lower height in a dendrogram are more strongly related to each other than measures that join at greater height. On visual inspection of the dendrogram (A), three main clusters emerge (left branch: cluster “Exploration Efficiency,” middle branch: cluster “Exploratory Activity,” right branch: cluster “Spatial Shape”). Using the elbow method and the kneedle algorithm, the plot of the height of the aggregation levels versus the number of variables suggests a number of three to four clusters (B). However, note that the original Turnarounds measure does not seem to be closely related to any of the other measures (A, also see Fig. 3). While this measure could be interpreted as a singular fourth cluster, we decided to not include it in our further analysis as it does not represent its intended meaning (Fig. 5 and main text)
Fig. 5
Fig. 5
Comparison of Turnarounds using the original method by Farran et al. (2022) and our proposed improved method (Flight Turnarounds). The goal of both methods is to quantify how often participants turn around and retrace their previous path by analyzing the turning angles. Turning angles classified as turnarounds are shown as gray dots. Our data show that the original Turnarounds method cannot reliably detect turnarounds that are relatively easy to discern visually (A), while Flight Turnarounds correctly identifies all five turnarounds (B). At the same time, Turnarounds can be generated by comparatively small-scale movement that is not indicative of actual path retracing (C), which is not an issue when angles are computed on the flight scale. nTA = number of turnarounds
Fig. 6
Fig. 6
Similarity matrix for all investigated measures of exploration behavior in the SILCTON dataset, showing the four clusters. Note that while ClustofVar uses the squared Pearson correlation as similarity measure, the plot shows the standard Pearson correlation for better interpretability. We inverted the measures Pausing, Revisiting, and Landmark Revisits for this plot to ensure consistent meaning in respect to the other measures (higher score = higher exploratory behavior/higher efficiency). Note that this time we did not invert Flight Turnarounds, as the clustering suggested it represented a measure of Spatial Shape rather than Exploration Efficiency (more turnarounds = more tortuous pathing)
Fig. 7
Fig. 7
Results of the hierarchical clustering shown as a dendrogram (A) and as a plot of the aggregation levels (B) for the SILCTON dataset. Four main clusters emerge (outer left branch: cluster “Exploratory Activity,” middle left branch: cluster “Goal Efficiency,” middle right branch: “Area Efficiency,” outer right branch: cluster “Spatial Shape”). Note that while the Flight Turnarounds measure was grouped with Sinuosity and Fractal Dimension, it did not seem to be closely related to these variables or to any of the other measures (A, also see Fig. 6). Using the elbow method and the kneedle algorithm, the plot of the height of the aggregation levels versus the number of variables also suggests a number of four clusters (B)

Similar articles

References

    1. Ai, P., Liu, Y., & Zhao, X. (2019). Big Five personality traits predict daily spatial behavior: Evidence from smartphone data. Personality and Individual Differences,147, 285–291. 10.1016/j.paid.2019.04.027
    1. Alessandretti, L., Lehmann, S., & Baronchelli, A. (2018). Understanding the interplay between social and spatial behaviour. EPJ Data Science 2018 7:1, 7(1), 1–17. 10.1140/EPJDS/S13688-018-0164-6
    1. Alessandretti, L., Sapiezynski, P., Sekara, V., Lehmann, S., & Baronchelli, A. (2018). Evidence for a conserved quantity in human mobility. Nature Human Behaviour 2018 2:7, 2(7), 485–491. 10.1038/s41562-018-0364-x - PubMed
    1. Batrancourt, B., Lecouturier, K., Ferrand-Verdejo, J., Guillemot, V., Azuar, C., Bendetowicz, D., Migliaccio, R., Rametti-Lacroux, A., Dubois, B., & Levy, R. (2019). Exploration deficits under ecological conditions as a marker of apathy in frontotemporal dementia. Frontiers in Neurology, 10(AUG), 941. 10.3389/FNEUR.2019.00941/BIBTEX - PMC - PubMed
    1. Baumann, V., Birnbaum, T., Breitling-Ziegler, C., Tegelbeckers, J., Dambacher, J., Edelmann, E., Bergado-Acosta, J. R., Flechtner, H.-H., & Krauel, K. (2020). Exploration of a novel virtual environment improves memory consolidation in ADHD. Scientific Reports,10(1), 21453. 10.1038/s41598-020-78222-4 - PMC - PubMed

LinkOut - more resources