. 2025 Jan 22;16(1):928.
doi: 10.1038/s41467-024-55663-3.

Mgl2+ cDC2s coordinate fungal allergic airway type 2, but not type 17, inflammation in mice

Affiliations

Mgl2+ cDC2s coordinate fungal allergic airway type 2, but not type 17, inflammation in mice

Peter C Cook et al. Nat Commun. .

Abstract

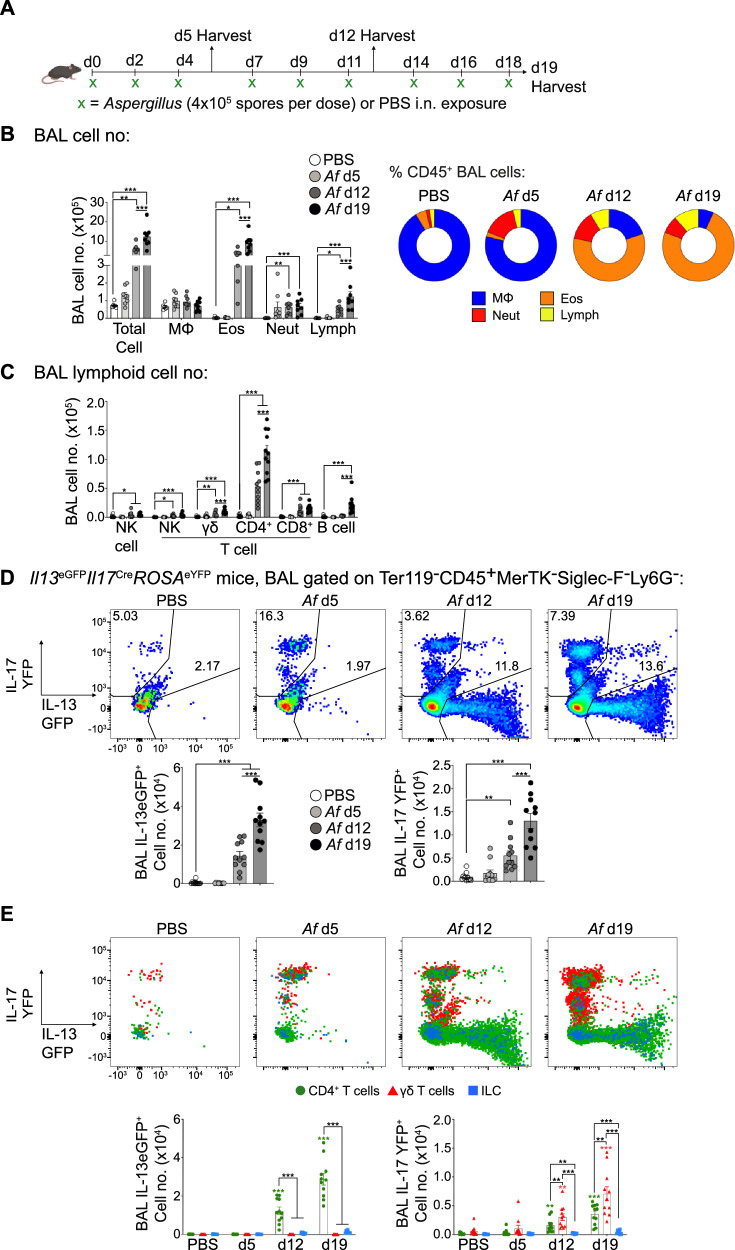
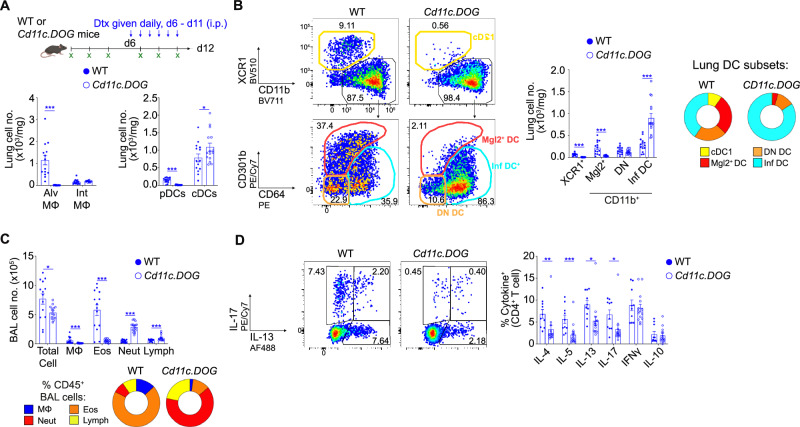
Fungal spores are abundant in the environment and a major cause of asthma. Originally characterised as a type 2 inflammatory disease, allergic airway inflammation that underpins asthma can also involve type 17 inflammation, which can exacerbate disease causing failure of treatments tailored to inhibit type 2 factors. However, the mechanisms that determine the host response to fungi, which can trigger both type 2 and type 17 inflammation in allergic airway disease, remain unclear. Here we find that CD11c+ DCs and CD4+ T cells are essential for development of both type 2 and type 17 airway inflammation in mice repeatedly exposed to inhaled spores. Single cell RNA-sequencing with further multi-parameter cytometry shows that allergic inflammation dramatically alters the proportion of numerous DC clusters in the lung, but that only two of these (Mgl2+ cDC2s and CCR7+ DCs) migrate to the dLNs. Targeted removal of several DC subsets shows that Mgl2+ cDC2 depletion reduces type 2, but not type 17, fungal allergic airway inflammation. These data highlight distinct DC subsets as potential therapeutic targets for the treatment of pulmonary fungal disease.


Conflict of interest statement

Competing interests: Individuals based at the Lydia Becker Institute received funding from GSK. These authors (P.C.C., S.L.B, E.L.H., F.R.S., A.S.M.) declare that the research was conducted in the absence of any commercial or financial relationships that could be construed as a potential conflict of interest. The remaining authors declare no competing interests.

Figures

Fig. 1
Fig. 1. Fungal spores induce hallmarks of type 2 and type 17 allergic airway inflammation.
A Mice were repeatedly exposed to PBS or A. fumigatus spores (Af, strain: CEA10, 4 ×10⁵ spores per dose) or PBS controls via intranasal transfer on the indicated time points. Tissues were harvested the following day after the third, sixth or ninth dose of spores (d5, d12 and d19, respectively). Created in BioRender. Cook, P. (2024) https://BioRender.com/z24b189. B Graphs display the numbers and percentage of macrophages (MΦ), eosinophils (Eos), neutrophils (Neut) and lymphocytes (Lymph) isolated from the BAL fluid of mice following repeat doses of Af spores. C Graph displays the numbers of NK cells, NK T cells, γδ T cells, CD4+ T cells, CD8+ T cells and B  cells isolated from the BAL fluid of mice following repeat doses of Af spores. D Flow cytometry plots and graphs identify the proportion and number of Il13 and Il17 expressing cells isolated from the BAL fluid of Il13eGFPIl17CreROSAeYFP mice exposed to varying doses of Af spores. E Flow cytometry overlay plots of Il13 and Il17 expression of CD4+ T cells (green), γδ T cells (red), ILCs (blue). Graphs show the number of Il13 and Il17 cells for each population that were detected in the BAL fluid of Il13eGFPIl17CreROSAeYFP mice exposed to varying doses of Af spores. B data are from 2 independent experiments (n = 30 biologically independent animals). C, D & E data are from 3 independent experiments (n = 44 biologically independent animals). Data were fit to a linear mixed effect model, with experimental day as a random effect variable, and groups compared with a two-sided Tukey’s multiple comparison test. *P < 0.05, ** P < 0.01, *** P < 0.001. Data are presented as mean values ± SEM. B P Values, Total Cell; PBS vs Af d12 = 0.0011, PBS vs Af d19 = 2.19 × 10-13, Af d12 vs Af d19 = 6.34 × 10-5. Eos; PBS vs Af d12 = 0.00114, PBS vs Af d19 = 2.86 × 10−11, Af d12 vs Af d19 = 3.33 × 10−5. Neut; PBS vs Af d12 = 0.00268, PBS vs Af d19 = 0.0005. Lymph: PBS vs Af d12 = 0.03553, PBS vs Af d19 = 4.08 × 10−9, Af d12 vs Af d19 = 0.000342. C P Values, NK; PBS vs Af d12 = 0.02673, PBS vs Af d19 = 0.01309. NK T cell; PBS vs Af d12 = 0.0278, PBS vs Af d19 = 9.02 × 10−6. γδ T cell; PBS vs Af d12 = 0.001323, PBS vs Af d19 = 1.36 × 10-13, Af d12 vs Af d19 = 0.000151. CD4+ T cell; PBS vs Af d12 = 4.53 × 10−8, PBS vs Af d19 = < 2 × 10−16, Af d12 vs Af d19 = 6.82 × 10−11. CD8+ T cell; PBS vs Af d12 = 4.864 × 10−6, PBS vs Af d19 = 5.6 × 10−10. B cell; PBS vs Af d19 = 2.15 × 10−10, Af d12 vs Af d19 = 5.2 × 10−9. D P Values, IL-13eGFP+: PBS vs Af d12 = 1.28 x 10⁻⁷, PBS vs Af d19 = < 2 × 10−16, Af d12 vs Af d19 = 1.93 × 10−12. IL-17 YFP+: PBS vs Af d12 = 0.0024, PBS vs Af d19 = < 2 × 10−16, Af d12 vs Af d19 = 2.11 × 10−7. E P Values, IL-13eGFP+: Af d12 CD4+ T cells vs γδ T cells = < 2 × 10−16, Af d12 CD4 + T cells vs ILCs = 2 × 10−16, Af d19 CD4+ T cells vs γδ T cells = 2 × 10−16, Af d19 CD4+ T cells vs ILCs = 2 × 10−16. IL-17 YFP+: Af d12 CD4+ T cells vs γδ T cells = 0.0036, Af d12 CD4+ T cells vs ILCs = 0.0036, Af d12 γδ T cells vs ILCs = 3.02 × 10−9, Source data are provided as a Source Data File. Schematics in figures were created in https://BioRender.com.
Fig. 2
Fig. 2. Type 2 and type 17 fungal allergic airway inflammation is dependent on CD4+ T cells.
A Il13eGFPIl17CreROSAeYFP mice were treated with anti-CD4 mAb or isotype control mAb after three doses of Af spores (4 × 105 per dose) and were subsequently exposed to three further doses of spores. Created in BioRender. Cook, P. (2024) https://BioRender.com/z24b189. Graphs display the number and percentage of macrophages (MΦs), eosinophils (Eos), neutrophils (Neut) and lymphocytes (Lymph) or the number of lymphocyte populations isolated detected in the BAL fluid 24 h after the sixth dose. B Flow cytometry plots and graphs identify the proportion and number of Il13 and Il17 expressing cells isolated from the BAL fluid. C WT or Tcrd−/− mice were exposed to six doses of Af spores (4 × 105 per dose). Created in BioRender. Cook, P. (2024) https://BioRender.com/z24b189. Graphs display the number and percentage of MΦs, eosinophils (Eos), neutrophils (Neut) and lymphocytes (Lymph) or the number of lymphocyte populations detected in the BAL fluid 24 h after the sixth dose. D Representative flow cytometry plots identify IL-13+ and IL-17+ populations via intracellular cytokine staining of lung CD4+ T cells post stimulation with PMA/ionomycin. Graphs show the proportion of CD4+ T cells expressing type 1, type 2 and type 17 cytokine. A & B data are from 3 independent experiments (n = 30 biologically independent animals). C & D data are from 2 independent experiments (n = 18 biologically independent animals). Data were fit to a linear mixed effect model, with experimental day as a random effect variable, and groups compared with a two-sided Tukey’s multiple comparison test. *p < 0.05, **p < 0.01, ***p < 0.001. Data are presented as mean values ± SEM. B P Values, Total Cell; anti-CD4 mAb vs isotype control mAb = 5.53 × 10−11. Eos; anti-CD4 mAb vs isotype control mAb = 9.95 × 10−7. Neut; anti-CD4 mAb vs isotype control mAb = 0.00232. Lymph: anti-CD4 mAb vs isotype control mAb = 4.82 × 10−12. CD4+ T cells; anti-CD4 mAb vs isotype control mAb = 5.79 × 10−13. CD8 + T cells; anti-CD4 mAb vs isotype control mAb = 0.00407. γδ T cells; anti-CD4 mAb vs isotype control mAb = 1.11 × 10−6. NK T cells; anti-CD4 mAb vs isotype control mAb = 5.85 × 10−5. NK cells; anti-CD4 mAb vs isotype control mAb = 1.44 × 10−6. B cells; anti-CD4 mAb vs isotype control mAb = 0.00557. C, P Values, IL-13eGFP+ cell number; anti-CD4 mAb vs isotype control mAb = 5.18 × 10−11. IL-17 YFP+ cell number; anti-CD4 mAb vs isotype control mAb = 2.01 × 10−7. % IL-13eGFP+; anti-CD4 mAb vs isotype control mAb = 9.68 × 10−11. IL-17 YFP+ cell number; anti-CD4 mAb vs isotype control mAb = 0.00047. D P values, Total cell; WT vs Tcrd−/− = 0.000662. Eos; WT vs Tcrd−/− = 0.00115. Lymph; WT vs Tcrd−/− = 0.00024. CD4+ T cells; WT vs Tcrd−/− = 4.42 x 10⁻⁶. CD8+ T cells; WT vs Tcrd−/− = 0.0122. γδ T cells; WT vs Tcrd−/− = 0.0214. E P values, IL-4; WT vs Tcrd−/− = 3.31 × 10-6. IL-5; WT vs Tcrd−/− = 0.000117. IL-13; WT vs Tcrd−/− = 3.88 × 10−8. IL17; WT vs Tcrd−/− = 0.000758. Source data are provided as a Source Data File. Schematics in figures were created in https://BioRender.com.
Fig. 3
Fig. 3. Type 2 and type 17 fungal allergic airway inflammation is dependent on CD11c-expressing cells.
A WT or Cd11c.DOG mice were treated with diphtheria toxin (DTx) after three doses of Af spores (4 × 105 per dose) and this continued daily as mice were subsequently exposed to three further doses of spores. Created in BioRender. Cook, P. (2024) https://BioRender.com/z24b189. Graphs show the number of alveolar macrophages (AlvMΦs), interstitial macrophages (IntMΦs), plasmacytoid DCs (pDCs) and DC subsets detected in the lung tissue 24 h after the sixth dose. B Flow cytometry plots identifying DC subsets alongside graphs showing the number amd proportion of these populations detected in the lung tissue. C Graphs show the number and percentage of macrophages (MΦs), eosinophils (Eos), neutrophils (Neut) and lymphocytes (Lymph) detected in the BAL fluid 24 h after the sixth dose. D Representative flow cytometry plots identify IL-13+ and IL-17+ populations via intracellular cytokine staining of lung CD4+ T cells post stimulation with PMA/ionomycin. Graphs show the proportion of CD4+ T cells expressing type 1, type 2 and type 17 cytokine. AC data are from 3 independent experiments (n = 29 biologically independent animals). D data are from 3 independent experiments (n = 24 biologically independent animals). Data were fit to a linear mixed effect model, with experimental day as a random effect variable, and groups compared with a two-sided Tukey’s multiple comparison test. *p < 0.05, **p < 0.01, ***p < 0.001. Data are presented as mean values ± SEM. A P Values, Alv MΦ; WT vs CD11c.DOG = 7.68 × 10−11. pDCs; WT vs CD11c.DOG = < 2.0 × 10−16. cDC; WT vs CD11c.DOG = 0.0156. B P Values, XCR1+; WT vs CD11c.DOG = 2.44 × 10−15. Mgl2+; WT vs CD11c.DOG = 5.4 × 10−7. Inf DC; WT vs CD11c.DOG = 2.82 × 10−10. C P Values, Total Cell; WT vs CD11c.DOG = 0.0104. MΦ; WT vs CD11c.DOG = 0.000902. Eos; WT vs CD11c.DOG = 1.31 × 10−9. Neut; WT vs CD11c.DOG = < 2.0 × 10−16. Lymph; WT vs CD11c.DOG = 0.000517. D P Values, IL-4; WT vs CD11c.DOG = 0.00666. IL-5; WT vs CD11c.DOG = 0.000783. IL-13; WT vs CD11c.DOG = 0.0138. IL-17; WT vs CD11c.DOG = 0.0119. Source data are provided as a Source Data File. Schematics in figures were created in https://BioRender.com.
Fig. 4
Fig. 4. Single cell RNA-sequencing of pulmonary DCs reveals distinct clusters that can be identified throughout fungal allergic airway inflammation.
A DCs were isolated from the lung tissue of naïve mice or mice repeatedly exposed intransally to Af spores (4 × 105 per dose), harvested 24 h after the third and sixth dose (Af d5 and Af d12, respectively). Single cell libraries were generated from these populations using the 10x chromium platform and sequenced (Illumina Hi-seq). Created in BioRender. Cook, P. (2024) https://BioRender.com/n00n566. B tSNE of all cells coloured according to the clusters. 11 clusters, each defined by the colours indicated in the key, were identified by dynamic tree cluster method using highly expressed genes. These were refined to 7 distinct clusters of DCs (circled) based on highly expressed genes as indicated. C tSNE plots indicate the distribution of cells within each cluster based on their origin (orange: naïve, green: Af d5 and purple: Af d12). D Heat map shows scaled gene expression of top 10 defining genes for each cluster. Schematics in figures were created in https://BioRender.com.
Fig. 5
Fig. 5. Repeat fungal exposure increases the proportion of cDC2s in the lung and dLN.
Representative tSNE plots reveal DC subsets identified by unbiased clustering analysis of flow cytometry data from the (A) lung and (B) dLNs of mice repeatedly exposed intranasally to PBS or Af spores (4 × 105 per dose). Graphs display the numbers and percentage of DC subsets isolated from the (A) lung and (B) dLNs. Data are from 2 independent experiments (n = 35 biologically independent animals). Data were fit to a linear mixed effect model, with experimental day as a random effect variable, and groups compared with a two-sided Tukey’s multiple comparison test. *p < 0.05, **p < 0.01, ***p < 0.001. Data are presented as mean values ± SEM. A P Values, cDC1; PBS vs Af d12 = 3.53 × 10−7, PBS vs Af d19 = 0.000142. CCR7+ DC; PBS vs Af d12 = 5.422 x 10⁻⁷, PBS vs Af d19 = 0.000142. cDC2 Mgl2+CD209a+; PBS vs Af d12 = 2.07 × 10−5, PBS vs Af d19 = 1.35  10−6. cDC2 Mgl2-CD209a+; PBS vs Af d12 = 1.08 × 10−5, PBS vs Af d19 = 0.0139. cDC2 Mgl2+CD209a-; PBS vs Af d12 = 4.05 × 10−5, PBS vs Af d19 = 1.02 × 10−5. Inf DC2; PBS vs Af d12 = 4.32 × 10−5. Inf DC3; PBS vs Af d12 = 7.25 × 10−5, PBS vs Af d19 = 0.00422. Monocyte 1; PBS vs Af d12 = 3.02 × 10−6. Monocyte 2; PBS vs Af d12 = 2.29 × 10−8, PBS vs Af d19 = 1.89 × 10−5. CD11b+; PBS vs Af d12 = 6.57 × 10−7, PBS vs Af d19 = 0.00209. B P Values, CCR7+ DC; PBS vs Af d12 = 0.00668. cDC2 Mgl2+CD209a+; PBS vs Af d12 = 2.07 × 10−5, PBS vs Af d19 = 1.35 × 10−6. cDC2 Mgl2+CD209a-; PBS vs Af d12 = 0.00512. Inf DC1; PBS vs Af d12 = 0.000319. Inf DC2; PBS vs Af d12 = 0.00841. Monocyte 1; PBS vs Af d12 = 0.0234. CD11b+; PBS vs Af d12 = 0.023. MHCIIlo; PBS vs Af d12 = 0.014. Source data are provided as a Source Data File.
Fig. 6
Fig. 6. Mgl2 cDC2s are crucial for promoting fungal type 2 allergic airway inflammation.
A WT or Mgl2-DTR mice were treated with diphtheria toxin (DTx) (on d6 and d9) whilst being exposed to repeat doses of Af spores (4 ×10⁵ per dose) BAL fluid and lung tissue were harvested 24 h after the final dose. Created in BioRender. Cook, P. (2024) https://BioRender.com/z24b189. B Representative flow cytometry plots identifying MΦ subsets and graphs show the number of MΦs in the lung tissue. C, D Representative flow cytometry tSNE plots show unbiased clustering analysis of identified subsets within the DC population that were detected in the dLN. Graphs show the number and percentage of DC subsets in the (C) lung and (D) dLN. E Graphs show the number and percentage of macrophages (MΦs), eosinophils (Eos), neutrophils (Neut) and lymphocytes (Lymph) detected in the BAL fluid 24 h after the sixth dose. F Representative flow cytometry plots identify IL-13+ and IL-17+ populations via intracellular cytokine staining of lung CD4+ T cells post stimulation with PMA/ionomycin. Graphs show the proportion of CD4+ T cells expressing type 1, type 2 and type 17 cytokine. B, E data from 3 independent experiments (n = 29 biologically independent animals). C, D data from 2 independent experiments (n = 18 biologically independent animals). F data from 4 independent experiments (n = 41 biologically independent animals). Data were fit to a linear mixed effect model, with experimental day as a random effect variable, and groups compared with a two-sided Tukey’s multiple comparison test. *p < 0.05, **p < 0.01, ***p < 0.001. Data are presented as mean values ± SEM. B P values, Alv MΦ; WT vs Mgl2-DTR = 0.00403. C P values, CCR7+ DC; WT vs Mgl2-DTR = 0.0158. cDC2 Mgl2+CD209a+; WT vs Mgl2-DTR = 0.00021. cDC2 Mgl2-CD209a+; WT vs Mgl2-DTR = 0.00845. cDC2 Mgl2+CD209a-; WT vs Mgl2-DTR = 0.00311. Inf DC2; WT vs Mgl2-DTR = 0.027. Inf DC3; WT vs Mgl2-DTR = 0.00783. CD11b+; WT vs Mgl2-DTR = 0.0399. D P values, cDC2 Mgl2+CD209a+; WT vs Mgl2-DTR = 1.62 × 10−14. cDC2 Mgl2+CD209a-; WT vs Mgl2-DTR = 0.0332. E P values, Total Cells; WT vs Mgl2-DTR = 0.000503. Eos; WT vs Mgl2-DTR = 0.000149. Neut; WT vs Mgl2-DTR = 0.0131. F P values, IL-4; WT vs Mgl2-DTR = 0.000773. IL-5; WT vs Mgl2-DTR = 7.69 × 10-5. IL-13; WT vs Mgl2-DTR = 0.000636. Source data are provided as a Source Data File. Schematics in figures were created in https://BioRender.com.

References

    1. Dharmage, S. C., Perret, J. L. & Custovic, A. Epidemiology of asthma in children and adults. Front Pediatr.7, 246 (2019). - PMC - PubMed
    1. Li, E. et al. Airway mycosis in allergic airway disease. Adv. Immunol.142, 85–140 (2019). - PubMed
    1. Agarwal, R., Muthu, V. & Sehgal, I. S. Relationship between Aspergillus and asthma. Allergol. Int72, 507–520 (2023). - PubMed
    1. Denning, D. W. et al. Fungal allergy in asthma-state of the art and research needs. Clin. Transl. Allergy4, 14 (2014). - PMC - PubMed
    1. Hammad, H. & Lambrecht, B. N. The basic immunology of asthma. Cell184, 1469–1485 (2021). - PubMed