. 2025 Jan 22;16(1):956.
doi: 10.1038/s41467-025-56093-5.

Microglia modulate the cerebrovascular reactivity through ectonucleotidase CD39

Affiliations

Microglia modulate the cerebrovascular reactivity through ectonucleotidase CD39

Zhongxiao Fu et al. Nat Commun. .

Abstract

Microglia and the border-associated macrophages contribute to the modulation of cerebral blood flow, but the mechanisms have remained uncertain. Here, we show that microglia regulate the cerebral blood flow baseline and the responses to whisker stimulation or intra-cisternal magna injection of adenosine triphosphate, but not intra-cisternal magna injection of adenosine in mice model. Notably, microglia repopulation corrects these cerebral blood flow anomalies. The microglial-dependent regulation of cerebral blood flow requires the adenosine triphosphate-sensing P2RY12 receptor and ectonucleotidase CD39 that initiates the dephosphorylation of extracellular adenosine triphosphate into adenosine in both male and female mice. Pharmacological inhibition or CX3CR1-CreER-mediated deletion of CD39 mimics the cerebral blood flow anomalies in microglia-deficient mice and reduces the upsurges of extracellular adenosine following whisker stimulation. Together, these results suggest that the microglial CD39-initiated breakdown of extracellular adenosine triphosphate co-transmitter is an important step in neurovascular coupling and the regulation of cerebrovascular reactivity.


Conflict of interest statement

Competing interests: S.C.R. is a scientific founder of Purinomia Biotech Inc and has consulted for eGenesis and SynLogic Inc; his interests are reviewed and managed by HMFP, Beth Israel Deaconess Medical Center by the institutional conflict-of-interest policies. The other authors declare no competing interests.

Figures
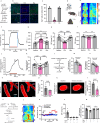
Fig. 1
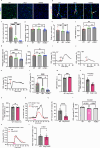
Fig. 1. Microglia regulate basal cerebral blood flow and neurovascular coupling.
a Schematics for longitudinal comparison of CBF reactivity in the same mouse: the baseline, the microglia-depletion state after PLX3397 chows, and microglia-repopulation after returning to normal chows. b Immunohistochemistry images showing IBA1+ cells co-stained with DAPI in baseline, PLX and repopulation conditions. Bar = 400 μm. Higher magnification images are shown below. Bar = 150 μm. c Quantification of IBA1+ cells in (b). Each dot indicates an individual mouse. n = 5 mice for each condition. Data are presented as mean ± s.e.m. Source data are provided as a Source Data file. d Laser speckle contrast imaging was used to measure the CBF responses to whisker stimulation across an intact skull (Created in BioRender. Lab, K. (2025) https://BioRender.com/r39k612). e Left, Representative images of mouse CBF changes pre-, during and post-whisker stimulation. Bar = 4 mm. Red square boxes (enlarged on Right), denote the region for CBF quantification in whisker stimulation. Bar = 1 mm. f Representative real-time CBF responses to 5 Hz whisker stimulation (marked by the bar; 30 s). gi Comparison of the basal CBF (g), whisker stimulation-induced CBF changes (h) and CBF plateau (i) at the baseline, PLX-treated, and repopulation states. Each dot indicates an individual mouse. n = 8 mice for each condition. Data are presented as mean ± s.e.m. p-values were determined by one-way ANOVA for paired samples with Tukey post hoc test. Source data are provided as a Source Data file. j Representative real-time CBF responses to 8% CO2 hypercapnia stimulation (marked by the bar; 5 min). k Comparison of the hypercapnia-induced CBF changes at the baseline, PLX-treated, and repopulation states. Each dot indicates an individual mouse. n = 8 mice for each condition. Data are presented as mean ± s.e.m. p-values were determined by one-way ANOVA for paired samples with Tukey post hoc test. Source data are provided as a Source Data file. l Scheme of CBF evaluations at the baseline (1st CBF) and tamoxifen-induced acute microglia ablation (2nd CBF) in Cx3cr1-CreERT2;R26R-DTA mice. m, n CBF changes to whisker stimulation (m) and hypercapnia (n) at the baseline and after tamoxifen (TAM)-induced acute microglia ablation in the same mouse. Each line tracks the changes in CBF response in the same mouse. Each dot indicates an individual mouse. n = 5 mice for each condition. p-values were determined by paired t-test two sided. Source data are provided as a Source Data file. o Representative micrographs showing different responses to whisker stimulation in the pial artery (white lines, dilation) and the pial vein (blue lines, no visible dilation) above the contralateral barrel cortex. Bar = 30 μm. p Comparison of whisker stimulation-induced dilation of a pial artery in the mice under control chow or PLX3397 chow. Each dot indicates an individual mouse. n = 10 mice for control group. n = 9 mice for PLX group. p-values were determined by unpaired t-test two sided. Data are presented as mean ± s.e.m. Source data are provided as a Source Data file. q Representative micrographs showing dilation of the penetrating artery in the barrel cortex after whisker stimulation. Bar = 10 μm. r Comparison of whisker stimulation-induced dilation of penetrating artery in barrel cortex in the mice under control chow or PLX3397 chow. Each dot indicates an individual mouse. n = 5 mice for each group. p-values were determined by unpaired t test two sided. Data are presented as mean ± s.e.m. Source data are provided as a Source Data file. s Schematics for the generation of transgenic mice expressing microglia-specific Gq-DREADD and Gi-DREADD for compound 21-mediated chemogenetic manipulation (Created in BioRender. Lab, K. (2025) https://BioRender.com/y79i174). t Representative micrographs showing CBF baseline and compound 21 (C21)-induced CBF change in microglia-specific Gq-DREADD expression mice. Bar = 5 mm. u Real-time CBF responses after intraperitoneal injection of C21 (arrow) in mice of the labeled genotype. v Summary of microglia Gq or Gi activation-induced CBF changes in different conditions. Each dot indicates an individual mouse. n = 7 mice for Gq+Cre+C21+ group; n = 6 mice for Gi+Cre+C21+ group; n = 6 mice for Gq+CreC21+ group; n = 5 mice for Gq+CreC21+ group. Data are presented as mean ± s.e.m. Source data are provided as a Source Data file. w Comparison of the CBF changes to whisker stimulation in microglia-Gq mice and WT littermates with or without the C21 injection. Each dot indicates an individual mouse. n = 7 mice for Gq+C21 group; n = 7 mice for Gq+C21+ group; n = 6 mice for GqC21 group; n = 6 mice for GqC21+ group. ***p < 0.0001 as determined by paired t-test two sided. Source data are provided as a Source Data file.
Fig. 2
Fig. 2. Identification of cerebral blood flow (CBF) regulation-related genes in microglia.
a Schematic of bulk RNA sequencing with mice brain cortex tissue from three different treatment groups (baseline, PLX, repopulation). Five mice were included in each group (Created in BioRender. Lab, K. (2025) https://BioRender.com/r63x287). b Principal component analysis (PCA) plots outlining the similarities between samples. c Volcano plot of the cortex genes showing the magnitude (log2 [fold change]) and probability ( − log10 [adjusted p-value]) in the PLX3392-treated group versus the baseline group. Black and gray dots represent significantly changed and non-significantly changed genes, respectively. d Heatmap showing the expression of selected genes in baseline, PLX3397-treated, and repopulated mouse brains based on the row z scores of log2 CPM values. e RT-qPCR verification of the interested genes’ expression in three conditions: baseline, PLX3397-treated and repopulation. Data are mean ± s.e.m. Each dot represents one mouse. n = 5 mice for each group. p-values were determined by one-way ANOVA with the Tukey post hoc test. Source data are provided as a Source Data file. f, g Representative images of multi-color RNAscope experiments showing CD39 (Entpd1) expression in microglia (Hexb+) (f) and endothelial cells (Pecam1+) (g), respectively. Top, bar = 100 μm; bottom, bar = 50 μm. Each experiment was repeated independently for four times with similar results.
Fig. 3
Fig. 3. Microglia regulate ATP but not adenosine-induced cerebral blood flow (CBF) increase.
a Schematic of combining CBF measurement (using laser speckle contrast imaging) and nano-injector guided intracisternal magna (ICM) injection of vasoactive chemicals (Created in BioRender. Lab, K. (2024) https://BioRender.com/l61h464). b Representative images of the CBF responses to ICM injection of acetylcholine (Upper, 1 mM, 3 μl) or adropin peptides (Lower, 0.1 mg/ml, 3 μl). Each experiment was repeated independently for five times with similar results. c, d Real-time CBF changes to ICM-injection of acetylcholine (Ach, c) or adropin (d). The bar indicates the 10-minute injection period. e Representative images of the CBF responses to ICM injection of ATP (Upper, 1.5 μl, 10 mM) or adenosine (ADO, Lower, 1.5 μl, 10 mM). f, h Real-time CBF responses to ICM-injection of ATP (f) or adenosine (h). g Does-responses of CBF changes after ICM-injection of ATP. The injection volume was 1.5 μl in all conditions. Each dot represents an individual mouse. Sample sizes are n = 6, 5, 7, and 3 for the 0.5 mM, 5 mM, 10 mM, and 20 mM conditions, respectively. Data are presented as mean ± s.e.m. Source data are provided as a Source Data file. i Does-responses of CBF changes after ICM-injection of adenosine. The injection volume was 1.5 μl in all conditions. Each dot represents an individual mouse. Sample sizes are n = 4, 5, 5, and 6 for the 0.5 mM, 5 mM, 10 mM, and 20 mM conditions, respectively. Data are presented as mean ± s.e.m. Source data are provided as a Source Data file. j Schematics of sequential measurements of CBF responses in the same mouse at the baseline, after PLX3397-treatment, and at microglia repopulation state. k, l Comparison of the CBF responses to ICM-ATP (10 mM, 1.5 μl) (k) or adenosine (l) injection in the same mice at the baseline, PLX-treated, and repopulation state, respectively. Each dot indicates an individual mouse. n = 8 mice for each condition. Data are presented as mean ± s.e.m. p-values were determined by one-way ANOVA for paired samples with Tukey post hoc test. Source data are provided as a Source Data file. m, n CBF peak value to ICM-ATP (10 mM, 1.5 μl) (m) or adenosine (n) injection in the same mice at the baseline, PLX-treated, and repopulation state, respectively. Each dot indicates an individual mouse. n = 8 mice for each condition. Data are presented as mean ± s.e.m. p-values were determined by one-way ANOVA for paired samples with Tukey post hoc test. Source data are provided as a Source Data file. o, p Representative images of the CBF baseline and responses to ICM-injection of ATPγS (10 mM, 1.5 μl) at the time-points i, ii and iii (indicated by arrowheads in p). All ICM-ATPγS-injected mice expired within 20 min (n = 5).
Fig. 4
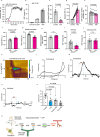
Fig. 4. CBF dysregulation in Csf1rΔFIRE/ΔFIRE and P2RY12 knockout mice.
a Representative images showing IBA1+ cells (co-stained with DAPI) in barrel cortex of WT, heterozygous, and homozygous Csf1rΔFIRE/ΔFIRE mice. Bar = 200 μm. b Representative images showing Lyve1+ cells (co-stained with CD31 and DAPI) in barrel cortex of WT, heterozygous (HET), and homozygous (HOMO) Csf1rΔFIRE/ΔFIRE mice. Bar = 50 μm. ce Quantification of IBA1+, leptomeningeal Lyve1+ and perivascular Lyve1+ cell density in WT, HET, and HOMO of Csf1rΔFIRE/ΔFIRE mice. Each dot represents an individual mouse. Sample sizes are n = 5, 5, 5 for WT, HET, HOMO groups, respectively. p-values were determined by one-way ANOVA with the Tukey post hoc test. Data are presented as mean ± s.e.m. ***P < 0.001; ****P < 0.0001. Source data are provided as a Source Data file. fh Quantification of baseline CBF (f), whisker stimulation induced CBF changes (g) and whisker stimulation induced CBF plateau (h) in WT, HET, and HOMO of Csf1rΔFIRE/ΔFIRE mice. Each dot represents an individual mouse. Sample sizes are n = 7, 6, 6 for WT, HET, HOMO groups, respectively. p-values were determined by one-way ANOVA with the Tukey post hoc test. Data are presented as mean ± s.e.m. *P < 0.05; **P < 0.01; ***P < 0.001; ****P < 0.0001. Source data are provided as a Source Data file. ik Representative trances of ATP ICM injection (1.5 μl, 10 mM) induced CBF changes in WT, HET, and HOMO of Csf1rΔFIRE/ΔFIRE mice. l Quantification of ATP ICM injection induced CBF changes in WT, HET, and HOMO of Csf1rΔFIRE/ΔFIRE mice. Each dot represents an individual mouse. Sample sizes are n = 7, 6, 6 for WT, HET, HOMO groups, respectively. p-values were determined by one-way ANOVA with the Tukey post hoc test. Data are presented as mean ± s.e.m. ****P < 0.0001. Source data are provided as a Source Data file. mo Quantification of CBF baseline (m), whisker stimulation-induced CBF changes (n), and whisker stimulation-induced CBF plateau (o). Each dot represents an individual mouse. For panel (m), sample sizes are n = 9, 9 for WT and P2ry12 KO groups, respectively. For panel (n), sample sizes are n = 7, 6 for WT and P2ry12 KO groups, respectively. For panel (o), sample sizes are n = 9, 9 for WT and P2ry12 KO groups, respectively. p-values were determined by unpaired two sample t-test (two sided). Data are presented as mean ± s.e.m. ***P < 0.001. Source data are provided as a Source Data file. p Example traces showing ATP (1.5 μl, 10 mM) ICM injection induced CBF changes in WT and P2ry12 knockout mice. q, r Quantification of ATP ICM injection (1.5 μl, 10 mM) induced CBF changes (q) and peak CBF values (r) in WT and P2ry12 knockout mice. For panel (q), sample sizes are n = 7, 7 for WT and P2ry12 KO groups, respectively. For panel (r), sample sizes are n = 7, 6, 6 for WT, HET, HOMO groups, respectively. p-values were determined by unpaired t-test two sided in (q). Data are presented as mean ± s.e.m. p-values were determined by one-way ANOVA with the Tukey post hoc test in (r). Data are presented as mean ± s.e.m. Source data are provided as a Source Data file. s Example traces showing adenosine (1.5 μl, 10 mM) ICM injection induced CBF changes in WT and P2ry12 knockout mice. t Quantification of adenosine ICM injection (1.5 μl, 10 mM) induced CBF changes in WT and P2ry12 knockout mice. Sample sizes are n = 7, 7 for WT and P2ry12 KO groups, respectively. p-values were determined by unpaired two sample t-test (two sided). Data are presented as mean ± s.e.m. Source data are provided as a Source Data file.
Fig. 5
Fig. 5. Microglial CD39 regulates basal CBF, neurovascular coupling and whisker stimulation-induced local adenosine concentration increase.
a Real-time CBF changes after ICM-injection of ARL67156 (1 mM, 3 μl). b Does-responses of CBF changes after ICM-injection of ARL67156 (3 μl). Each dot represents an individual mouse. Sample sizes are n = 3, 3, 4 for the 0.01 mM, 0.2 mM, 1 mM conditions, respectively. Data are presented as mean ± s.e.m. Source data are provided as a Source Data file. c The CBF responses to ICM injection of ARL67156 (1 mM, 3 μl) in control and PLX-treated conditions. Each dot represents an individual mouse. Sample sizes are n = 8, 6 for control and PLX conditions, respectively. Data are presented as mean ± s.e.m. p-values were determined by unpaired t-test two sided. Source data are provided as a Source Data file. d, e Comparison of the CBF baseline (d) and the CBF change to whisker stimulation (e) in control and at 30 min after ICM injection of ARL67156 (1 mM, 3 μl). Each line denotes an individual mouse. n = 7 mice for each group. p-values were determined by unpaired t test two sided. Source data are provided as a Source Data file. fi Comparison of the CBF baseline (f), CBF change to whisker stimulation (g), CBF plateau to whisker stimulation (h), CBF change to ICM-ATP injection (i), and CBF change to ICM-adenosine injection (j) in tamoxifen-induced Cx3cr1-CreER-;Entpd1 (CD39)fl/fl and Cx3cr1-CreER+; Entpd1 (CD39)fl/fl mice. Note that microglial CD39-deleted mice showed elevated basal CBF, and reduced CBF change to whisker stimulation and ICM-ATP injection, but no clear changes in the CBF change to ICM-adenosine injection. Each dot represents one individual mouse. n = 6, 6 for Entpd1fl/flCre+ and Entpd1fl/flCre groups, respectively. Data are presented as mean ± s.e.m. P-values were determined by unpaired t-test two sided. Source data are provided as a Source Data file. k, l A 3-D color plot of whisker stimulation-induced cyclic voltammogram signals in contralateral barrel cortex (k). The 3-D color plot depicts the time on the x-axis, potential on the y-axis, and current in false color. Background subtracted cyclic voltammogram showed the primary oxidation at 1.4 V and the secondary oxidation at 1.0 V (l), which are typical for adenosine. mo Current-vs-time plot shows the whisker stimulation-induced adenosine currents on the contralateral (m) and ipsilateral (n) barrel cortex. Whisker stimulation was started in the 30 s and ended at 50 s. Blue dish line marked the 20 s stimulation window. o Summary of whisker stimulation-induced adenosine release in different conditions. Each dot represents one individual mouse. Sample sizes are n = 11, 12, 6, 6 for control, PLX, control + ARL, PLX + ARL groups, respectively. p-values were determined by one-way ANOVA with Tukey post hoc test; *P < 0.05, **P < 0.01, ***P < 0.0001. Data are presented as mean ± s.e.m. Source data are provided as a Source Data file. p Schematics of the deduced mechanism in this study by which microglia modulate neurovascular coupling (Created in BioRender. Kuan, A. (2025) https://BioRender.com/h84u232). Upon neuronal excitation such as whisker stimulation, ATP is released from neurons or glia, and undergo microglia CD39-initiated hydrolysis, followed by CD73 or tissue-nonspecific alkaline phosphatase (TNAP)-mediated hydrolysis to form adenosine, leading to vasodilation.

References

    1. Lassen, N. A. Cerebral blood flow and oxygen consumption in man. Physiol. Rev.39, 183–238 (1959). - PubMed
    1. Schaeffer, S. & Iadecola, C. Revisiting the neurovascular unit. Nat. Neurosci.24, 1198–1209 (2021). - PMC - PubMed
    1. Berne, R. M., Winn, H. R. & Rubio, R. The local regulation of cerebral blood flow. Prog. Cardiovasc. Dis.24, 243–260 (1981). - PubMed
    1. Abbracchio, M. P., Burnstock, G., Verkhratsky, A. & Zimmermann, H. Purinergic signalling in the nervous system: an overview. Trends Neurosci.32, 19–29 (2009). - PubMed
    1. Burnstock, G. Purinergic signaling in the cardiovascular system. Circ. Res.120, 207–228 (2017). - PubMed

MeSH terms

LinkOut - more resources