. 2025 Feb 18;97(6):3608-3616.
doi: 10.1021/acs.analchem.4c06016. Epub 2025 Jan 22.

Innovative Ricin Toxin Detection: Unraveling Apurinic/Apyrimidinic Lyase Activity and Developing Fluorescence Sensors

Affiliations

Innovative Ricin Toxin Detection: Unraveling Apurinic/Apyrimidinic Lyase Activity and Developing Fluorescence Sensors

Tingting Liu et al. Anal Chem. .

Abstract

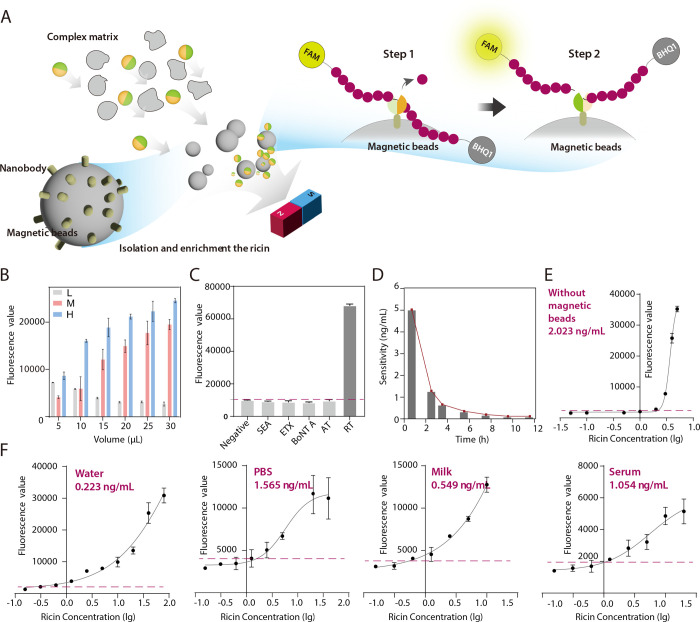
Ricin toxin (RT) is a potential bioterrorism agent because of its high potency, extremely small lethal dose, ease of preparation, and notable stability. Therefore, a portable method is urgently required to efficiently detect and determine the presence of toxicity of RT and evaluate its potency for public health monitoring and counter-bioterrorism responses. Currently, enzyme-based assays for detecting RT mainly focus on its N-glycosidase activity. In this study, we demonstrated that RT exhibits apurinic/apyrimidinic (AP) lyase activity using several methods. Characterization of the enzyme reaction and kinetics revealed that AP lyase activity is optimal at 59 °C and pH 4.0. This activity is highly pH-sensitive, remaining active between pH 3.0 and pH 4.6. Furthermore, we developed a portable fluorescence-based lateral flow assay (FLFA) that detects RT much faster than existing assays based on its N-glycosidase activity. Moreover, this assay can efficiently detect RT at nanogram levels from complex matrix samples within 1.5 h while simultaneously determining its biological activity. In conclusion, the discovery of the AP lyase activity of RT and the development of FLFA represent novel approaches for studying the enzymatic profiles of other ribosome-inactivating proteins.


Conflict of interest statement

The authors declare no competing financial interest.

Figures

Figure 1
Figure 1
Illustration of the overall research strategy. (A) Validation of the AP lyase activity and the mode of action of RT as a bifunctional enzyme. (B) Characterization of AP lyase activity of RT and its enzyme kinetics with different substrates. (C) Validation, establishment, and application of strategies for performing the FLFA to detect RT.
Figure 2
Figure 2
Validation of AP lyase activity of RT. (A) Schematic diagram of AP lyase. (B) Determination of purine or pyrimidine products when RT acts on different pure base substrates via HPLC MS/MS. (C) RT reacted with different substrates at 37 or 55 °C. L, M, and H represent RT concentrations of 10, 50, and 100 μg/mL, respectively. (D) Schematic representation of urea denaturation PAGE and the reaction of RT with DNA150. The concentrations of RT were 75, 100, and 150 μg/mL (from left to right). (E) MALDI-TOF MS detection of the reaction system of RT with MDNA15(A). The X-axis represents molecular mass, and the Y-axis represents peak intensity. The first two columns show cleavage products, the third column shows deadenine products, and the fourth column shows the reaction substrate. M and L represent RT concentrations of 50 and 10 μg/mL, respectively.
Figure 3
Figure 3
Results of optimal reaction conditions and enzymatic reaction kinetics. (A) Optimal temperature, pH, BSA concentration, and reaction buffer type and concentration for the AP lyase reaction. The blue and pink squares represent BSA and pH, respectively. The Y-axis on the left represents the reaction at different temperatures, while the Y-axis on the right represents the reaction at various pH and BSA concentrations. (B) Linear relationship between different substrate concentrations and fluorescence values. (C) Lineweaver–Burk equation for the reaction of RT with different substrates at 55 °C.
Figure 4
Figure 4
Establishing and verifying the feasibility of the fluorescence-based assay. (A) Schematic diagram of the principle of the fluorescence-based assay. (B) Exploration of optimal reaction volumes. L, M, and H represent RT concentrations of 10, 50, and 100 μg/mL, respectively. (C) Validation of the specificity of the fluorescence-based analysis using different toxins. (D) Relationship between detection limit and reaction time. The reaction times were 40 min, 2.5 h, 3.5 h, 5.5 h, 7.5 h, 9.5 h, and 11.5 h, respectively. (E) Detection limit without antibody-coated magnetic beads. RT was diluted into a gradient by sterile water. (F) Detection limits of the fluorescence-based analysis for samples with different complex matrices. All samples were enriched by antibody-coated magnetic beads before reaction. The red dashed line represents the mean plus three times the standard deviation of the fluorescence values for negative samples.
Figure 5
Figure 5
Establishment and Evaluation of FLFA. (A) Schematic of the reaction principle of FLFA. (B) Chromatographic results for substrates with different concentration gradients under bright field and fluorescence excitation. FBDNA10A was diluted with sterile water to 0.1, 0.2, 0.4, 0.6, 0.8, 1, 1.25, and 2.5 μM. The upper panel shows the chromatographic results under fluorescence excitation, and the lower panel shows the chromatographic results under bright field. (C) Specificity validation for FLFA. The vertical coordinate was the change in fluorescence value of FLFA after reaction of different toxins with FBDNA10A. The black dashed line represents the mean minus three times the standard deviation of the fluorescence values for negative samples. (D) Detection limits for milk, plasma, and urine analog samples using FLFA. The black dashed line represents three times the standard deviation of the fluorescence values for negative samples.

Similar articles

Cited by

References

    1. Musidlak O.; Nawrot R.; Gozdzicka-Jozefiak A. Which Plant Proteins Are Involved in Antiviral Defense? Review on In Vivo and In Vitro Activities of Selected Plant Proteins against Viruses. Int. J. Mol. Sci. 2017, 18 (11), 2300.10.3390/ijms18112300. - DOI - PMC - PubMed
    1. Oliveira G.; Schneedorf J. M. A Simple, Fast and Portable Method for Electrochemical Detection of Adenine Released by Ricin Enzymatic Activity. Toxins (Basel) 2021, 13 (4), 238.10.3390/toxins13040238. - DOI - PMC - PubMed
    1. Yang J.; Wang C.; Luo L.; Li Z.; Xu B.; Guo L.; Xie J. Highly sensitive MALDI-MS measurement of active ricin: insight from more potential deoxynucleobase-hybrid oligonucleotide substrates. Analyst 2021, 146 (9), 2955–2964. 10.1039/D0AN02205E. - DOI - PubMed
    1. Olsnes S.; Kozlov J. V. Ricin. Toxicon 2001, 2001 (39), 1723–1728. 10.1016/S0041-0101(01)00158-1. - DOI - PubMed
    1. Audi J.; Belson M.; Schier J.; Osterloh J. Martin Belson, Joshua Schier, John Osterloh. Ricin poisoning a comprehensive review. JAMA 2005, 294 (18), 2342–2351. 10.1001/jama.294.18.2342. - DOI - PubMed

LinkOut - more resources