. 2025 Jan 23;15(1):2891.
doi: 10.1038/s41598-025-87246-7.

Long noncoding RNA DHRS4 antisense RNA 1 suppresses osteosarcoma cell proliferation and promotes apoptosis through a competitive endogenous RNA mechanism

Affiliations

Long noncoding RNA DHRS4 antisense RNA 1 suppresses osteosarcoma cell proliferation and promotes apoptosis through a competitive endogenous RNA mechanism

Zhouzhou Tang et al. Sci Rep. .

Abstract

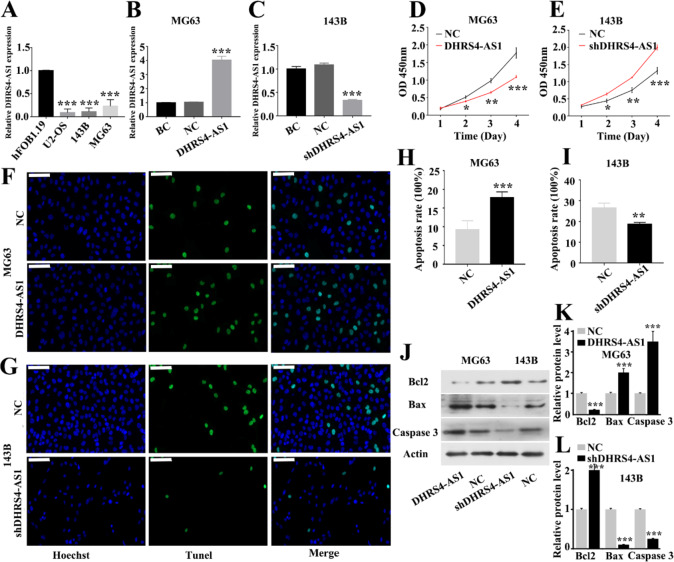
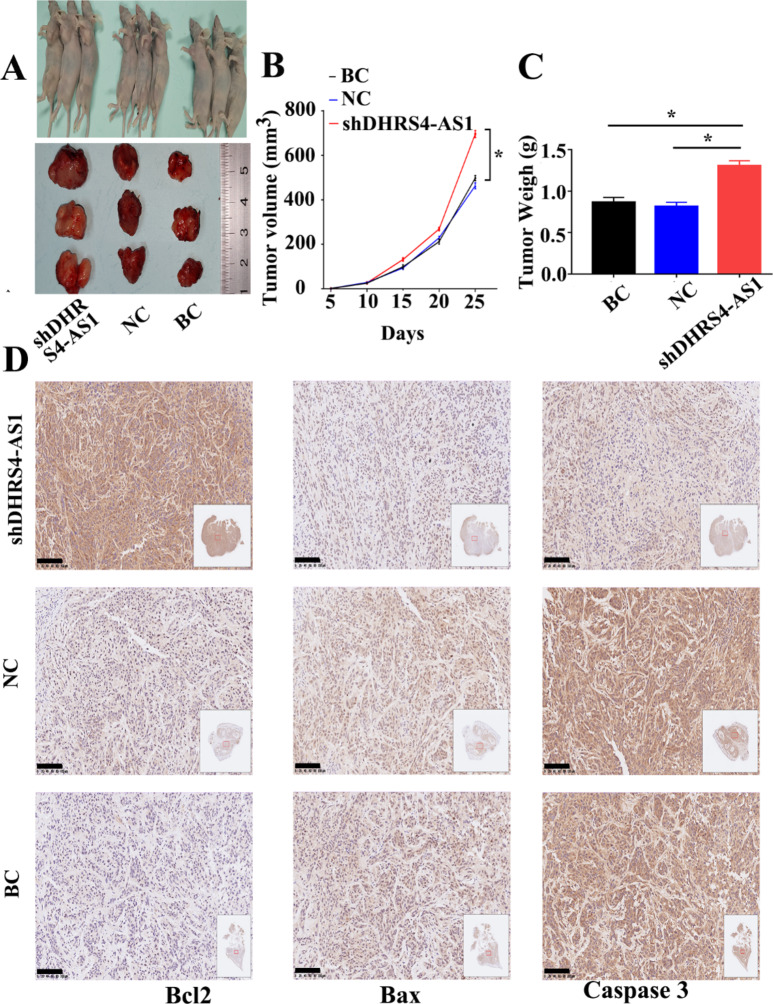
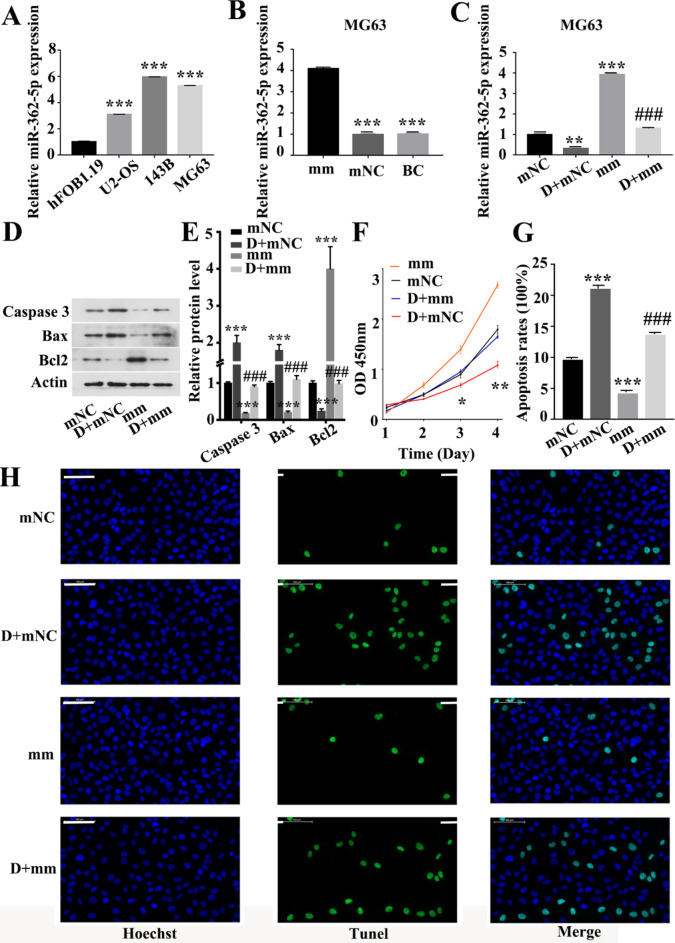
Osteosarcoma (OS) is the most common primary malignant bone tumor. Recent evidence suggests that the novel long noncoding RNA DHRS4 antisense RNA 1 (DHRS4-AS1) serves an important role in cancer progression and metastasis. However, its function and molecular mechanism in OS remain largely unknown. In the present study, DHRS4-AS1 expression was detected in OS cells by quantitative PCR. Gain- and loss-of-function experiments were conducted to study the effects of DHRS4-AS1 on the proliferation and apoptosis of OS cells. The potential mechanism of DHRS4-AS1 was examined through bioinformatics analysis and rescue experiments. DHRS4-AS1 was downregulated in OS cell lines. DHRS4-AS1 depletion promoted proliferation and inhibited apoptosis in OS cells, whereas DHRS4-AS1 overexpression had the opposite effects. Further research suggested that DHRS4-AS1 inhibited OS progression by regulating the microRNA-362-5p/aminopeptidase puromycin sensitive axis. The present findings suggested that DHRS4-AS1 may serve as a potential therapeutic target for OS.

Keywords: DHRS4-AS1; Long noncoding RNAs; MiR-362-5p; NPEPPS; Osteosarcoma.


Conflict of interest statement

Declarations. Competing interests: The authors declare no competing interests. Consent for publication: Not applicable. Ethics approval: The study was approved by the Ethics Committee of the Zhujiang Hospital of Southern Medical University (LAEC-2022-043).

Figures

Fig. 1
Fig. 1
Regulation of DHRS4-AS1 on OS cell proliferation and apoptosis in vitro. (A) Differential expression of DHRS4-AS1 in human osteoblast cell line and three OS cell lines, *Represent comparison with the hFOB1.19 group. (B) Overexpression expression of DHRS4-AS1 in MG63, *Represent comparison with the BC group. (C) DHRS4-AS1 silencing models in 143B cells, *Represent comparison with the BC group. (D) CCK-8 results showing proliferation level over 4 consecutive days for MG63 cells in each group, *Represent comparison with the NC group. (E) Proliferation level for 143B cells in each group, *Represent comparison with the NC group. (F) Tunel results showing apoptosis level for MG63 cells in each group. (G) Tunel results showing apoptosis level for 143B cells in each group. (H) Quantitative analysis of apoptosis rate of MG63 cells in different groups, *Represent comparison with the NC group. (I) Quantitative analysis of apoptosis rate of 143B cells in different groups, *Represent comparison with the NC group. (J) Apoptosis-related protein levels of MG63 and 143B cells in each group were determined using western blot. (K) Quantitative analysis of apoptosis-related protein in MG63 cells, *Represent comparison with the NC group. (L) Quantitative analysis of apoptosis-related protein in 143B cells, *Represent comparison with the NC group. *p<0.05, **p<0.01, ***p<0.001, the scale is 100 μm. BC and NC represent Blank Control and Negative Control respectively.
Fig. 2
Fig. 2
Regulation of DHRS4-AS1 on OS cell proliferation and apoptosis in vivo. (A) Representative photo of nude mouse tumors. (B) The tumor size were measured after different treatments. (C) The weight were measured. (D) Immunohistochemical staining of apoptosis related proteins in each group. *p<0.05, the scale is 100 μm. BC and NC represent Blank Control and Negative Control respectively.
Fig. 3
Fig. 3
Prediction and Functional enrichment analysis of DHRS4-AS1 target genes. (A) Venn diagram representing the number of up-regulated miRNAs in GSE28423 and potential target genes of DHRS4-AS1 predicted by starbase. (B) Venn diagram representing the number of target mRNAs of miR-330-3p and miR-362-5p predicted by miRDB, TarScan and mirTarBase. C DHRS4-AS1-dependent lncRNA subnetwork. (D-E) univariate Cox regression and multivariate Cox regression of potential target genes. (F) Verify the accuracy of the model based on risk score (AUC > 0.7).
Fig. 4
Fig. 4
Construction of DHRS4-AS1 dependent ceRNA network and screening of target genes of DHRS4-AS1. (A-D) Identification of interaction correlation and survival analysis of target genes. (E-F) Dataset validation analysis of NPEPPS and FBXL17 based on GSE126209 dataset.
Fig. 5
Fig. 5
DHRS4-AS1 directly interacts with miR-362-5p and represses its expression. (A) The expression level of miR-362-5p in osteosarcoma cell lines and the human osteoblast cell line, *Represent comparison with the Hfob1.19 group. (B) The expression level of miR-362-5p in MG63 cells was increased after transfection with miR-362-5p mimic, *Represent comparison with the mm group. (C) After co-transfection with DHRS4-AS1 and miR-362-5p mimic, DHRS4-AS1 reversed the high expression of miR-362-5p in MG63 cells, *Represent comparison with the mNC group, # represents comparison with the mm group. (D-E) Expression levels of apoptosis-related proteins in MG63 cells, *Represent comparison with the mNC group, # represents comparison with the mm group. (F) cck8 assay was performed to detect the proliferation and apoptosis levels of MG63 cells after co-transfection with DHRS4-AS1 and miR-362-5p mimic, *Represent comparison with the mNC group, # represents comparison with the mm group. (G) Quantification of apoptosis rate in MG63 cells after co-transfection with DHRS4-AS1 and miR-362-5p mimic, *Represent comparison with the mNC group, # represents comparison with the mm group. (H) Tunel detection of apoptosis in MG63 cells after co-transfection with DHRS4-AS1 and miR-362-5p mimic. *p<0.05, **p<0.01, ***p<0.001, ###p<0.001, the scale is 100 μm. mm represent miR-362-5p mimic group. mNC represent the mimic Negative Control group. D + mm represents the DHRS4-AS1 + miR-362-5p mimic group, indicating that both DHRS4-AS1 and miR-362-5p are overexpressed. D + mNC represents the DHRS4-AS1 + mimic Negative Control group, indicating that DHRS4-AS is overexpressed but not expressing miR-362-5p. BC represents Blank Control group.
Fig. 6
Fig. 6
MiR-362-5p mediates the proliferation and apoptosis of OS cells through NPEPPS. (A-B) The expression level of NPEPPS in osteosarcoma cell lines and the human osteoblast cell line, *Represent comparison with the Hfob1.19 group. (C-D) NPEPPS was overexpressed in MG63 OS cells, *Represent comparison with the pN group. (E-F) the expression level of NPEPPS and poptosis related protein in MG63 cells after cotransfected miR-362-5p mimic and NPEPPS, *Represent comparison with the NC group. (G) The Tunel assay was used to successfully detect apoptosis in MG63 cells after co-transfection with miR-362-5p mimetics and NPEPPS. (H) The CCK-8 assay was employed to determine the proliferation and apoptosis levels of MG63 cells co-transfected with miR-362-5p mimetics and NPEPPS, *Represent comparison with the NC group. (I) The apoptosis rate in MG63 cells co-transfected with miR-362-5p mimic and NPEPPS was quantified, *Represent comparison with the NC group, # represents comparison with the pN group. *p<0.05, **p<0.01, ***p<0.001, #p<0.01, ##p<0.001, ###p<0.001, the scale is 100 μm. NC represents Negative Control group. BC represents Blank Control group. mm represent miR-362-5p mimic group. pN represents the pCMV NPEPPS group, which overexpresses NPEPPS using the pCMV NPEPPS vector. mm + pN represents the miR-362-5p mimetic + pCMV NPEPP group, indicating the overexpression of both miR-362-5p and NPEPPS using miR-362-5p mimetic transfection and pCMV NPEP vector.

Similar articles

Cited by

References

    1. Sadykova, L. R. et al. Epidemiology and risk factors of Osteosarcoma. Cancer Invest.38, 259–269. 10.1080/07357907.2020.1768401 (2020). - PubMed
    1. Chen, C. et al. Immunotherapy for osteosarcoma: fundamental mechanism, rationale, and recent breakthroughs. Cancer Lett.500, 1–10. 10.1016/j.canlet.2020.12.024 (2021). - PubMed
    1. Lin, W. et al. Analysis of miR-148b expression differences in stage-I and II parosteal osteosarcoma. Oncol. Lett.16, 998–1002. 10.3892/ol.2018.8709 (2018). - PMC - PubMed
    1. Park, J. A. & Cheung, N. V. Promise and challenges of T Cell Immunotherapy for Osteosarcoma. Int. J. Mol. Sci.2410.3390/ijms241512520 (2023). - PMC - PubMed
    1. Heymann, M. F., Brown, H. K. & Heymann, D. Drugs in early clinical development for the treatment of osteosarcoma. Expert Opin. Investig. Drugs. 25, 1265–1280. 10.1080/13543784.2016.1237503 (2016). - PubMed