. 2023 Oct 11;1(1):13.
doi: 10.1038/s44259-023-00014-3.

Profile and resistance levels of 136 integron resistance genes

Affiliations

Profile and resistance levels of 136 integron resistance genes

Alberto Hipólito et al. NPJ Antimicrob Resist. .

Abstract

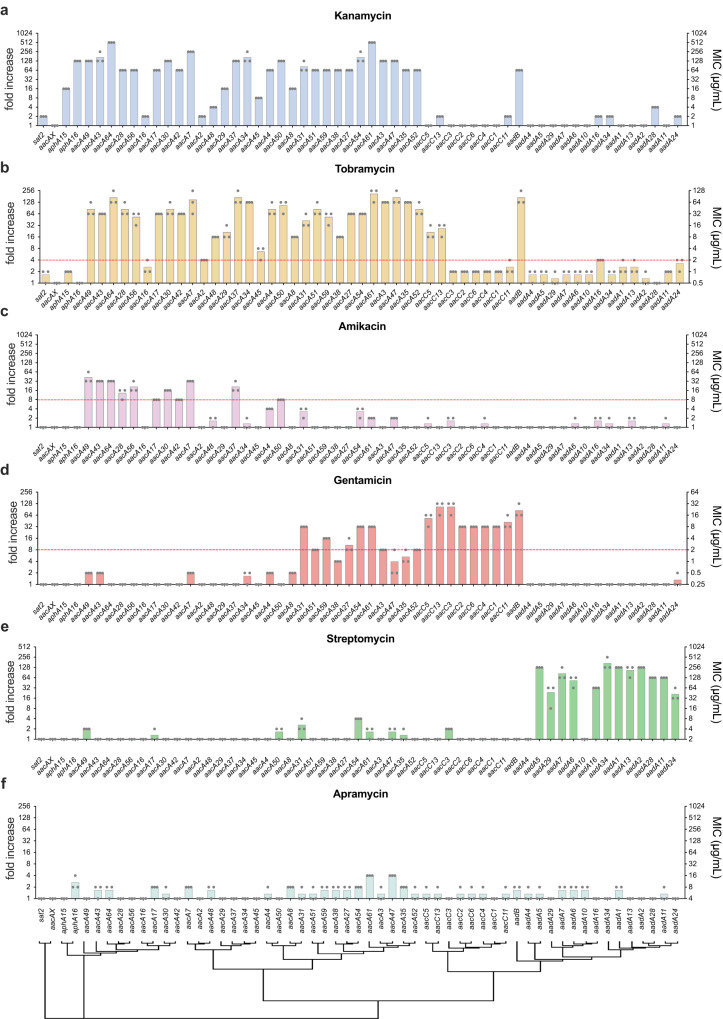
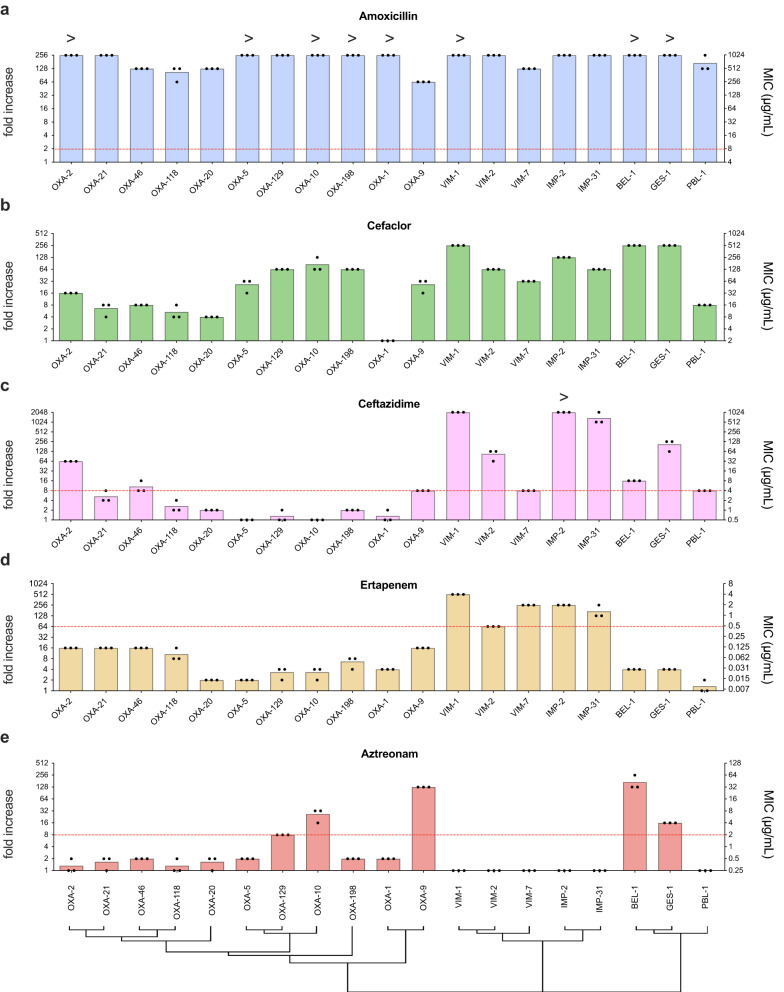
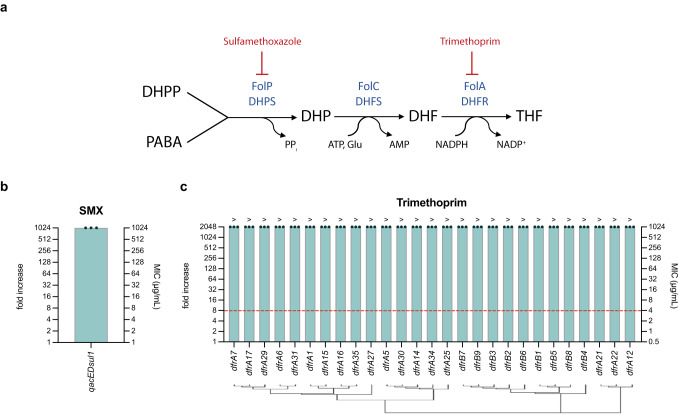
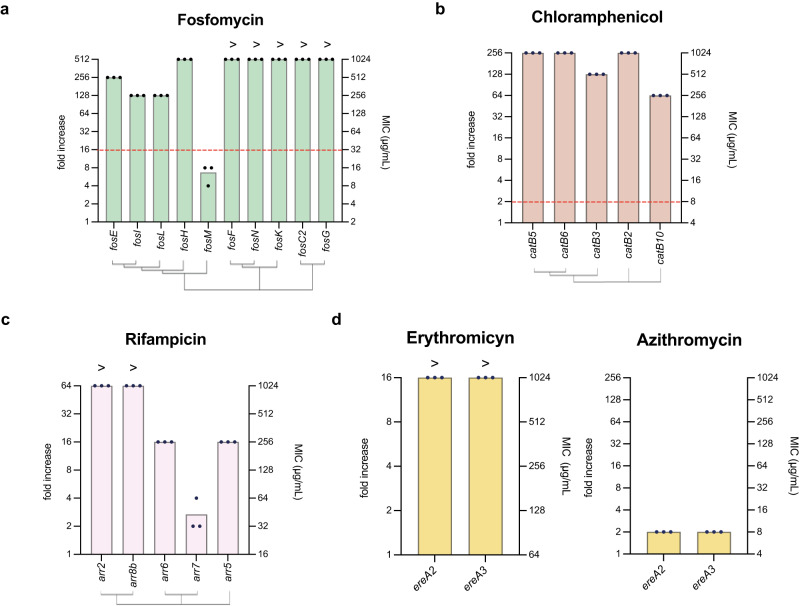
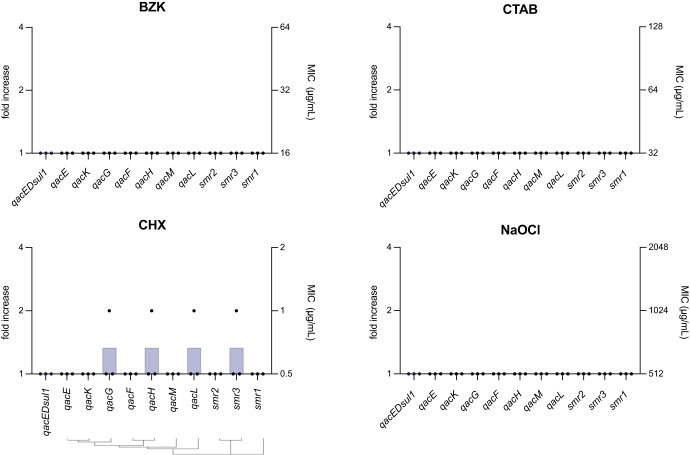
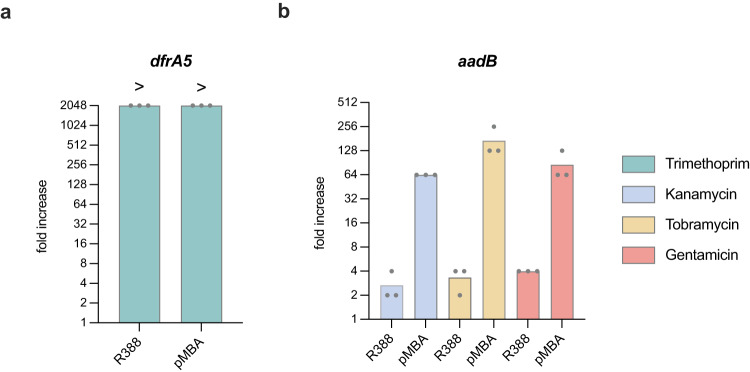
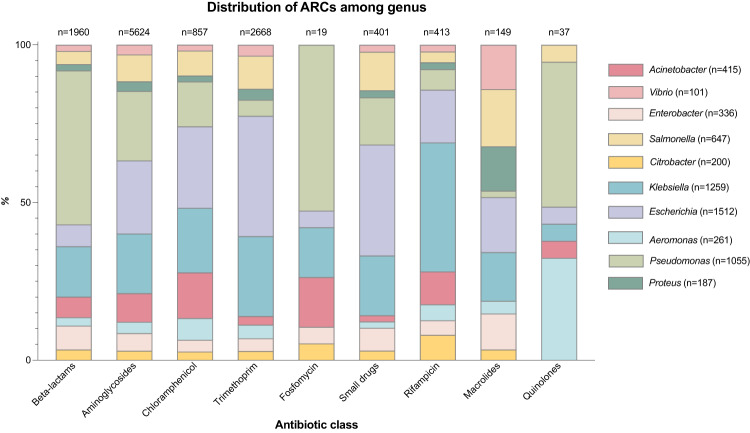
Integrons have played a major role in the rise and spread of multidrug resistance in Gram-negative pathogens and are nowadays commonplace among clinical isolates. These platforms capture, stockpile, and modulate the expression of more than 170 antimicrobial resistance cassettes (ARCs) against most clinically-relevant antibiotics. Despite their importance, our knowledge on their profile and resistance levels is patchy, because data is scattered in the literature, often reported in different genetic backgrounds and sometimes extrapolated from sequence similarity alone. Here we have generated a collection of 136 ARCs against 8 antibiotic families and disinfectants. Cassettes are cloned in a vector designed to mimic the genetic environment of a class 1 integron, and transformed in Escherichia coli. We have measured the minimal inhibitory concentration (MIC) to the most relevant molecules from each antibiotic family. With more than 500 MIC values, we provide an exhaustive and comparable quantitation of resistance conferred by ARCs. Our data confirm known resistance trends and profiles while revealing important differences among closely related genes. We have also detected genes that do not confer the expected resistance, to the point of challenging the role of the whole family of qac genes in resistance against disinfectants. Our work provides a detailed characterization of integron resistance genes at-a-glance.


Conflict of interest statement

Competing interests: The authors declare no competing interests.

Figures

Fig. 1
Fig. 1. Antimicrobial resistance cassettes in integrons and the generation of the pMBA collection.
a Distribution of ARCs families found in mobile integrons retrieved from IntegrAll database analysis (QACs quaternary ammonium compounds, Cm chloramphenicol, Rif Rifampin) (Modified from ref. ). b Diagram of pMBA-derived vectors encoding ARCs. c Histogram showing the number of ARCs cloned or not against each antimicrobial family (aa aminoglycoside resistant gene, dfr dihydrofolate reductase, bla beta-lactamase, fos phosphomycin resistance gene, qac quaternary ammonium compounds resistance gene, smr small multidrug resistance gene, cat and cml chloramphenicol resistance genes, arr rifampicin resistance gene, sul sulfonamide resistance gene, qnrVC quinolone resistance gene, lnu lincosamide resistance gene, ere erythromycin resistance gene).
Fig. 2
Fig. 2. MICs of aminoglycoside resistance cassettes.
Antimicrobial resistance to kanamycin (a), tobramycin (b), amikacin (c), gentamicin (d), streptomycin (e), and apramycin (f) is shown as MIC (μg/mL) in the right axis, and resistance fold increase compared to pMBA in the left axis. The MIC is the mean of three biological replicates (black dots) for each strain. A red dotted line represents the clinical breakpoint (EUCAST) for E. coli against this antimicrobial. A hierarchical clustering tree showing protein sequence similarity is shown under the graphs.
Fig. 3
Fig. 3. MICs of beta-lactam resistance cassettes.
Antimicrobial resistance to amoxicillin (a), cefaclor (b), ceftazidime (c), ertapenem (d), and aztreonam (e) is shown as MIC (μg/mL) in the right axis, and resistance fold increase compared to the empty pMBA control in the left axis. The MIC is the mean of three biological replicates (black dots) for each strain. A red dotted line represents the clinical breakpoint (EUCAST) for E. coli against this antimicrobial. A hierarchical clustering tree showing protein sequence similarity is shown under the graphs.
Fig. 4
Fig. 4. Resistance to antifolates.
a Folate biosynthesis pathway. FolP/DHPS condenses P-aminobenzoic acid (PABA) and 6-hydroxymethyl-7,8- dihydropterin pyrophosphate (DHPP) into 7,8 dihydropteroate (DHP). FolP is inhibited by sulfonamides (PABA analogs). DHP is then converted to 7,8 dihydrofolate (DHF) by the action of FolC/DHFS; which is again modified by the action of FolA/DHFR into 5,6,7,8-tetrahydrofolate (THF). The action of FolA/DHFR can be inhibited by the drug trimethoprim. Modified from b and c MIC of qacE∆sul1 and dfr cassettes against antifolate antibiotics. Antimicrobial resistance to sulfamethoxazole (SMX) (b) and trimethoprim (c) is shown as MIC (μg/mL) in the right axis, and resistance fold increase compared to the empty pMBA control in the left axis. The MIC is the mean of three biological replicates (black dots) for each strain. A red dotted line represents the clinical breakpoint (EUCAST) for E. coli against this antimicrobial. A hierarchical clustering tree showing protein sequence similarity is shown under the graph for trimethoprim.
Fig. 5
Fig. 5. MICs of other ARCs.
Antimicrobial resistance to fosfomycin (a), chloramphenicol (b), rifampicin (c), erythromycin, and azithromycin (d) is shown as MIC (μg/mL) in the right axis, and resistance fold increase compared to the empty pMBA control in the left axis. The MIC is the mean of three biological replicates (black dots) for each strain. A red dotted line represents the clinical breakpoint (EUCAST) for E. coli against this antimicrobial. A hierarchical clustering tree showing protein sequence similarity is shown under the graphs.
Fig. 6
Fig. 6. MIC characterization of qac and smr ARCs.
Antimicrobial resistance to antiseptics chlorhexidine (CHX), benzalkonium chloride (BZK), cetyltrimethylammonium bromide (CTAB), and sodium hypochlorite (NaOCl). MIC (μg/mL) is shown in the right axis, and resistance fold increase compared to pMBA in the left axis. The MIC is the mean of three biological replicates (black dots) for each strain. A hierarchical clustering tree showing protein sequence similarity is shown under the graphs.
Fig. 7
Fig. 7. Comparison of the MIC of ARCs in different genetic contexts.
Antimicrobial resistance of dfrA5 (a), and aadB (b), in R388 is shown as resistance fold increase compared to MG1655 without the plasmid. The MIC is the mean of three biological replicates (black dots) for each strain. MIC values for pMBA derivatives are taken from Figs. 2 and 4 and plotted side by side for comparison.
Fig. 8
Fig. 8. Distribution of ARCs by antibiotic class among different bacterial genus.
Each column represents the whole set of reports of ARCs against a given antimicrobial family available in IntegrAll (each ARC can be reported more than once). Colors represent the bacterial genus in which it was found.

Similar articles

Cited by

References

    1. O´Neill, J. Antimicrobial Resistance: Tackling a crisis for the health and wealth of nations The Review on Antimicrobial Resistance Chaired b by J O’Neil, and supported by the Wellcome Trust and the UK Government. (2014).
    1. Murray, C. J. et al. Global burden of bacterial antimicrobial resistance in 2019: a systematic analysis. Lancet399, 629–655 (2022). - PMC - PubMed
    1. Mitshuhashi, S., Harada, K., Hashimoto, H. & Egawa, R. On the drug-resistance of enteric bacteria. 4. Drug-resistance of Shigella prevalent in Japan. Jpn J. Exp. Med.31, 47–52 (1961). - PubMed
    1. Stokes, H. W. & Hall, R. M. A novel family of potentially mobile DNA elements encoding site-specific gene-integration functions: integrons. Mol. Microbiol.3, 1669–1683 (1989). - PubMed
    1. Escudero JA, Loot C, Nivina A, Mazel. D. The integron: Adaption on demand. Microbiol. Spectr. 10.1128/microbiolspec (2014). - PubMed

LinkOut - more resources