. 2024 Feb 20;2(1):4.
doi: 10.1038/s44259-024-00022-x.

Antimicrobial peptide glatiramer acetate targets Pseudomonas aeruginosa lipopolysaccharides to breach membranes without altering lipopolysaccharide modification

Affiliations

Antimicrobial peptide glatiramer acetate targets Pseudomonas aeruginosa lipopolysaccharides to breach membranes without altering lipopolysaccharide modification

Ronan A Murphy et al. NPJ Antimicrob Resist. .

Abstract

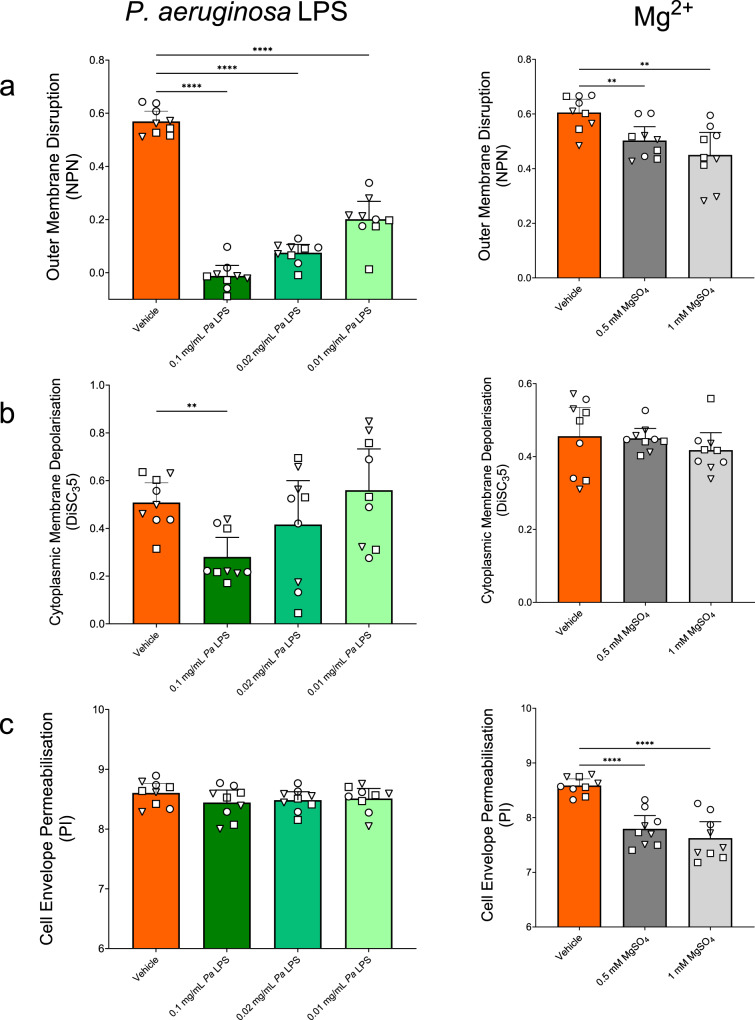
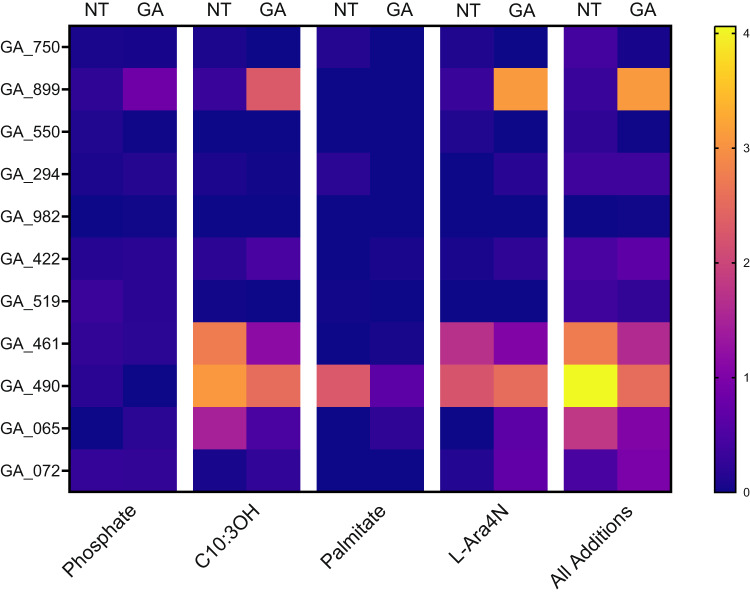
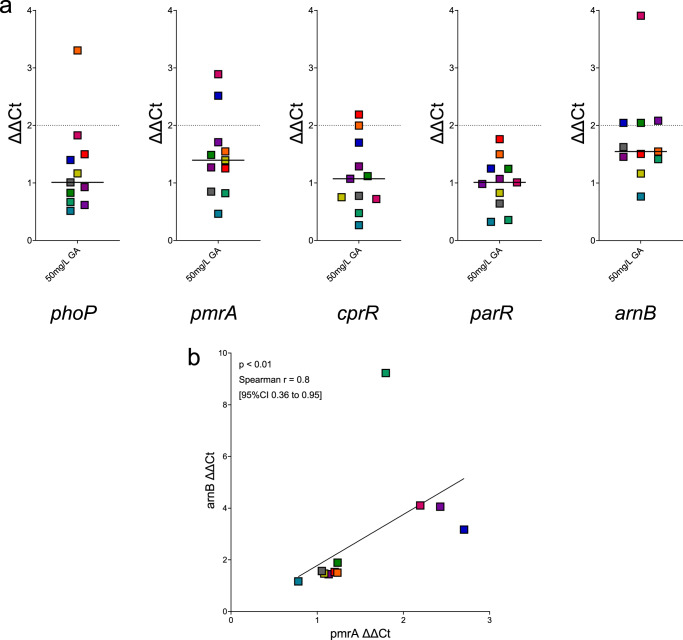
Antimicrobial peptides (AMPs) are key components of innate immunity across all domains of life. Natural and synthetic AMPs are receiving renewed attention in efforts to combat the antimicrobial resistance (AMR) crisis and the loss of antibiotic efficacy. The gram-negative pathogen Pseudomonas aeruginosa is one of the most concerning infecting bacteria in AMR, particularly in people with cystic fibrosis (CF) where respiratory infections are difficult to eradicate and associated with increased morbidity and mortality. Cationic AMPs exploit the negatively charged lipopolysaccharides (LPS) on P. aeruginosa to bind and disrupt bacterial membrane(s), causing lethal damage. P. aeruginosa modifies its LPS to evade AMP killing. Free-LPS is also a component of CF sputum and feeds pro-inflammatory cycles. Glatiramer acetate (GA) is a random peptide co-polymer-of glycine, lysine, alanine, tyrosine-used as a drug in treatment of multiple sclerosis (MS); we have previously shown GA to be an AMP which synergises with tobramycin against CF P. aeruginosa, functioning via bacterial membrane disruption. Here, we demonstrate GA's direct binding and sequestration/neutralisation of P. aeruginosa LPS, in keeping with GA's ability to disrupt the outer membrane. At CF-relevant LPS concentrations, however, membrane disruption by GA was not strongly inhibited. Furthermore, exposure to GA did not result in increased Lipid A modification of LPS or in increased gene expression of systems involved in AMP sensing and LPS modification. Therefore, despite the electrostatic targeting of LPS by GA as part of its activity, P. aeruginosa does not demonstrate LPS modification in its defence.


Conflict of interest statement

Competing interests: The Authors declare the following competing interests; Cycle Pharmaceuticals provided Glatiramer Acetate as an in-kind contribution to the CF Trust grant for this work. GA is under license at the University of Aarhus, at which T.V.-J. is employed.

Figures

Fig. 1
Fig. 1. Bilateral sequestration of GA and P. aeruginosa LPS.
a Neutralisation of P. aeruginosa LPS was calculated as the percentage reduction of the quantifiable LPS in the presence of GA at each LPS concentration. Incubation of 0.02 (p = 0.0186) and 0.01 mg/mL (p = 0.0499) LPS with GA significantly increased neutralisation of LPS, compared to no GA (Kruskal-Wallis test with Dunn’s multiple comparison). (Median with 95%CI. n = 3). b The ability of 50 mg/L GA to disrupt the Outer Membrane of P. aeruginosa type strains was significantly reduced by 30 min pre-incubation with all P. aeruginosa LPS concentrations tested (each p < 0.0001). c The ability of 50 mg/L GA to depolarise the Cytoplasmic Membrane of P. aeruginosa type strains was significantly reduced by incubation with P. aeruginosa LPS concentration of 0.1 mg/mL (p < 0.0001) but not 0.02 mg/mL or 0.01 mg/mL. d The ability of 50 mg/L GA to permeabilise the Cell Envelope of P. aeruginosa type strains was significantly reduced by incubation with all P. aeruginosa LPS concentrations tested – 0.1 (p = 0.0002), 0.02 (p = 0.0024) and 0.01 mg/mL (p = 0.0031). bd Log transformed data tested using Welch ANOVA with Dunnett’s T3 multiple comparison. Medians with 95% CIs of biological replicates (n = 9) of P. aeruginosa PAO1 (◯), PA14 (☐) or PAK (△).
Fig. 2
Fig. 2. Effect of presence of CF sputum components on membrane perturbations resulting from 50 mg/L GA in P. aeruginosa strains PAO1, PA14 and PAK.
a Disruption of the OM of P. aeruginosa by GA was significantly reduced by each concentration of LPS tested (each p < 0.0001) while Mg2+ at 1 (p = 0.0051) and 0.5 mM (p = 0.0081) both also reduced GA activity. b Depolarisation of the CMs of P. aeruginosa by GA was only significantly reduced by LPS at the supraphysiological concentration of 0.1 mg/mL (p = 0.001) and was unaltered by Mg2+ presence. c Permeabilisation of the CE of P. aeruginosa by GA was not seen for any LPS concentration tested but was significantly reduced by Mg2+ (each p < 0.0001). Log transformed data tested using Welch ANOVA with Dunnett’s T3 multiple comparison. Medians with 95% CIs of biological replicates (n = 9) of P. aeruginosa PAO1 (◯), PA14 (☐) or PAK (△).
Fig. 3
Fig. 3. Effect of GA on DNA availability and effect of CF-relevant DNA on GA activity.
a Neutralisation of DNA was calculated as the percentage reduction of the detectable DNA in the presence of GA at each DNA concentration. All GA concentrations >25 mg/L significantly increased DNA neutralisation. At 1 mg/mL DNA, GA at 25 (p = 0.0111), 50 (p = 0.0068) and 100 mg/mL (p < 0.0001) while at 10 mg/mL DNA, GA at 25 (p = 0.0223), 50 (p = 0.0027) and 100 mg/mL (p < 0.0001) showed neutralisation (Kruskal-Wallis test with Dunn’s multiple comparison). (Medians with 95%CI. n = 5). The CF-relevant concentration of 1 mg/mL DNA did not alter the ability of 50 mg/L GA to disrupt the OM (b), depolarise the CM (c) or permeabilise the CE (d) of P. aeruginosa PAO1 (◯), PA14 (☐) or PAK (△). Welch’s t test of Log transformed data. Medians with 95%CIs of biological replicates (n = 9).
Fig. 4
Fig. 4. Additions to LPS Lipid A of P. aeruginosa type strains PAO1, PA14 and PAK in response to AMP exposure.
Heatmap of ratios of Native Lipid A:Modified Lipid A for each modification type. No significant differences from No Treatment (NT) were seen for any modification type as the result of any AMP tested; 50 mg/L GA, 0.5 mg/L CST or 16 mg/L LL-37 (Friedman test with Dunn’s multiple comparison). Median values of triplicate biological replicates, except LL-37 which was run in duplicate due to resource limitation. Full modifications values can be found in Supplementary Material.
Fig. 5
Fig. 5. Additions to LPS Lipid A of P. aeruginosa clinical strains from people with CF in response to GA exposure.
Heatmap of the ratios of Modified Lipid A:Native Lipid A for each modification type. No significant differences resulted from exposure to 50 mg/L GA, from No Treatment, for any modification type across the 11 clinical strains (Wilcoxon test). Median values of triplicate biological replicates. *GA_899 biological duplicates displayed as one replicate lost for technical reasons. Median value of biological replicates displayed. Full modifications values can be found in Supplementary Material.
Fig. 6
Fig. 6. Expression of TCS genes phoP, pmrA, cprR and parR and L-Ara4N modification gene arnB of P. aeruginosa strains PAO1, PA14 and PAK after exposure to AMPs GA, CST and LL-37.
ΔΔCt results of gene expression, normalised to untreated P. aeruginosa. Only exposure to LL-37 resulted in fold increases in gene expression >2 with median expression of phoP of 4.06 (95%CI 1.26–4.20), pmrA of 5.08 (95%CI 1.91–9.13) and arnB of 8.55 (95%CI 4.29–11.54). Each point is the median of biological replicates for P. aeruginosa PAO1 (◯), PA14 (☐) or PAK (△). Line at median. Gene expression values can be found in Supplementary Material.
Fig. 7
Fig. 7. Expression of TCS genes phoP, pmrA, cprR and parR and L-Ara4N modification gene arnB of P. aeruginosa clinical strains from people with CF after exposure to GA.
a ΔΔCt results of gene expression, normalised to untreated P. aeruginosa for each strain. No gene tested had >2-fold (dotted line) median increase across the 11 clinical P. aeruginosa tested. On each graph, each point is the median of biological replicates for a clinical P. aeruginosa strain, solid line at median. b Correlation analysis of ΔΔCt expression levels of pmrA and arnB. Across the clinical strains tested, there was significant positive correlation between the expression of pmrA and arnB after exposure to GA (p = 0.0047, Spearman r = 0.8 [95%CI 0.36–0.95]. n = 11). Strain colour coding and gene expression values can be found in Supplementary Material.

Similar articles

References

    1. Murray, C. J. et al. Global burden of bacterial antimicrobial resistance in 2019: a systematic analysis. Lancet399, 629–655 (2022). - PMC - PubMed
    1. Laxminarayan, R. The overlooked pandemic of antimicrobial resistance. Lancet399, 606–607 (2022). - PMC - PubMed
    1. Fowler, V. G., Jezek, A., Spivak, E. S. & Talkington, K. Urgent, Comprehensive Federal Action Needed To Stem Mortality and Medicare Costs Associated With Antimicrobial Resistance. Clin. Infect. Dis. 74, 1107–1111 (2021). - PMC - PubMed
    1. O’Neill, J. Tackling drug-resistant infections globally: final report and recommendations: the review on antimicrobial resistance. 1–35 https://amr-review.org/sites/default/files/160525_Final%20paper_with%20c... (2019).
    1. Mestrovic, T. et al. The burden of bacterial antimicrobial resistance in the WHO European region in 2019: a cross-country systematic analysis. Lancet Public Heal. 10.1016/S2468-2667(22)00225-0 (2022). - PMC - PubMed

LinkOut - more resources