. 2025 May;32(5):876-883.
doi: 10.1038/s41594-024-01472-7. Epub 2025 Jan 22.

The conformational landscape of human transthyretin revealed by cryo-EM

Affiliations

The conformational landscape of human transthyretin revealed by cryo-EM

Benjamin Basanta et al. Nat Struct Mol Biol. 2025 May.

Abstract

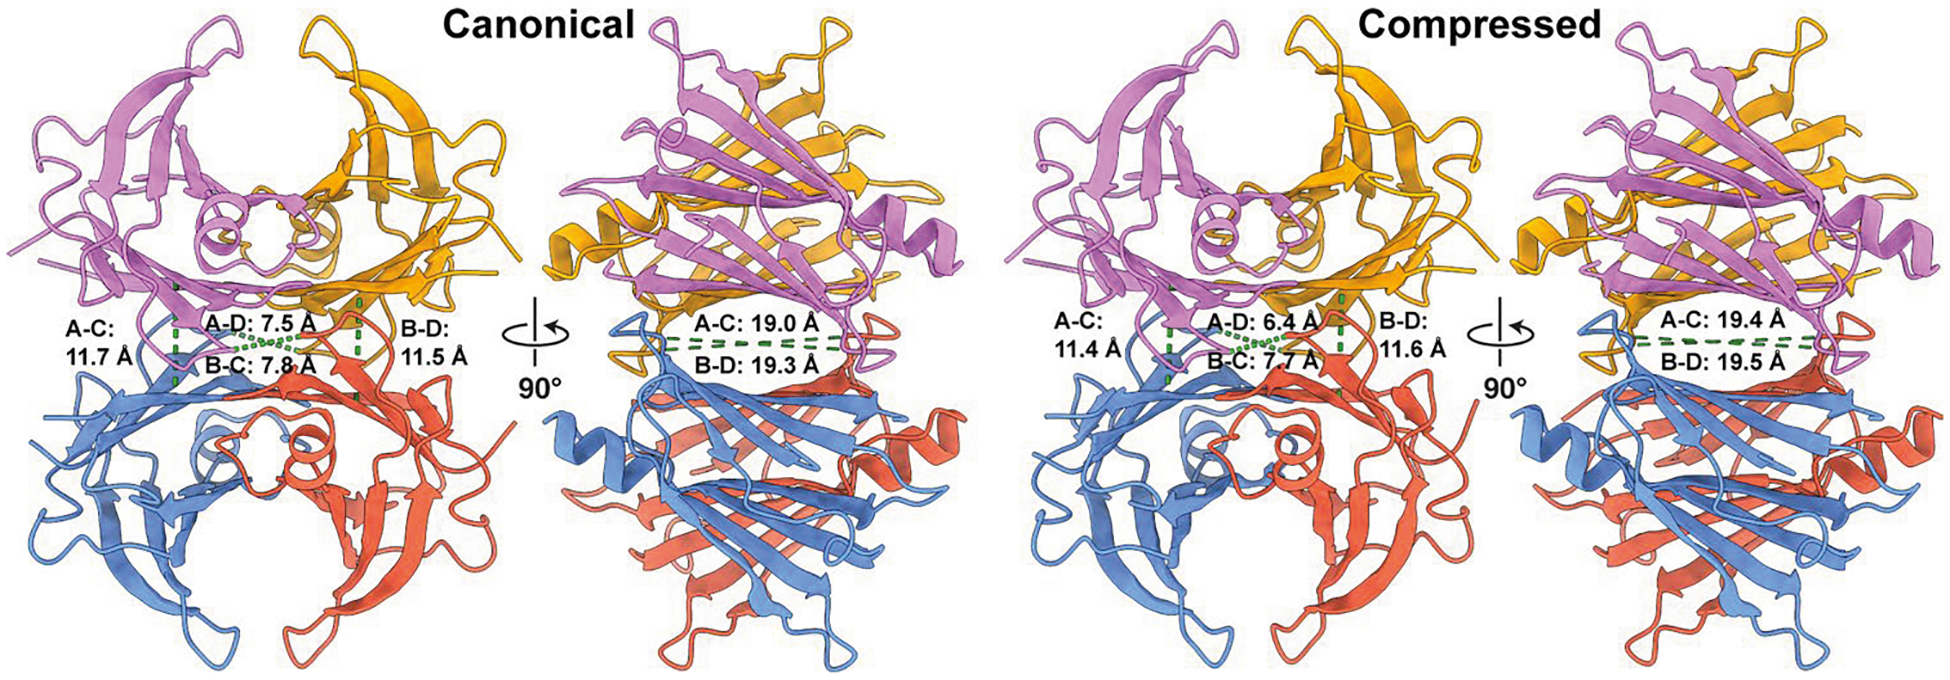
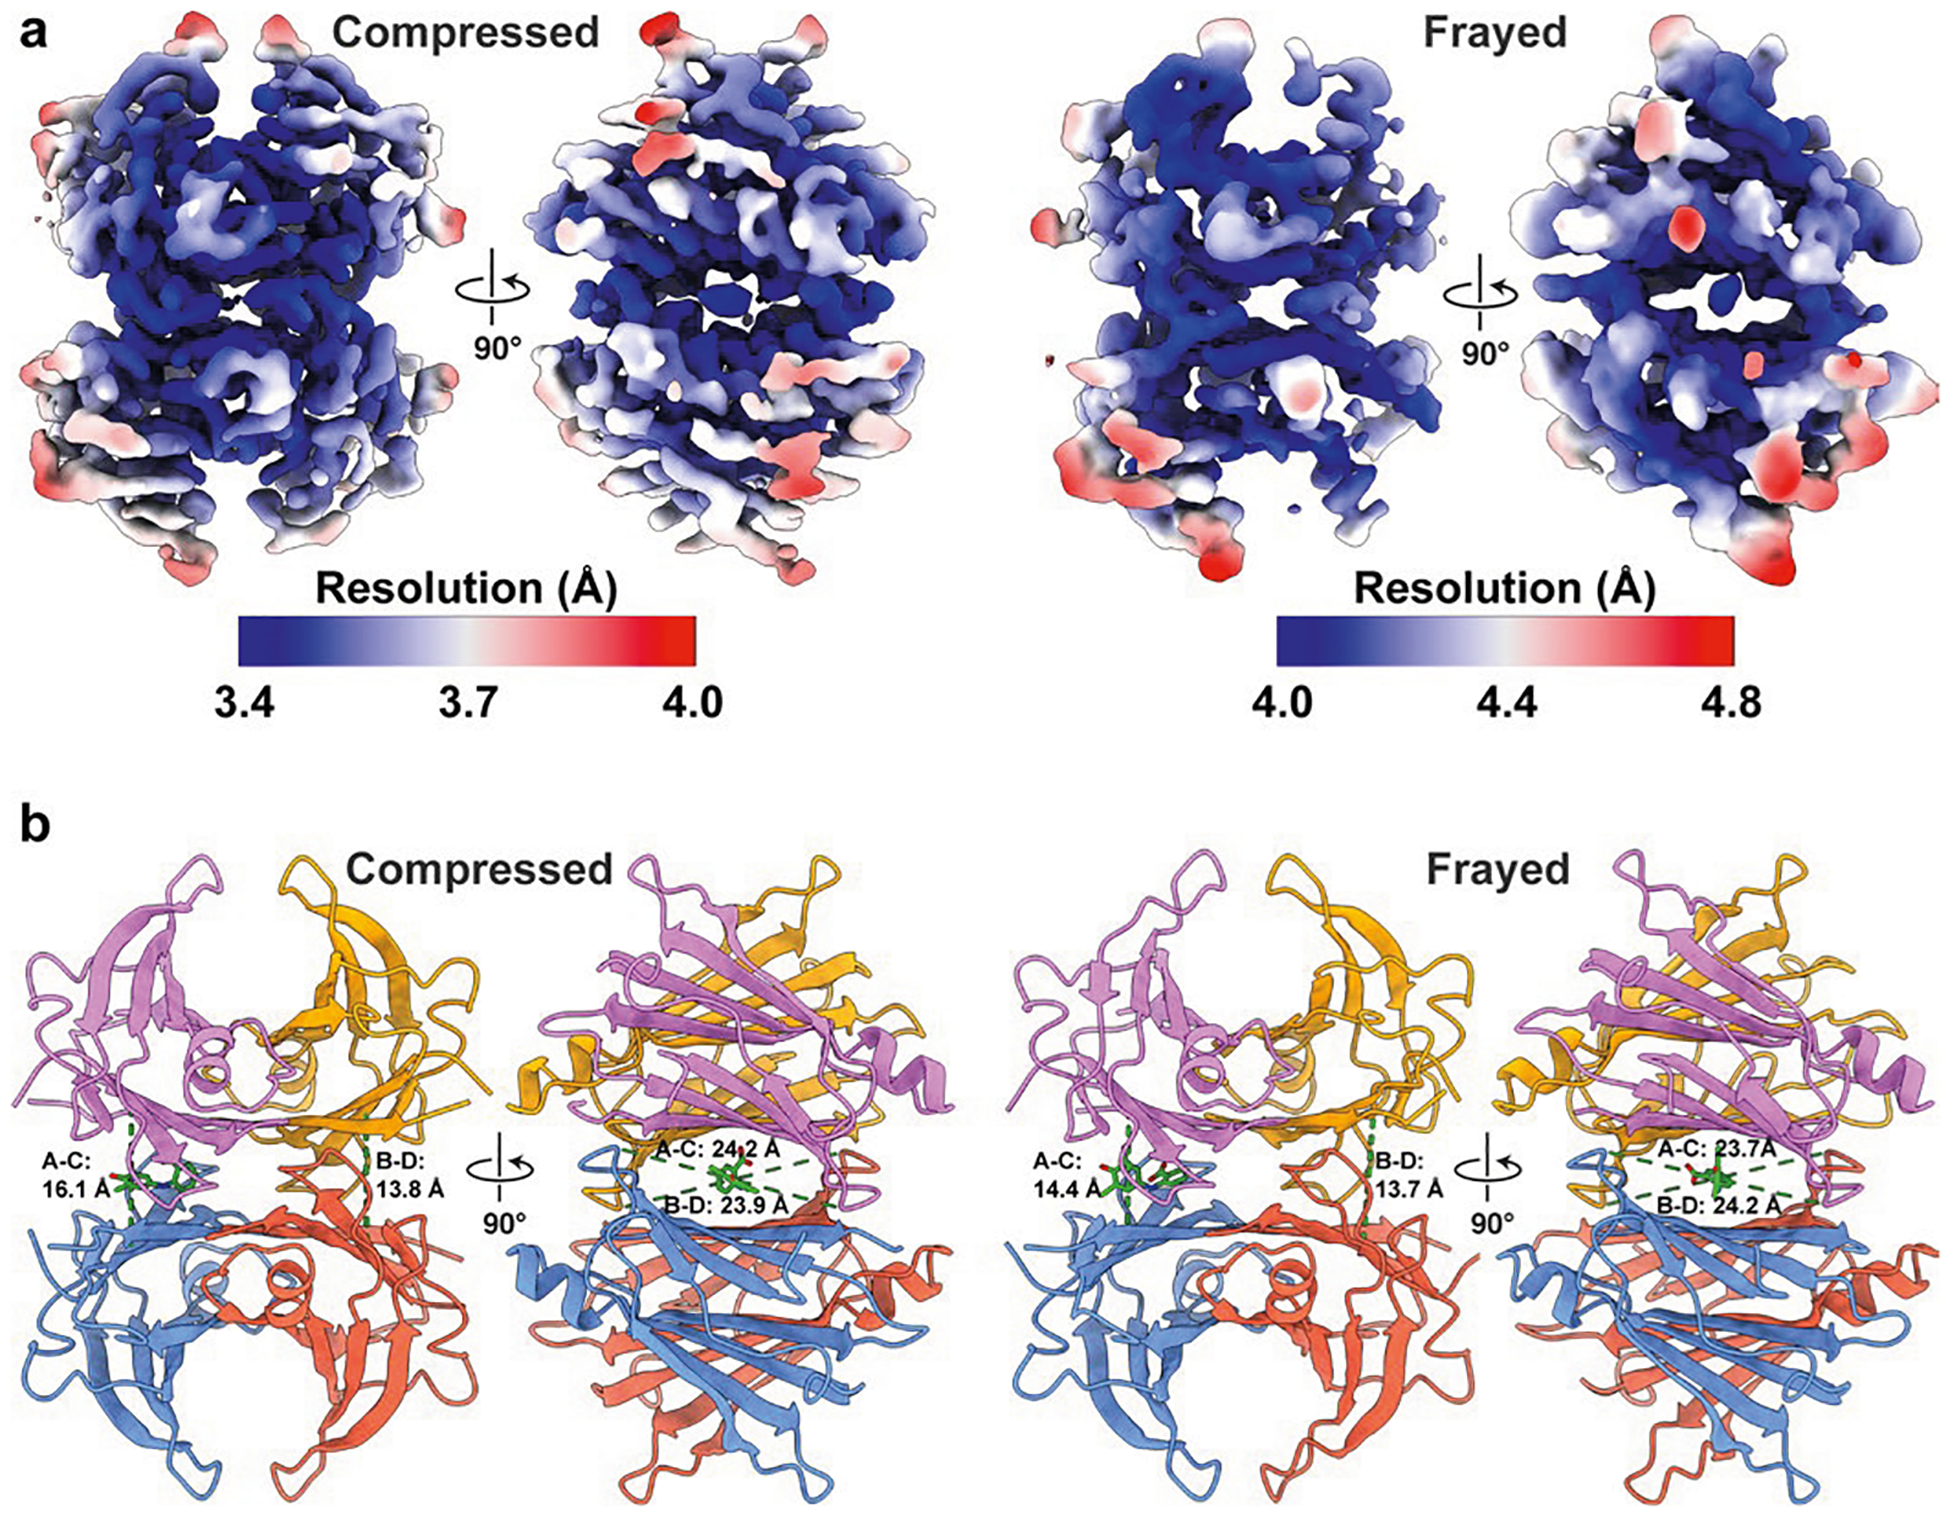
Transthyretin (TTR) is a natively tetrameric thyroxine transporter in blood and cerebrospinal fluid whose misfolding and aggregation causes TTR amyloidosis. A rational drug design campaign identified the small molecule tafamidis (Vyndamax) as a stabilizer of the native TTR fold, and this aggregation inhibitor is regulatory agency approved for the treatment of TTR amyloidosis. Here we used cryo-EM to investigate the conformational landscape of this 55 kDa tetramer in the absence and presence of one or two ligands, revealing inherent asymmetries in the tetrameric architecture and previously unobserved conformational states. These findings provide critical mechanistic insights into negatively cooperative ligand binding and the structural pathways responsible for TTR amyloidogenesis, underscoring the capacity of cryo-EM to identify pharmacological targets suppressed by the confines of the crystal lattice, opening uncharted territory in structure-based drug design.


Conflict of interest statement

Competing interests: J.W.K. and E.T.P. discovered tafamidis and receive royalty payments for its sales. J.W.K. was a founder and shareholder in FoldRx, which first developed tafamidis as a therapeutic. J.W.K. is a paid consultant for and has received support for travel and accommodations from Pfizer, which sells tafamidis. The other authors declare no competing interests.

Figures

Extended Data Fig. 1 |
Extended Data Fig. 1 |. TTR quaternary structure, presented using a TTR crystal structure bound to thyroxine (PDB 1ICT).
a, TTR dimers, shown using molecular surface and ribbon representations, interact through an extensive hydrogen bond network between neighboring H- and F- β-strands from neighboring subunits. The inter-strand interactions are highlighted in the right panels, where the A-B dimer is viewed perpendicular to the H- and F- β-strands, and the hydrogen bond network is depicted with the atomic model overlaid with the ribbon representation. b, Two TTR dimers assemble into a tetramer via interactions between the A-B and G-H loops from opposing subunits. On the left the TTR tetramer is shown as a molecular surface and ribbon representation. Thyroxine (colored green) is bound in each of the two binding pockets. On the right, a detailed view of the A-B loop interactions with the G-H loop of the opposing subunit is shown. For all images, each chain is colored as in Fig. 1.
Extended Data Fig. 2 |
Extended Data Fig. 2 |. Comparison of H-strand cross angles for our cryo-EM structures and published crystal structures of unliganded and covalently liganded TTR.
a, The dihedral angles between opposing H β-strands, measured as shown in Fig. 1E, are plotted as a line with dihedral angle value of the A / C subunits as the upper point and the B / D subunit dihedral angle as the lower point. The PDB codes for previously characterized unliganded complexes are labeled in the figure inset. The majority of the crystal structures have values that are similar to the cryo-EM structure we refer to as the canonical state. b, The same measurement of dihedral angles for our (Stilbene)2-TTR cryo-EM structures and published covalently liganded TTR crystal structures are plotted as in (a). The PDB codes for previously characterized complexes are labeled in the figure inset.
Extended Data Fig. 3 |
Extended Data Fig. 3 |. Local resolution and B-factors for the unliganded TTR conformations.
a, Reconstructions of the three unliganded TTR conformations are colored according to the estimated local resolution, as calculated by RELION. b, Models for the unliganded TTR states shown as backbone “tube” cartoons, colored by B-factor using the same scale. Chains B in all structures have the highest B-factors in the structures, and these values are substantially higher in the frayed state. c, B-factors are presented for residue numbers in areas that appear most disordered in the frayed state. B-factors for the same residues in the compressed state are presented for comparison.
Extended Data Fig. 4 |
Extended Data Fig. 4 |. Location of common hATTR mutations (V30M and L55P) in the context of the unliganded TTR model based on the frayed state density.
The backbone-only cartoon model (left) is colored by B-factor values, and an inset to the right highlights hATTR mutation sites V30 and L55 as sticks. The V30P mutation results in a larger residue in the core of TTR, near the frayed region. The L55P mutation abolishes a hydrogen bond (dashed lines in the inset) between position 55 and 14, which weakens the association of strand D and adjacent loops with the rest of the structure.
Extended Data Fig. 5 |
Extended Data Fig. 5 |. Differences in pocket geometry between canonical and compressed conformations of unliganded TTR.
Ribbon representation of the unliganded TTR conformations, with subunits colored as in Fig. 1 and pairwise distances between Cα shown as dotted green lines. On the left, distances between Cα atoms of Val20 between the subunits A-D and B-C are shown at the center, and measured distances between the Cα atoms of Ala108 are shown at the periphery. On the right the distances between the between the Cα atoms of Ala19, oriented horizontally across the binding pockets, are shown.
Extended Data Fig. 6 |
Extended Data Fig. 6 |. Stilbene conjugation site in the binding pocket formed by the A and C subunits determined by crystallography and cryo-EM.
The top panels show electron density below noise level from a 1.5 Å resolution crystal structure. The stilbene moiety seats at a crystallographic symmetry axis, resulting in two-fold averaging of the density. The bottom panels show the same region in our cryo-EM canonical state reconstruction, which was generated without imposing symmetry, showing the asymmetric binding pose of the ligand.
Extended Data Fig. 7 |
Extended Data Fig. 7 |. Local resolution and differences in pocket dimensions between canonical and compressed conformations of the (Stilbene)2-TTR conjugate.
a, Reconstructions of the canonical and compressed double-liganded TTR conformations are colored according to the estimated local resolution, as calculated by RELION. b, Ribbon representation of the double-liganded TTR conformations, with subunits colored as in Fig. 1 and pairwise distances between Cα shown as dotted green lines. On the left the distances between the Cα atoms of Ala108, which are oriented vertically across the binding pockets, are measured and shown. On the right the distances between the between the Cα atoms of Ala19, oriented horizontally across the binding pockets, are shown.
Extended Data Fig. 8 |
Extended Data Fig. 8 |. Local resolution and differences in pocket geometry between occupied and unoccupied binding sites in the (biarylamine-FT2-WT)1(C10A)3 TTR structures.
a, Reconstructions of the compressed and frayed single-liganded TTR colored according to the estimated local resolution, as calculated by RELION. b, Ribbon representation of the single-liganded compressed and frayed TTR conformations, with subunits colored as in Fig. 1, and pairwise distances between Cα shown as dotted green lines. On the left, measured distances between Cα atoms of Lys15 between the subunits A-C and B-D are shown. On the right the distances between the between the Cα atoms of Gly22, oriented horizontally across the binding pockets, are shown.
Extended Data Fig. 9 |
Extended Data Fig. 9 |. Fpocket analysis of TTR binding pockets.
A box and whisker plot is shown for each of the binding pockets for all of the conformational states of TTR reported in this study. Ten atomic models were generated for each cryo-EM reconstruction using Rosetta to model any missing side-chains, and Fpocket was used to measure the volume of each binding site (see Methods). The central line in the box plot is the median and the rectangles extend to the central quartiles. The whiskers extend to contain the rest of the data, except for points that are further than 1.5 times the inter-quartile range from the closest hinge, which are considered outliers (denoted by diamonds). The mean and standard deviation of each binding pocket for the conformational states are as follows (AC, BD pocket, respectively in Å3): unliganded canonical: 1997 + /− 36, 1880 + /− 69; unliganded compressed: 1935 + /− 59, 2061 + /− 59; unliganded frayed: 1945 + /− 91, 2080 + /− 85; single-bound compressed: 1883 + /− 22, 1582 + /− 170; single-bound frayed: 1827 + /− 139, 1691 + /− 84; double-bound canonical: 1384 + /− 79, 1723 + /− 21; double-bound compressed: 1681 + /− 311, 1815 + /− 91.
Extended Data Fig. 10 |
Extended Data Fig. 10 |. Conformational changes around Phe64 between the canonical and compressed TTR conformations.
On the left, a transparent surface representation of the unliganded canonical (above) and compressed (below) conformations of TTR are shown with transparency over the the ribbon model. The surface corresponding to the D-E loop has been removed to highlight its location. On the right, the surface representation of TTR is colored according to hydrophobicity according to the Kyte-Doolittle scale, with brown representing hydrophobic surfaces and blue as hydrophilic. The D-E loop is shown as a ribbon with residues Phe64 and Leu58 shown as sticks, highlighting how these residues anchor the D-E loops to the rest of the structure by interacting with the hydrophobic core of each subunit. When TTR transitions from the canonical to compressed conformations, the hydrophobic pockets with which these residues interact become wider. We hypothesize this decreases the stability of the D-E loop interaction relative to the rest of the structure, enabling sampling of the frayed state.
Fig. 1 |
Fig. 1 |. Unliganded tetrameric TTR adopts multiple asymmetric conformations, as determined by cryo-EM.
a, A cartoon ribbon representation of TTR (PDB ID: 1ICT) is colored and labeled by protomer. Regions of the β-sheets that form the ligand binding sites (green ovals) are denoted with more saturated coloring. On the right is an orthogonal view where the individual strands of the A–B dimer are labeled. b, Cryo-EM reconstructions of the canonical, compressed and frayed states of tetrameric TTR (all resolved to ~3.3 Å resolution), colored by subunit. To emphasize the disordering of the B and D subunits in the frayed state, a twofold symmetrized semi-transparent TTR density is underlaid beneath the reconstruction. c, Ribbon representations of β-strands A, D, G and H, which comprise the binding pocket, are shown with transparent cryo-EM density to highlight the quality of the reconstruction in this region. The different dihedral angles between opposing H β-strand angles in the canonical and compressed states are denoted in black text, and the different pocket volumes corresponding to each ligand binding site are labeled in green text. d, Licorice representations of the peptide backbones of the canonical TTR conformation determined by cryo-EM (blue) fit to the closest matching crystallography-based atomic model identified in the PDB (ID: 4PVN, light brown). e, A licorice representation of the peptide backbones of the canonical (blue) and compressed (gold) TTR conformations determined by cryo-EM is superimposed to emphasize the compaction of the structure in the compressed state. f, A ribbon representation of the β-strands shown in c is superimposed to emphasize the differences in β-sheet architecture at the dimer–dimer interface.
Fig. 2 |
Fig. 2 |. Asymmetric binding pose of stilbene tethered to both TTR binding pockets.
a, Orthogonal views of the cryo-EM reconstructions of the canonical (above) and compressed (below) conformations of TTR, resolved to ~2.7 and ~3.0 Å resolution, respectively, colored by subunit as in Fig. 1. The center image is a cross-sectional view of the cryo-EM density showing the density corresponding to the covalently bound ligand (green). b, The cryo-EM density of each stilbene moiety in the binding pockets of the canonical state reconstruction is shown as a mesh with the atomic model shown as a stick model. The stilbene covalently attached to Lys15 of chain C in the A–C binding pocket (top) is better resolved as a single conformation than the stilbene in the B–D binding pocket (bottom). c, Ribbon representations of β-strands A, D, G and H along with the stick representation of the bound stilbene ligand as a green stick representation are shown with transparent cryo-EM density to highlight the quality of the reconstruction in this region. The different H β-strand dihedral angles in the canonical and compressed states are denoted. To the right, a cutaway view of the surface representation of the ligand binding pockets with the stilbene ligand as a green stick representation is shown, with the different pocket volumes denoted in green text. d, A ribbon representation of the β-strands shown in c is superimposed to emphasize the differences in β-sheet architecture at the dimer–dimer interface.
Fig. 3 |
Fig. 3 |. Asymmetric single-liganded TTR structures determined by cryo-EM.
a, Cryo-EM reconstructions of the (biarylamine-FT2-WT)1(C10A)3 TTR compressed state (determined to ~3.4 Å resolution), colored by subunit. On the right is a cross-sectional view of the cryo-EM density showing the density corresponding to the single bound ligand (green) in the A–C binding pocket, while the B–D binding pocket is empty. b, The cryo-EM density corresponding to the area denoted by the dashed box in a is shown as a mesh with the atomic model shown as a stick model. The pocket volume of each binding site is denoted in green text. c, A cryo-EM reconstruction of the (biarylamine-FT2-WT)1(C10A)3 TTR compressed frayed state (determined to ~4.1 Å resolution), colored by subunit. d, A cross-sectional view of the cryo-EM density showing the density corresponding to the single-bound ligand (green) in the A–C binding pocket, while the B–D binding pocket, which is associated with the less-ordered protomers, is empty.
Fig. 4 |
Fig. 4 |. A schematic outlining the conformational landscape of TTR and how it is influenced by ligand binding.
A cartoon representation of the TTR tetramer is colored by subunit as in other figures, with the ligand represented as a diamond. In the absence of ligand, the TTR tetramer adopts an equilibrium of conformational states described in this work, with some fraction of the tetramer having a propensity to dissociate into dimers, which could subsequently further dissociate and aggregate. A small-molecule ligand can bind one of the two available binding pockets in the TTR tetramer. This binding occurs without incurring a substantial entropic cost, as the ligand binds to the distinct binding pocket that more readily accommodates the interaction. This single ligand binding event is sufficient to increase the stability of the dimer–dimer interactions, lowering the propensity for dimer dissociation and aggregation. The next binding event by the same ligand will incur a much larger entropic cost, as the remaining binding pocket requires structural rearrangements to accommodate the ligand. Furthermore, stabilization of the dimer–dimer interfaces induces an ordering of the loops associated with the frayed state, which comes with an entropic cost.

Update of

Similar articles

Cited by

References

    1. Schmidt HH et al. Estimating the global prevalence of transthyretin familial amyloid polyneuropathy. Muscle Nerve 57, 829–837 (2018). - PMC - PubMed
    1. Obi CA, Mostertz WC, Griffin JM & Judge DP ATTR epidemiology, genetics, and prognostic factors. Methodist Debakey Cardiovasc J. 18, 17–26 (2022). - PMC - PubMed
    1. Giao T et al. Undiscovered roles for transthyretin: from a transporter protein to a new therapeutic target for Alzheimer’s disease. Int. J. Mol. Sci 21, 2075 (2020). - PMC - PubMed
    1. Si JB, Kim B & Kim JH Transthyretin misfolding, a fatal structural pathogenesis mechanism. Int. J. Mol. Sci 22, 4429 (2021). - PMC - PubMed
    1. Bulawa CE et al. Tafamidis, a potent and selective transthyretin kinetic stabilizer that inhibits the amyloid cascade. Proc. Natl Acad. Sci. USA 109, 9629–9634 (2012). - PMC - PubMed

LinkOut - more resources