Multicenter Study
. 2025 Jan 22;25(1):37.
doi: 10.1186/s12886-025-03862-x.

Clinical efficacy of 0.1% cyclosporine A in dry eye patients with inadequate responses to 0.05% cyclosporine A: a switching, prospective, open-label, multicenter study

Affiliations
Multicenter Study

Clinical efficacy of 0.1% cyclosporine A in dry eye patients with inadequate responses to 0.05% cyclosporine A: a switching, prospective, open-label, multicenter study

Sook Hyun Yoon et al. BMC Ophthalmol. .

Abstract

Purpose: To assess the clinical efficacy of 0.1% cyclosporine A (CsA) in dry eye patients who have shown inadequate responses to previous treatment with 0.05% CsA.

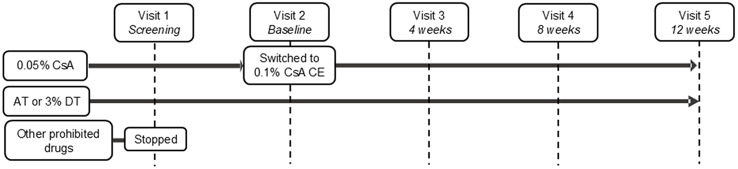
Design: This study was designed as a switching, prospective, multicenter, 12-week, open-label study.

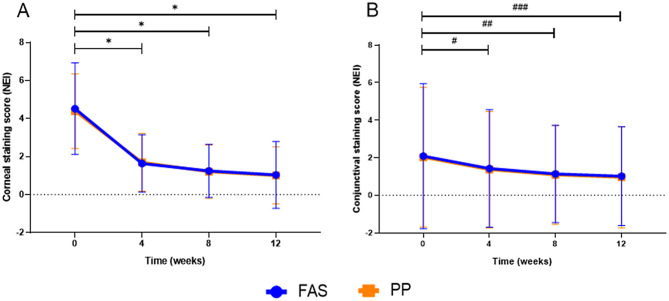
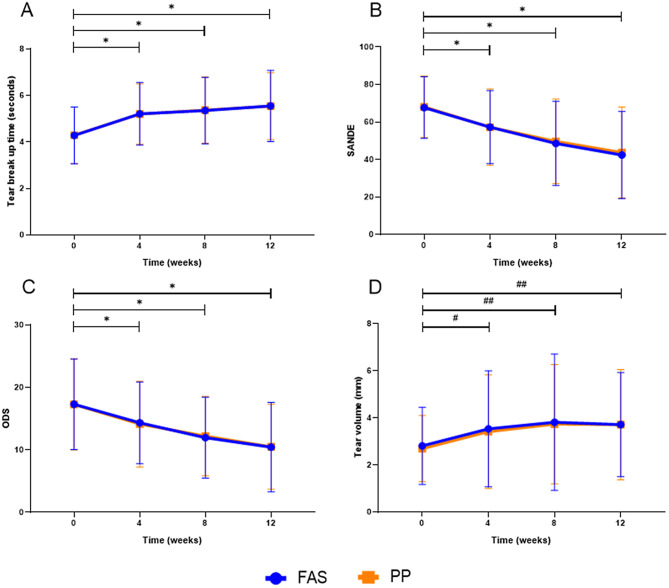
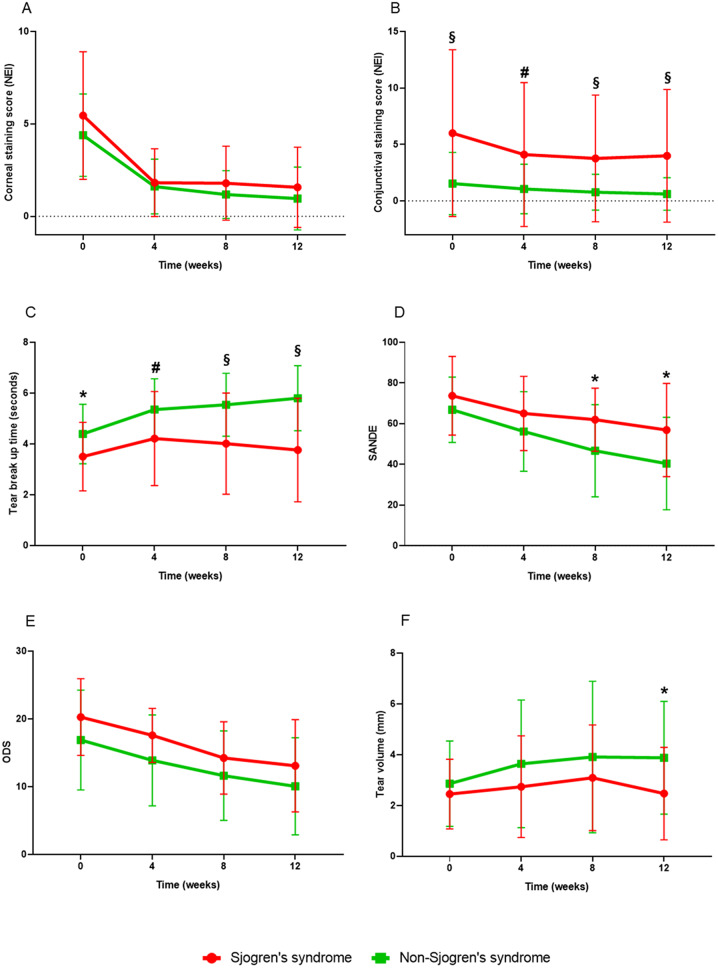
Methods: Patients with dry eye disease (DED), who experienced inadequate responses to at least 3 months of treatment with 0.05% cyclosporine, were enrolled in this study. Clinical evaluations included the National Eye Institute (NEI) corneal and conjunctival staining scores, tear film break-up time (TF-BUT), Symptom Assessment in Dry Eye (SANDE), ocular discomfort scale (ODS), and tear volume. These parameters were assessed at baseline, and again at 4, 8, and 12 weeks after switching to 0.1% CsA.

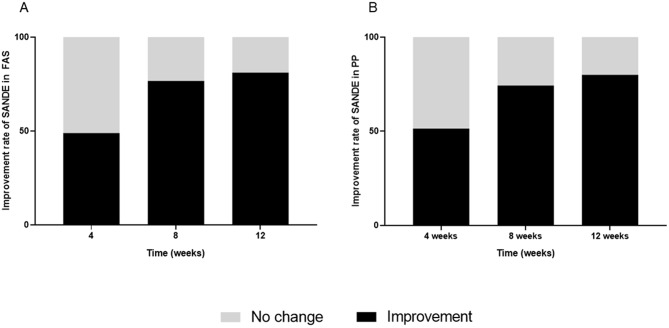
Results: Ninety-one patients were enrolled in the study, and 70 patients completed the trial. Statistical analysis was performed on the full analysis set (FAS) using the Markov Chain Monte Carlo (MCMC) method to account for missing data. After switching to 0.1% CsA, subjective symptoms assessed by the Symptom Assessment in Dry Eye (SANDE) and Ocular Discomfort Scale (ODS) showed improvement (p < 0.0001). Objective signs of dry eye, including the National Eye Institute (NEI) score, tear film break-up time (TF-BUT), and tear volume also improved (p < 0.0001).

Conclusions: In patients with dry eye disease (DED) who exhibited inadequate responses to 0.05% cyclosporine A (CsA), switching to 0.1% CsA resulted in significant improvements in both subjective symptoms and objective clinical signs. This finding suggests that higher concentrations of CsA may be more effective in treating individuals with moderate to severe DED.

Keywords: Cationic emulsion; Cyclosporine A; Dry eye disease; Multicenter study; Switching.


Conflict of interest statement

Declarations. Ethics approval and consent to participate: All patients who were enrolled provided written informed consent, and the study was conducted in accordance with the tenets of the Declaration of Helsinki with an approval from the Institutional Review Boards of the Yonsei University College of Medicine (4-2019-1156). Consent for publication: Not Applicable. Competing interests: The authors declare no competing interests.

Figures

Fig. 1
Fig. 1
Study design. CsA = cyclosporine A, AT = Artificial tears, DT = Diquafosol tetrasodium, CE = Cationic emulsion
Fig. 2
Fig. 2
Patient flow during this study. CsA = cyclosporine A, NEI = The National Eye Institute, SANDE = Symptom Assessment in Dry Eye
Fig. 3
Fig. 3
Changes in the corneal and conjunctival staining score over 12 weeks after switching to 0.1% from 0.05% cyclosporine A in FAS and PP. A. Corneal staining score: All corneal staining score differences compared to baseline at each visit showed significant improvement (all p < 0.0001). The change by time showed significance (both p < 0.0001). B. Conjunctival staining score: All conjunctival staining score differences compared to baseline at each visit showed significant improvement (all p < 0.05). The change by time showed significance (both p < 0.0001). NEI = The National Eye Institute, FAS = full analysis set, PP = per protocol set. *: p < 0.0001. #: p < 0.05, ##: p < 0.01, ###: p < 0.001
Fig. 4
Fig. 4
Changes in the tear film break-up time, SANDE, ODS, and tear volume over 12 weeks after switching to 0.1% from 0.05% cyclosporine A in FAS and PP. A. Tear Film Break-up time (TF-BUT): All TF-BUT differences compared to baseline at each visit showed significant improvement (all p < 0.0001). The change by time showed significance (both p < 0.0001). B. SANDE (symptom assessment in dry eye): All SANDE differences compared to baseline at each visit showed significant improvement (all p < 0.0001). The change by time showed significance (both p < 0.0001). C. ODS (ocular discomfort scale): All ODS differences compared to baseline at each visit showed significant improvement (all p < 0.0001). The change by time showed significance (both p < 0.0001). D. Tear volume: All tear volume differences compared to baseline at each visit showed significant improvement (all p < 0.05). The change by time showed significance (both p < 0.0001). FAS: full analysis set, PP: per protocol set. *: p < 0.0001. #: p < 0.05, ##: p < 0.01
Fig. 5
Fig. 5
The improvement rate of SANDE between each visit with baseline in FAS and PP. A. Improvement rate of SANDE in FAS: The change by time showed significance (p < 0.0001). B. Improvement rate of SANDE in PP: The change by time showed significance (p < 0.0001). SANDE = symptom assessment in dry eye. FAS: full analysis set, PP: per protocol set
Fig. 6
Fig. 6
Subgroup analysis between Sjogren’s syndrome and non-Sjogren’s syndrome in FAS. A. Corneal staining score: Change pattern by time was no significant difference between two group (p = 0.60). Change by time was significant (p < 0.0001). B. Conjunctival staining score: Change pattern by time was no significant difference between two group (p = 0.60). Change by time was significant (p < 0.0001). There were significant differences between two groups at baseline, 4, 8, 12 weeks. C. Tear Film Break-up time (TF-BUT): Change pattern by time was no significant difference between two group (p = 0.08). Change by time was significant (p < 0.0001). There were significant differences between two groups at baseline, 4, 8, 12 weeks. D. SANDE (symptom assessment in dry eye): Change pattern by time was no significant difference between two group (p = 0.08). Change by time was significant (p < 0.0001). There were significant differences between two groups at 8, 12 weeks. E. ODS (ocular discomfort scale): Change pattern by time was no significant difference between two group (p = 0.91). Change by time was significant (p < 0.0001). F. Tear volume: Change pattern by time was no significant difference between two group (p = 0.91). Change by time was significant (p < 0.0001). There were significant differences between two groups at 12 weeks. FAS: full analysis set. *: p < 0.05, #: p < 0.01, §: p < 0.001
Fig. 7
Fig. 7
Subgroup analysis between Sjogren’s syndrome and non-Sjogren’s syndrome in PP. A. Corneal staining score: Change pattern by time was no significant difference between two group (p = 0.52). Change by time was significant (p < 0.0001). B. Conjunctival staining score: Change pattern by time was no significant difference between two group (p = 0.18). Change by time had no significance (p = 0.06). There were significant differences between two groups at baseline, 4, 8, 12 weeks. C. Tear Film Break-up time (TF-BUT): Change pattern by time was no significant difference between two group (p = 0.06). Change by time was significant (p < 0.0001). There were significant differences between two groups at baseline, 4, 8, 12 weeks. D. SANDE (symptom assessment in dry eye): Change pattern by time was no significant difference between two group (p = 0.14). Change by time was significant (p < 0.0001). There were significant differences between two groups at 8, 12 weeks. E. ODS (ocular discomfort scale): Change pattern by time was no significant difference between two group (p = 0.80). Change by time was significant (p < 0.0001). There were significant differences between two groups at 12 weeks. F. Tear volume: Change pattern by time was no significant difference between two group (p = 0.52). Change by time had no significance (p = 0.27). PP: per protocol set. *: p < 0.05, #: p < 0.01, §: p < 0.001

References

    1. Craig JP, Nichols KK, Akpek EK, et al. TFOS DEWS II definition and classification report. Ocul Surf. 2017;15(3):276–83. - PubMed
    1. Bron AJ, de Paiva CS, Chauhan SK, et al. TFOS DEWS II pathophysiology report. Ocul Surf. 2017;15(3):438–510. - PubMed
    1. Baudouin C. [A new approach for better comprehension of diseases of the ocular surface]. J Fr Ophtalmol. 2007;30(3):239–46. - PubMed
    1. Knop E, Knop N, Brewitt H. [Dry eye disease as a complex dysregulation of the functional anatomy of the ocular surface. New concepts for understanding dry eye disease]. Ophthalmologe. 2003;100(11):917–28. - PubMed
    1. De Paiva CS, Pangelinan SB, Chang E, et al. Essential role for c-Jun N-terminal kinase 2 in corneal epithelial response to desiccating stress. Arch Ophthalmol. 2009;127(12):1625–31. - PMC - PubMed

Publication types

LinkOut - more resources