Multi-pathway oxidative stress amplification via controllably targeted nanomaterials for photoimmunotherapy of tumors
- PMID: 39844145
- PMCID: PMC11753039
- DOI: 10.1186/s12951-025-03116-4
Multi-pathway oxidative stress amplification via controllably targeted nanomaterials for photoimmunotherapy of tumors
Abstract
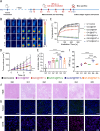
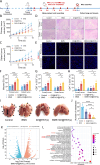
Photoimmunotherapy, which combines phototherapy with immunotherapy, exhibits significantly improved therapeutic effects compared with mono-treatment regimens. However, its use is associated with drawbacks, such as insufficient reactive oxygen species (ROS) production and uneven photosensitizer distribution. To address these issues, we developed a controllable, targeted nanosystem that enhances oxidative stress through multiple pathways, achieving synergistic photothermal, photodynamic, and immunotherapy effects for tumor treatment. These nanoparticles (D/I@HST NPs) accurately target overexpressed transferrin receptors (TfRs) on the surface of tumor cells through surface-modified transferrin (Tf). After endocytosis, D/I@HST NPs generate ROS under 808-nm laser irradiation, breaking the ROS-responsive crosslinking agent and increasing drug release and utilization. Tf also carries Fe3+, which is reduced to Fe2+ by iron reductase in the acidic tumor microenvironment (TME). Consequently, the endoperoxide bridge structure in dihydroartemisinin is cleaved, causing additional ROS generation. Furthermore, the released IR-780 exerts both photodynamic and photothermal effects, enhancing tumor cell death. This multi-pathway oxidative stress amplification and photothermal effect can trigger immunogenic cell death in tumors, promoting the release of relevant antigens and damage-associated molecular patterns, thereby increasing dendritic cell maturation and sensitivity of tumor cells to immunotherapy. Mature dendritic cells transmit signals to T cells, increasing T cells infiltration and activation, facilitating tumor growth inhibition and the suppression of lung metastasis. Furthermore, the myeloid-derived suppressor cells in the tumor decreases significantly after treatment. In summary, this multi-pathway oxidative stress-amplified targeted nanosystem effectively inhibits tumors, reverses the immunosuppressive tumor microenvironment, and provides new insights into tumor immunotherapy combined with phototherapy.
Keywords: Dihydroartemisinin; IR-780; Photoimmunotherapy; Reactive oxygen species; Transferrin.
© 2025. The Author(s).
Conflict of interest statement
Declarations. Ethical approval: All animal experiments were carried out in accordance with the guidelines of the Animal Care and Use Committee of the Binzhou Medical University and under the ethical approval for research involving animals of Binzhou Medical University (2020-33). Consent for publication: All authors approved the final manuscript and the submission to this journal. Competing interests: The authors declare no competing interests.
Figures


Similar articles
-
Hematoporphyrin-Modified Dendrimers Combined Immunoadjuvants for Enhanced Photoimmunotherapy of Colorectal Cancer.ACS Appl Mater Interfaces. 2025 Apr 30;17(17):25059-25070. doi: 10.1021/acsami.5c02413. Epub 2025 Apr 21. ACS Appl Mater Interfaces. 2025. PMID: 40257172
-
Carrier-Free Nanocombo-Sensitized Photoimmunotherapy via Activation of α2-Adrenergic Receptors.ACS Appl Mater Interfaces. 2025 Mar 19;17(11):16437-16452. doi: 10.1021/acsami.4c18052. Epub 2025 Mar 4. ACS Appl Mater Interfaces. 2025. PMID: 40040324 Free PMC article.
-
Self-Adaptive Photodynamic-to-Photothermal Switch for Smart Antitumor Photoimmunotherapy.ACS Nano. 2024 May 21;18(20):13019-13034. doi: 10.1021/acsnano.4c01600. Epub 2024 May 9. ACS Nano. 2024. PMID: 38723021
-
Phototherapy in cancer treatment: strategies and challenges.Signal Transduct Target Ther. 2025 Apr 2;10(1):115. doi: 10.1038/s41392-025-02140-y. Signal Transduct Target Ther. 2025. PMID: 40169560 Free PMC article. Review.
-
Light-based technologies in immunotherapy: advances, mechanisms and applications.Immunotherapy. 2025 Feb;17(2):123-131. doi: 10.1080/1750743X.2025.2470111. Epub 2025 Mar 3. Immunotherapy. 2025. PMID: 40032620 Free PMC article. Review.
Cited by
-
Tumor microenvironment and immune-related myositis: addressing muscle wasting in cancer immunotherapy.Front Immunol. 2025 May 2;16:1580108. doi: 10.3389/fimmu.2025.1580108. eCollection 2025. Front Immunol. 2025. PMID: 40386783 Free PMC article. Review.
-
Fighting Cancer with Photodynamic Therapy and Nanotechnologies: Current Challenges and Future Directions.Int J Mol Sci. 2025 Mar 25;26(7):2969. doi: 10.3390/ijms26072969. Int J Mol Sci. 2025. PMID: 40243613 Free PMC article. Review.
-
Versatile Nanomaterials That Interfere with Ferroptosis in the Tumor Microenvironment.Int J Nanomedicine. 2025 Feb 25;20:2461-2473. doi: 10.2147/IJN.S508767. eCollection 2025. Int J Nanomedicine. 2025. PMID: 40027870 Free PMC article. Review.
References
-
- Zhang XB, Xiong JC, Wang KY, Yu H, Sun BJ, Ye H, Zhao ZQ, Wang N, Wang YQ, Zhang SW, et al. Erythrocyte membrane-camouflaged carrier-free nanoassembly of FRET photosensitizer pairs with high therapeutic efficiency and high security for programmed cancer synergistic phototherapy. Bioactive Mater. 2021;6:2291–302. - PMC - PubMed
-
- Wang YG, Wang N, Du YY, Jiang X, Liu YH, Wang YP, Feng YQ, Wang P, Meng SX. Novel nanoparticles prepared from isothiocyanate derivatives for phototherapy of tumor. J Photochem Photobiology B-Biology. 2023;242:9. - PubMed
-
- Proshkina GM, Shramova EI, Deyev SM. Production of reactive oxygen species by genetically encoded Photosensitizers 4D5scFv-miniSOG and DARPin-miniSOG in living cells. Biol Membr. 2023;40:61–5.
-
- Vankayala R, Hwang KC. Near-Infrared-Light-Activatable nanomaterial-mediated phototheranostic nanomedicines: an emerging paradigm for Cancer Treatment. Adv Mater. 2018;30:27. - PubMed
MeSH terms
Substances
Grants and funding
LinkOut - more resources
Full Text Sources
Medical
Miscellaneous

