

Association between non-insulin-based insulin resistance indicators and frailty progression: a national cohort study and mendelian randomization analysis
- PMID: 39844267
- PMCID: PMC11756107
- DOI: 10.1186/s12933-025-02597-9
Association between non-insulin-based insulin resistance indicators and frailty progression: a national cohort study and mendelian randomization analysis
Abstract
Background: Insulin resistance (IR) is linked to an increased risk of frailty, yet it remains unclear whether the non-insulin-based IR indicators are associated with frailty trajectories and physical function decline. It aimed to examine the associations of triglyceride-glucose (TyG) index, metabolic score for insulin resistance (METS-IR), estimated glucose disposal rate (eGDR) and with long-term deficit-accumulation frailty trajectories and physical function decline.
Methods: Data from 6722 participants in the China Health and Retirement Longitudinal Study (CHARLS) were analyzed. Baseline TyG index, METS-IR, eGDR, along with the frailty index (FI) over nine years, were calculated. FI trajectories were assessed using group-based trajectory model (GBTM). Logistic regression models were used to analyze the associations between IR indicators with FI trajectory and frailty risk. Restricted cubic splines (RCS) models were utilized to detect potential dose-response associations. Linear mixed-effects model was used to evaluate associations with FI development speed. Age, gender, educational level, marital status, smoking status, drinking status, life satisfaction, social activity and sleep duration were adjusted. Additionally, a two-sample Mendelian randomization (MR) was performed to assess the causality of observed associations.
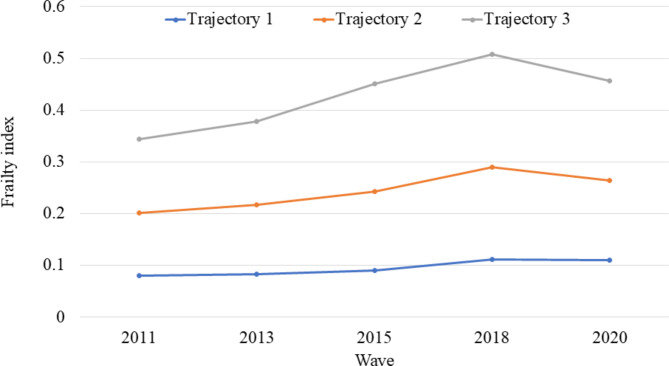
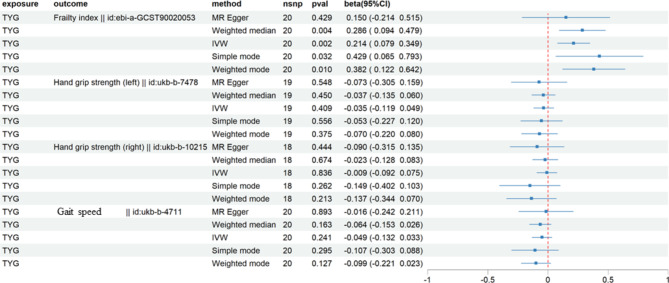
Results: Three FI trajectories including low-stable frailty, moderate-increasing frailty, and accelerated rising frailty were identified. Regarding the frail risk, each SD increment in TyG index was associated with a 16.1% increase in the risk of frailty (OR = 1.161; 95%CI: 1.092, 1.235). An inverse association was observed for eGDR with the OR (95%CI) being 0.741 (0.696, 0.788). A linear relationship was observed between baseline TyG index and frailty risk (P nonlinear = 0.696), but nonlinear association patterns for eGDR (P nonlinearity < 0.010) and METS-IR (P nonlinearity < 0.010). Each SD increment of TyG index was associated with greater FI increase (β = 0.005 SD/y; 95%CI = 0.002, 0.008 SD/y; P < 0.001). A similar association pattern was observed for METS-IR, and participants in the highest quartile of METS-IR showed significantly greater FI progression, with β value of 0.013 (95% CI = 0.004, 0.022). Each SD increment of eGDR was associated with a slower increase in FI (β=-0.006 SD/y, 95% CI=-0.009, -0.003 SD/y; P < 0.001). Participants in the highest quartile of eGDR presented a lower annual change in FI compared with participants in quartile 1 group during follow-up (β=-0.013 SD/y, 95% CI=-0.022, -0.005 SD/y; P for trend = 0.001). Similar findings were observed for physical function decline. Findings from MR analysis showed a causal relationship between higher TyG index and increased risk of frailty (β = 0.214, 95% CI = 0.079, 0.349; P = 0.002).
Conclusions: The non-insulin-based IR indicators, including TyG index, METS-IR and eGDR, were independently associated with the frailty progression and physical function decline. Monitoring and managing abnormal glucose metabolism should be recommended as a part of comprehensive strategies to prevent or delay the progression of frailty.
Keywords: Estimated glucose disposal rate; Frailty Trajectory; Metabolic score for insulin resistance; Triglyceride-glucose index.
© 2025. The Author(s).
Conflict of interest statement
Declarations. Ethics approval and consent to participate: The Ethics Committee of Peking University approved the CHARLS (IRB00001052-11015). All participants provided informed consent at the baseline assessment. Consent for publication: Not applicable. Competing interests: The authors declare no competing interests.
Figures


References
-
- Fried LP, Tangen CM, Walston J, Newman AB, Hirsch C, Gottdiener J, et al. Frailty in older adults: evidence for a phenotype. J Gerontol Biol Sci Med Sci. 2001;56(3):M146–56. - PubMed
-
- Zhang L, Fu S, Fang Y. Prediction of the number of and care costs for disabled elderly from 2020 to 2050: a comparison between urban and rural areas in China. Sustainability. 2020;12:2598.
MeSH terms
Substances
Grants and funding
LinkOut - more resources
Full Text Sources
Medical
