. 2025 Jan 22;20(1):9.
doi: 10.1186/s13024-024-00793-x.

APOE Christchurch enhances a disease-associated microglial response to plaque but suppresses response to tau pathology

Affiliations

APOE Christchurch enhances a disease-associated microglial response to plaque but suppresses response to tau pathology

Kristine M Tran et al. Mol Neurodegener. .

Abstract

Background: Apolipoprotein E ε4 (APOE4) is the strongest genetic risk factor for late-onset Alzheimer's disease (LOAD). A recent case report identified a rare variant in APOE, APOE3-R136S (Christchurch), proposed to confer resistance to autosomal dominant Alzheimer's Disease (AD). However, it remains unclear whether and how this variant exerts its protective effects.

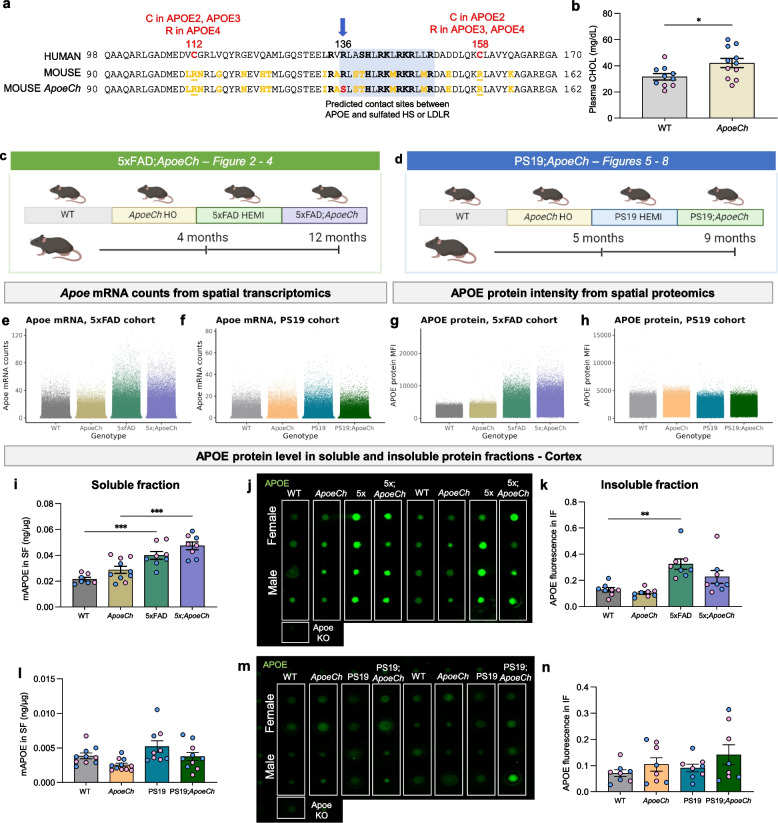
Methods: We introduced the R136S variant into mouse Apoe (ApoeCh) and investigated its effect on the development of AD-related pathology using the 5xFAD model of amyloidosis and the PS19 model of tauopathy. We used immunohistochemical and biochemical analysis along with single-cell spatial omics and bulk proteomics to explore the impact of the ApoeCh variant on AD pathological development and the brain's response to plaques and tau.

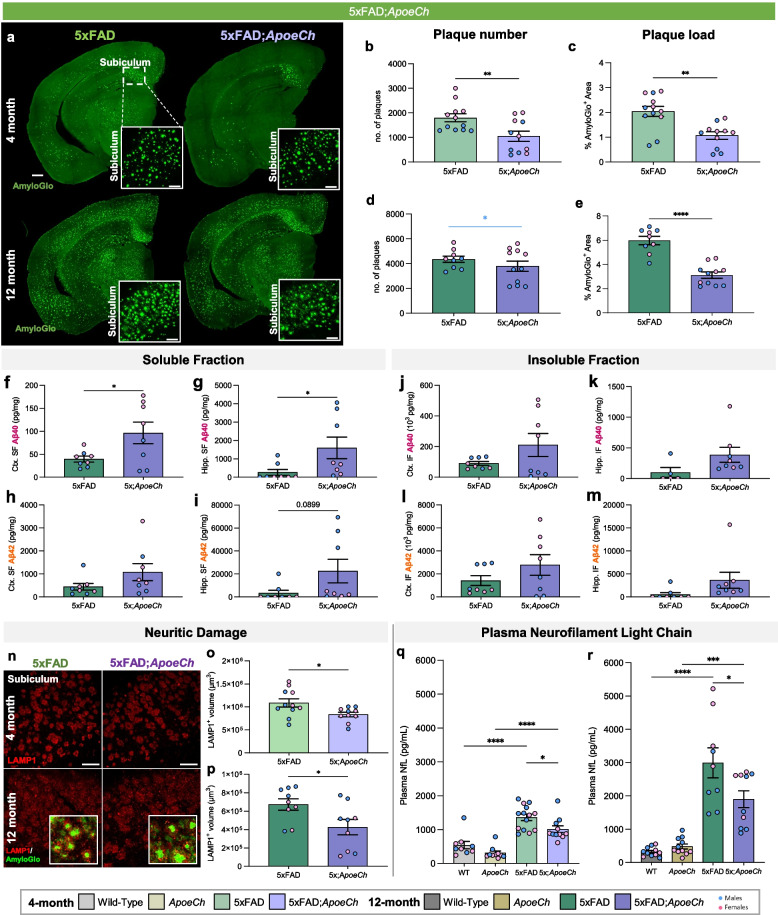
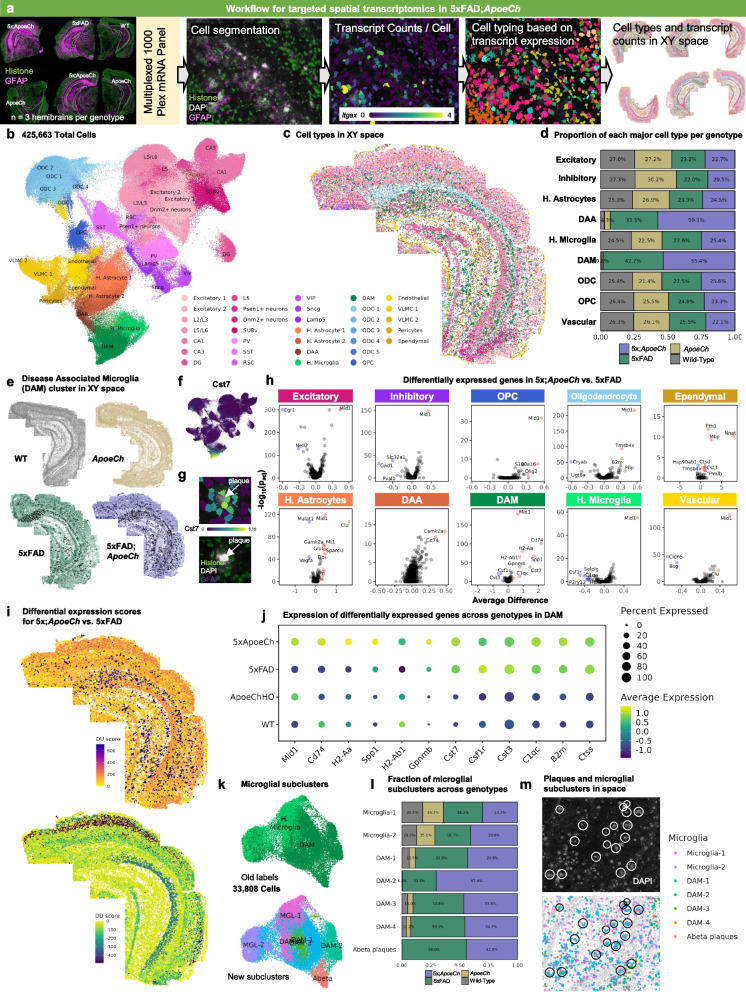
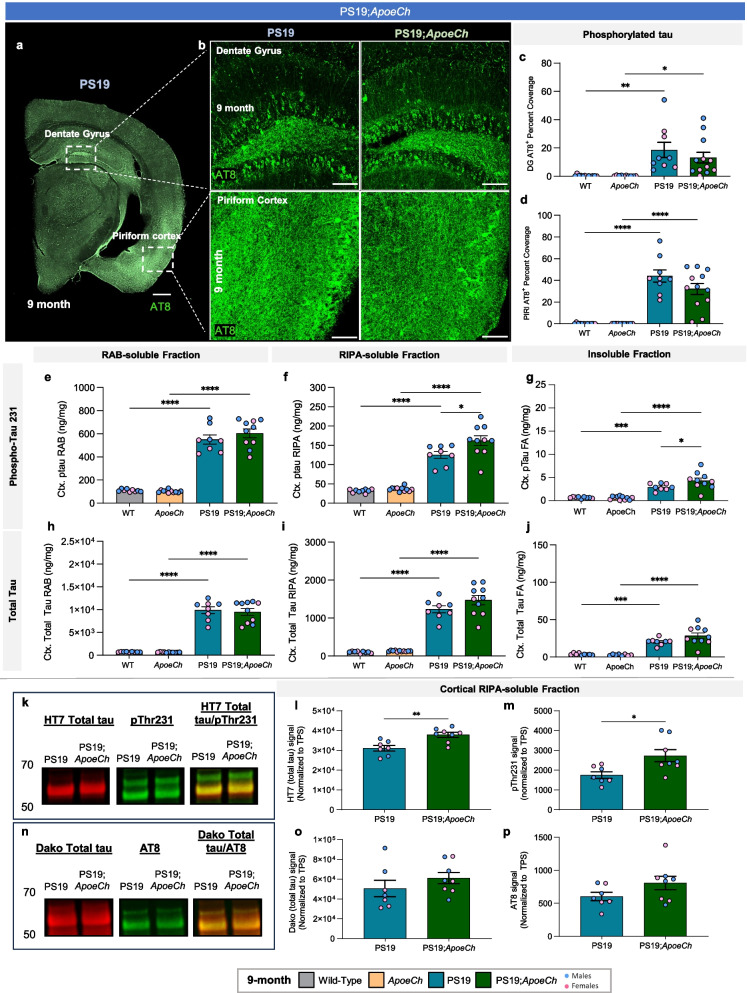
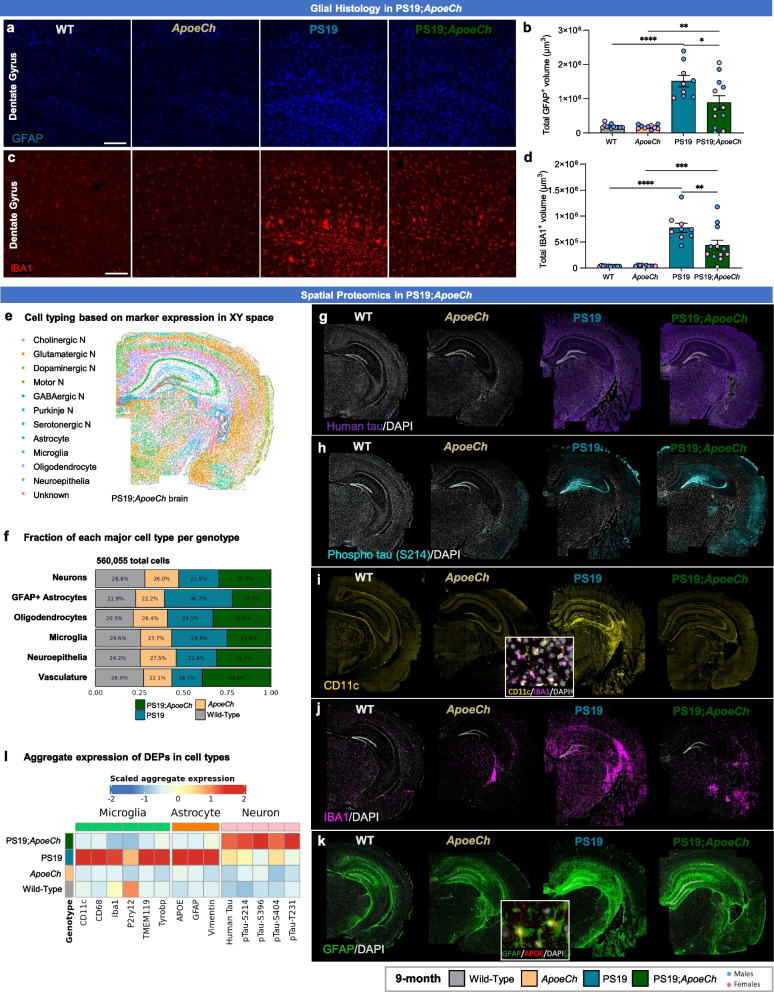
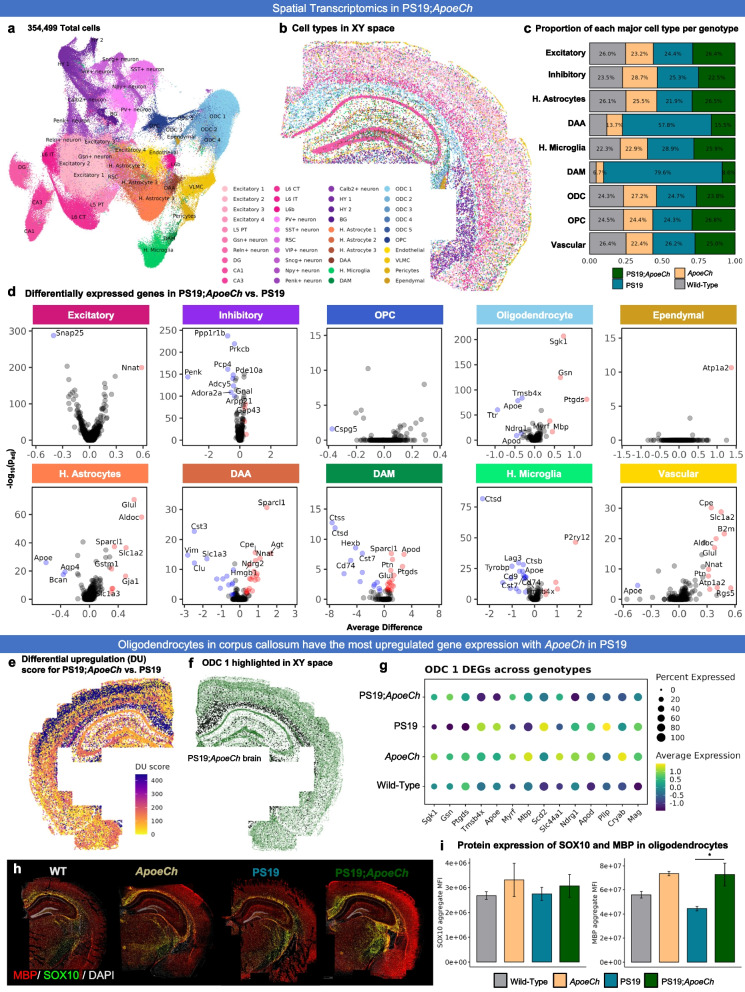
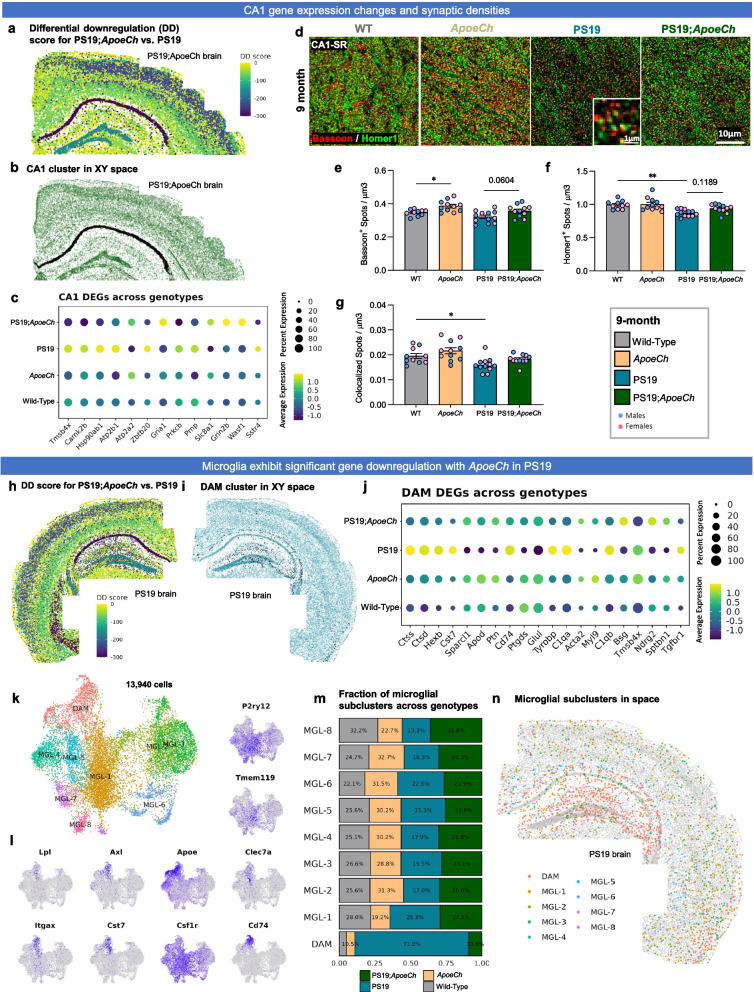
Results: In 5xFAD mice, ApoeCh enhances a Disease-Associated Microglia (DAM) phenotype in microglia surrounding plaques, and reduces plaque load, dystrophic neurites, and plasma neurofilament light chain. By contrast, in PS19 mice, ApoeCh suppresses the microglial and astrocytic responses to tau-laden neurons and does not reduce tau accumulation or phosphorylation, but partially rescues tau-induced synaptic and myelin loss. We compared how microglia responses differ between the two mouse models to elucidate the distinct DAM signatures induced by ApoeCh. We identified upregulation of antigen presentation-related genes in the DAM response in a PS19 compared to a 5xFAD background, suggesting a differential response to amyloid versus tau pathology that is modulated by the presence of ApoeCh. Bulk proteomics show upregulated mitochondrial protein abundance with ApoeCh in 5xFAD mice, but reductions in mitochondrial and translation associated proteins in PS19 mice.

Conclusions: These findings highlight the ability of the ApoeCh variant to modulate microglial responses based on the type of pathology, enhancing DAM reactivity in amyloid models and dampening neuroinflammation to promote protection in tau models. This suggests that the Christchurch variant's protective effects likely involve multiple mechanisms, including changes in receptor binding and microglial programming.

Keywords: 5xFAD; APOE Christchurch; Amyloid; DAM; Microglia; PS19; Resilience; Tau.


Conflict of interest statement

Declarations. Ethics approval and consent to participate: All experiments involving mice were approved by the UC Irvine Institutional Animal Care and Use Committee and were conducted in compliance with all relevant ethical regulations for animal testing and research. All experiments involving mice comply with the Animal Research: Reporting of in Vivo Experiments (ARRIVE-10) guidelines. Consent for publication: Not applicable. Competing interests: KNG is a member of the advisory board of Ashvattha Therapeutics. DMD and NTS are co-founders of ARCProteomics.

Figures

Fig. 1
Fig. 1
Generation of ApoeCh mouse model. a Partial amino acid (AA) sequence alignment between human and mouse APOE. The vertical blue arrow denotes the location of the R136S Christchurch variant (rs121918393), shown in red in the mouse ApoeCh sequence. Mouse has human APOE4 type sequence at positions 112 and 158 (underlined). AA differences between mouse and human APOE4 in this region are highlighted in yellow. In panels b, i, k, l and n, sex of individual animals are denoted by pink (female) or blue (male) circles. b Plasma cholesterol in 4 mo WT and ApoeCh HO mice (p = 0.0274). c, d Schematic showing mouse groups and study design of 5xFAD;ApoeCh (c) and PS19;ApoeCh (d) cohorts. e–f Apoe mRNA counts from single-cell spatial transcriptomics in the 5xFAD (e) and PS19 (f) cohorts. Each point represents one cell. g-h APOE protein mean fluorescence intensity (MFI) from single-cell spatial proteomics in the 5xFAD (g) and PS19 (h) cohorts. Each point represents one cell. i,l Quantification of APOE in soluble protein fraction from 5xFAD (i) and PS19 cohort animals (l) measured via ELISA, normalized to total protein concentration. j,m Dot blot analysis of APOE protein in insoluble protein fraction of 5xFAD (j) and PS19 (m) cohort. k,n Quantification of APOE protein in insoluble fraction 5xFAD (k) and PS19 (n) cohort normalized to sample brain weight. n = 2–3 mice/genotype for spatial proteomics. n = 3–6 mice/sex/genotype for cortical protein fractions. Data are represented as mean ± SEM. Two-way ANOVA followed by Tukey’s post hoc tests to examine biologically relevant interactions. Statistical significance is denoted by *p < 0.05, **p < 0.01, ***p < 0.001, ****p < 0.0001
Fig. 2
Fig. 2
ApoeCh variant ameliorates Aβ plaque burden and plaque-induced damage in 5xFAD mice. a Representative hemispheric coronal brain images of 4-mo-old (top) and 12-mo-old (bottom) 5xFAD and 5xFAD;ApoeCh stained for dense-core plaques using AmyloGlo (green) Scale bar = 500 µm. Insets of 20 × magnification images of the subiculum. Scale bar = 100 µm. b-e Quantification of AmyloGlo+ plaques (4 month—b; 12 month—d) and percent AmyloGlo+ area coverage (4 month—c; 12 month—e) of 5xFAD and 5xFAD;ApoeCh mice. Blue bar denotes statistical significance only in males. f-m Quantification of soluble (f-i) and insoluble (j-m) Aβ in micro-dissected cortices (f, h, j, l) and hippocampi (g, i, k, m) of 12 month-old 5xFAD and 5xFAD;ApoeCh mice. n Representative confocal images of subiculum in 4-mo-old (top) and 12-mon-old (bottom) wild-type, ApoeCh, 5xFAD, and 5xFAD;ApoeCh mice immunolabeled for LAMP1 (red) for dystrophic neurites quantified in o and p. Insets show higher magnification images with LAMP1 (red) and AmyloGlo for dense-core plaques (green). Scale bar = 100 µm. Student’s t-test. q-r Measurement of plasma NfL in WT, ApoeCh, 5xFAD, and 5xFAD;ApoeCh mice at 4- (q) and 12-mo (r). n = 4–6 mice/sex/genotype. In panels with graphs, sex of individual animals is denoted by pink (female) or blue (male) circles. Data are represented as mean ± SEM. Two-way ANOVA followed by Tukey’s post hoc tests to examine biologically relevant interactions. Statistical significance is denoted by *p < 0.05, **p < 0.01, ***p < 0.001, ****p < 0.0001
Fig. 3
Fig. 3
ApoeCh increases disease-associated microglia number in response to plaques. a Representative confocal images of the subiculum stained for dense-core plaques with AmyloGlo (green) and immunolabeled for GFAP (red, a) and IBA1 (red, c) of 12-mo-old WT, ApoeCh, 5xFAD, and 5xFAD;ApoeCh mice. Scale bar = 100 µm. b, d Quantification of total volume of GFAP+ cells (b) and IBA1+ cells (d). Sex of individual animals is denoted by pink (female) or blue (male) circles. n = 4–6 mice/sex/genotype. Data are represented as mean ± SEM. Two-way ANOVA followed by Tukey’s post hoc tests to examine biologically relevant interactions. Statistical significance is denoted by *p < 0.05, **p < 0.01, ***p < 0.001, ****p < 0.0001.e Workflow for targeted 67-plex single-cell spatial proteomics. Fields-of-view (FOVs) are first imaged with GFAP, NEUN, RPS6, and IBA1 markers for cell segmentation. Protein abundance is determined by counting the number of fluorescently-labelled oligos in each cell. Cell types are identified with the CELESTA algorithm, which classifies cells based on marker protein expression. f Cell types in XY space. CELESTA classifies cells into 12 different cell types, which can then be plotted in space to confirm accurate identification. Non-DAM microglia are unable to be identified using CD11b as a marker; only DAM are shown. g Proportions of 5xFAD;ApoeCh, 5xFAD, ApoeCh, and WT cells for each major cell type. h Aggregate expression of the top differentially expressed proteins in DAMs and astrocytes across the four genotypes. i-l Immunofluorescence images of MHCII, CD11c, CD68, and APOE for representative brains of WT, ApoeCh, 5xFAD, and 5xFAD;ApoeCh mice
Fig. 4
Fig. 4
ApoeCh enhances microglial response to plaques confirmed by spatial transcriptomics. a Workflow for targeted 1000-plex single-cell spatial transcriptomics. FOVs were selected in hippocampus and cortex of each section, then imaged with DNA, rRNA, Histone, and GFAP markers for cell segmentation. Transcript counts for each gene were acquired per cell. b UMAP of 425,663 cells across 12 hemibrains (n = 3/genotype). Clustering at 1.0 resolution yielded 33 clusters, which were annotated manually based on gene expression and anatomical location in space. c 33 clusters plotted in XY space. d Proportion of the number of cells in each major cell type, grouped by genotype. Percentages normalized for the total number of cells in each genotype. e DAM cluster (black dots) plotted in XY space for each genotype. f Feature plot of Cst7 expression in UMAP space. g (top) Cst7-expressing cells (i.e., DAMs) surrounding an amyloid-beta plaque. (bottom) DAPI (grey) highlights the same plaque from top panel. Histone marker (green) highlights nucleosomes in cells surrounding the plaque. GFAP + (purple) cell processes surround the plaque. h Volcano plots showing DEGs between 5xFAD;ApoeCh and 5xFAD among major cell types. i Differential upregulation (DU) and differential downregulation (DD) scores for 5xFAD;ApoeCh vs. 5xFAD in each cluster plotted in space in a 5xFAD;ApoeCh brain. j Pseudo-bulk expression of top DEGs between 5xFAD;ApoeCh and 5xFAD across genotypes. k-m Microglial subclustering analysis. k UMAP of 33,808 subsetted microglia. (top) UMAP annotated with old labels from b. (bottom) Cells were re-clustered at 0.2 resolution to yield 7 new subclusters. l Proportion of the number of cells in each microglial subcluster, grouped by genotype. m Microglial subclusters in XY space in a 5xFAD;ApoeCh brain. (top) Amyloid-beta dense core plaques, shown by the presence of DAPI + aggregates (grey), circled in white. (bottom) Microglial subclusters plotted in space. Plaques from top panel circled in black
Fig. 5
Fig. 5
ApoeCh has minimal impact on phosphorylated tau accumulation. a Representative 10 × image of hemispheric coronal brain image of a PS19 mouse immunolabeled for phosphorylated tau using AT8 (green) highlighting brain regions with high pathological manifestation, dentate gyrus (DG) and piriform cortex (PIRI). Scale bar = 500 µm b Representative 20 × confocal images of dentate gyrus (top) and piriform cortex (bottom) from 9-mo old PS19 and PS19;ApoeCh mice immunolabeled for AT8 (green). Scale bar = 100 µm. c-d Percentage of AT8+ area coverage per FOVs of 9 mo-old WT, ApoeCh, PS19, and PS19;ApoeCh mice in the DG (c) and PIRI (d). e-j Phosphorylated tau T231 (e-g) and total tau (h-j) measured via MSD in RAB, RIPA, and formic acid fraction of the micro-dissected cortices of 9-mo-old WT, ApoeCh, PS19, and PS19;ApoeCh mice. k Western blot images of HT7-detected total tau and pThr231 tau in cortical RIPA-soluble fraction of 9-mo PS19 and PS19;ApoeCh mice. lm HT7 (l) and pThr231 signal (m) normalized to total protein stain (LPS). n Western blot images of total tau detected with Dako antibody and p-tau by AT8 in cortical RIPA-soluble fraction of 9-mo PS19 and PS19;ApoeCh mice. op Dako (o) and AT8 (p) signal normalized to TPS. n = 3–6 mice/sex/genotype. In panels with graphs, sex of individual animals is denoted by pink (female) or blue (male) circles. Data are represented as mean ± SEM. Student’s t-test, unpaired. Two-way ANOVA followed by Tukey’s post hoc tests to examine biologically relevant interactions. Statistical significance is denoted by *p < 0.05, **p < 0.01, ***p < 0.001, ****p < 0.0001
Fig. 6
Fig. 6
Reduced microglial and astrocytic response to tau induced by ApoeCh. a, c Representative confocal images of immunostained dentate gyrus for GFAP (blue, a) and IBA1 (red, c) of 9-mo-old WT, ApoeCh, PS19, and PS19;ApoeCh mice. Scale bar = 100 µm. b,d Quantification of total volume of GFAP+ cells (b) and IBA1+ cells (d), n = 4–6 mice/sex/genotype. Sex of individual animals is denoted by pink (female) or blue (male) circles. Data are represented as mean ± SEM. Two-way ANOVA followed by Tukey’s post hoc tests to examine biologically relevant interactions. Statistical significance is denoted by *p < 0.05, **p < 0.01, ***p < 0.001, ****p < 0.0001. e Cell types plotted in XY space. f Proportion of the number of cells in each major cell type, grouped by genotype. g-k Immunofluorescence images for Human Tau, Phospho-Tau (S214), CD11c, IBA1, and GFAP in representative brains of WT, ApoeCh, PS19, and PS19;ApoeCh mice. l Aggregate expression of differentially expressed proteins (DEPs) in microglia, astrocytes, and neurons across the four genotypes. Expression is normalized for the number of brains in each genotype
Fig. 7
Fig. 7
ApoeCh prevents tau-induced myelin loss via changes in oligodendrocyte transcriptomics. a UMAP of 354,499 cells across 11 hemibrains (n = 3/genotype, except n = 2 for ApoeCh). Clustering at 1.0 resolution gave rise to 40 clusters, which were then manually annotated based on gene expression and anatomical location in space. b 40 clusters plotted in XY space. Common legend between a, b. c Proportion of the number of cells in each major cell type, grouped by genotype. Percentages were normalized for the total number of cells in each genotype (i.e., to account for differences in the number of samples per genotype). d Volcano plots of DEGs between PS19;ApoeCh and PS19 for each major cell type. e DU score for PS19;ApoeCh vs. PS19 in a PS19;ApoeCh brain. f ODC 1 cluster highlighted (black) in XY space in a PS19;ApoeCh brain. g Pseudo-bulk expression of the top DEGs between PS19;ApoeCh and PS19 in the ODC 1 cluster across all four genotypes. h Immunofluorescence images of MBP (red) and SOX10 (green) in representative brains from each genotype from spatial proteomics dataset. DAPI nuclear stain shown in light grey. i Bar plots showing mean fluorescent intensity of SOX10 and MBP in oligodendrocytes, aggregated per sample. Error bars indicate the standard error of the mean (SEM). Adjusted p-value for the comparison between PS19;ApoeCh and PS19 for MBP was obtained using two-way ANOVA followed by Tukey’s HSD post-hoc test to determine specific pairwise differences. * padj < 0.05
Fig. 8
Fig. 8
ApoeCh suppresses microglial response to tau and partially suppresses tau-induced synaptic loss in the PS19 mouse model. a DD score for PS19;ApoeCh vs. PS19 in a PS19;ApoeCh brain. b CA1 cluster highlighted (black) in XY space in a PS19;ApoeCh brain. c Pseudo-bulk expression of the top DEGs between PS19;ApoeCh and PS19 in the CA1 cluster across the four genotypes. d Representative super-resolution images of Bassoon and Homer1 synaptic markers for WT, ApoeCh, PS19, and PS19;ApoeCh mice at 9 mo of age. Scale bar = 10 μm. Insert scale bar = 1 µm e–g Quantification of Bassoon + spots per μm3, Homer1 + spots per µm3 and colocalized Bassoon + /Homer1 + synaptic spots per µm3 showing decreased synaptic puncta in PS19 mice compared to WT mice. Three images per mouse and n = 5–6 mice/sex/genotype. Data are represented as mean ± SEM. Two-Way ANOVA followed by Tukey’s post hoc test to examine biologically relevant interactions. *p < 0.05, **p < 0.001. h DD score for PS19;ApoeCh vs. PS19 in a PS19 brain. i DAM cluster highlighted (black) in XY space in a PS19 brain. j Pseudo-bulk expression of the top 20 DEGs between PS19;ApoeCh and PS19 in the DAM cluster across the four genotypes. k-n Microglial sub-clustering analysis. k UMAP of 13,940 microglial cells in space. Clustering at 0.4 resolution yielded 9 subclusters, excluding the smallest subcluster that had fewer than 100 cells. l Feature plots of common microglial and DAM marker genes in UMAP space. m Proportion of the number of cells in each microglial subcluster, grouped by genotype. Proportions are normalized for the total number of microglia in each genotype. n Microglial subclusters plotted in XY space in a PS19 brain
Fig. 9
Fig. 9
Microglia have differential responses to plaque and tau pathology. a-g Comprehensive analysis of all microglia (i.e., disease-associated and homeostatic) across both 5xFAD and PS19 cohorts. a UMAP of 41,790 microglia merged and integrated across both 5xFAD;ApoeCh and PS19;ApoeCh datasets (n = 3 for 5xFAD;ApoeCh, 5xFAD, PS19;ApoeCh, and PS19; n = 5 for ApoeCh; n = 6 for WT). Cells are labelled using their annotations from original datasets prior to merging. b UMAP of merged microglia split by genotype. DAMs in PS19 genotype are localized to one side of the DAM cluster in UMAP space. c Feature plots of DAM markers Cd74, H2-Ab1, H2-Aa, Trem2, Cst7, and Apoe in all microglia. d Distribution of DAMs and homeostatic microglia across genotypes. (d., Upper) Average microglial cell counts per section across each of the six genotypes. Cell counts for each genotype were divided by the total number of samples in that genotype. (d., Lower) Proportion of the number of cells in each genotype, grouped by DAM versus homeostatic microglia. e Scatterplot of the average difference in all microglia for all significant genes (i.e., padj < 0.05) between 5xFAD vs. WT and PS19 vs. WT comparisons. Directly correlated genes (blue) occur in the same direction for both comparisons, while inversely correlated genes (orange) occur in opposite directions for each comparison. Linear regression line showing the relationship between the two comparisons plotted in blue. f Scatterplot of the average difference in all microglia for all significant genes between 5xFAD;ApoeCh vs. 5xFAD and PS19;ApoeCh vs. PS19. g Volcano plot of DEGs between 5xFAD and PS19 DAMs. h–k Comparison of mouse single-cell spatial transcriptomics with human snRNA-seq data. h Schematic of data processing for snRNA-seq. Frontal cortex samples from the PSEN1-E280A heterozygous;APOE3Ch homozygous individual (n = 1) and PSEN1-E280A heterozygote controls (n = 5) were first reduced to 975 genes that overlapped with the CosMx mouse neuroscience panel, then processed through the standard Seurat pipeline with SCTransform. The two datasets were then merged and integrated using reciprocal PCA to account for batch effects between runs for a resulting dataset of 13,643 cells. i UMAP of integrated snRNA-seq data, with microglia highlighted. j DEGs between PSEN1-E280A;APOE3Ch vs. PSEN1-E280A in all microglia. Genes with padj < 0.05 are colored red (upregulated) or blue (downregulated). k Venn diagram of positively correlated genes between three comparisons: PSEN1-E280A;APOE3Ch vs. PSEN1-E280A (yellow oval), 5xFAD;ApoeCh vs. 5xFAD (blue oval), and PS19;ApoeCh vs. PS19 (green oval). Genes were considered positively correlated if the log-twofold-change of the average expression between the two groups was the same sign for both comparisons, and if the adjusted p-value was less than 0.05 for both comparisons. Upregulated genes are written in red text, while downregulated genes are written in blue text
Fig. 10
Fig. 10
Unbiased proteomics reveal differential effects of ApoeCh in 5xFAD versus PS19 mice. a DAPs between 5xFAD vs. WT mice. Log-twofold-change on the x-axis, -log-10 p-value on the y-axis. Proteins with p-value < 0.05 are colored in red (upregulated) or blue (downregulated. b DAPs between PS19 vs. WT mice. c Scatterplot of DAPs from comparisons in a and b. Log-twofold-change values of all proteins with p-value < 0.05 are plotted, with 5xFAD vs. WT comparison on the x-axis and PS19 vs. WT on the y-axis. Correlation coefficient R = 0.68, p < 0.001. d DAPs between 5xFAD;ApoeCh vs. 5xFAD mice. e DAPs between PS19;ApoeCh vs. PS19 mice. f Scatterplot of DAPs from comparisons in d and e. 5xFAD;ApoeCh vs. 5xFAD on x-axis, PS19;ApoeCh vs. PS19 on y-axis. g Pathway analysis of all significantly upregulated proteins in the 5xFAD;ApoeCh vs. 5xFAD comparison. h Pathway analysis of all significantly downregulated proteins in the PS19;ApoeCh vs. PS19 comparison. i Protein–protein interaction (PPI) network of all significantly upregulated proteins in the 5xFAD;ApoeCh vs. 5xFAD comparison. Nodes are colored according to function, including mitochondrial associated (red), ribosome associated (green), and postsynaptic structure proteins (blue). The thickness of the line connecting two nodes indicates the degree of confidence in the prediction of the PPI. j PPI network of all significantly downregulated proteins in the PS19;ApoeCh vs. PS19 comparison

Update of

References

    1. Braak H, Braak E. Neuropathological stageing of Alzheimer-related changes. Acta Neuropathol. 1991;82(4):239–59. - PubMed
    1. Tanzi RE. The genetics of Alzheimer disease. Cold Spring Harb Perspect Med. 2012;2(10):a006296. - PMC - PubMed
    1. Sherrington R, et al. Alzheimer’s disease associated with mutations in presenilin 2 is rare and variably penetrant. Hum Mol Genet. 1996;5(7):985–8. - PubMed
    1. Levy-Lahad E, et al. A familial Alzheimer’s disease locus on chromosome 1. Science. 1995;269(5226):970–3. - PubMed
    1. Rogaev EI, et al. Familial Alzheimer’s disease in kindreds with missense mutations in a gene on chromosome 1 related to the Alzheimer’s disease type 3 gene. Nature. 1995;376(6543):775–8. - PubMed

MeSH terms