. 2025 Jan 22;23(1):103.
doi: 10.1186/s12967-025-06086-1.

Single-cell profiling of SLC family transporters: uncovering the role of SLC7A1 in osteosarcoma

Affiliations

Single-cell profiling of SLC family transporters: uncovering the role of SLC7A1 in osteosarcoma

Yan Liao et al. J Transl Med. .

Abstract

Background: Osteosarcoma is the most common malignant bone tumor in children and adolescents, characterized by high disability and mortality rates. Over the past three decades, therapeutic outcomes have plateaued, underscoring the critical need for innovative therapeutic targets. Solute carrier (SLC) family transporters have been implicated in the malignant progression of a variety of tumors, however, their specific role in osteosarcoma remains poorly understood.

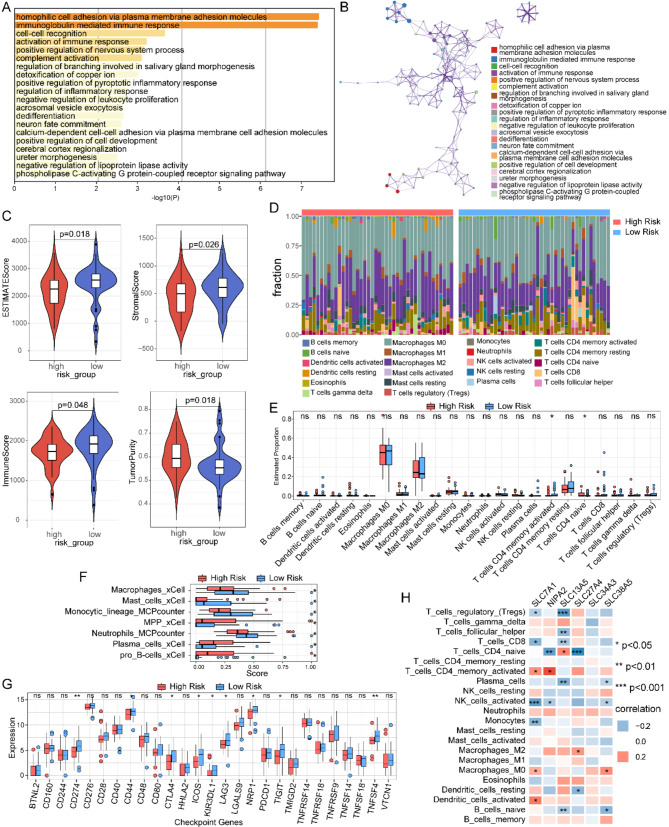
Methods: The single-cell sequencing data from GSE152048 and GSE162454, along with RNA-seq from the TARGET and GSE21257 cohorts, were utilized for the analysis in this study. LASSO regression analysis was conducted to identify prognostic genes and construct an SLC-related prognostic signature. Survival analysis and ROC analysis evaluated the validity of the prognostic signature. The ESTIMATE and CIBERSORT Packages were utilized to assess the immune infiltration status. Pseudotime and CellChat analyses were performed to investigate the relationship between SLC7A1, malignant phenotypes, and the immune microenvironment. CCK8 assays, EdU staining, colony formation assays, Transwell assays, and co-culture systems were used to assess the effects of SLC7A1 on cell proliferation, metastasis, and macrophage polarization. Finally, virtual docking identified potential drugs targeting SLC7A1.

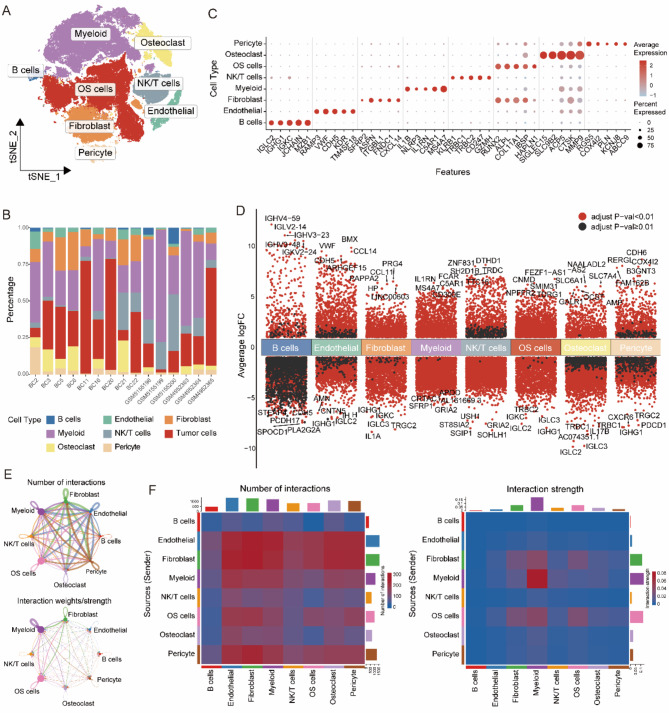
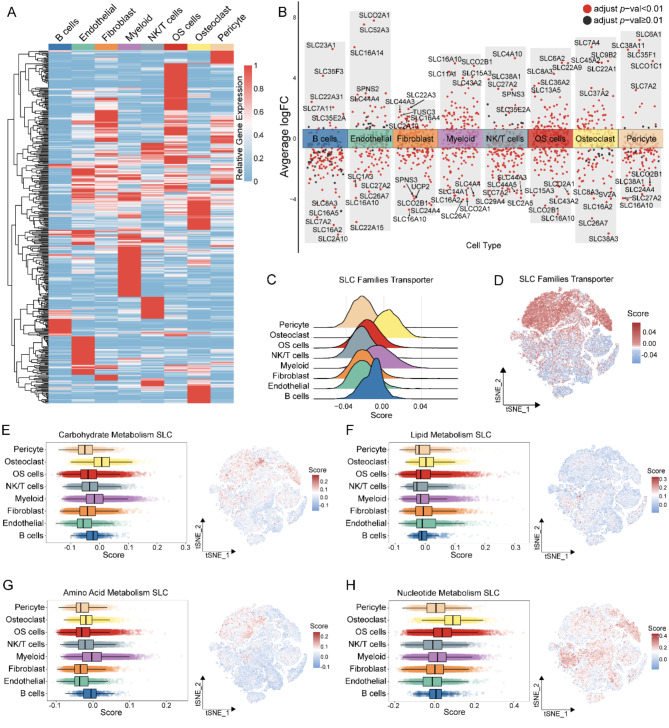
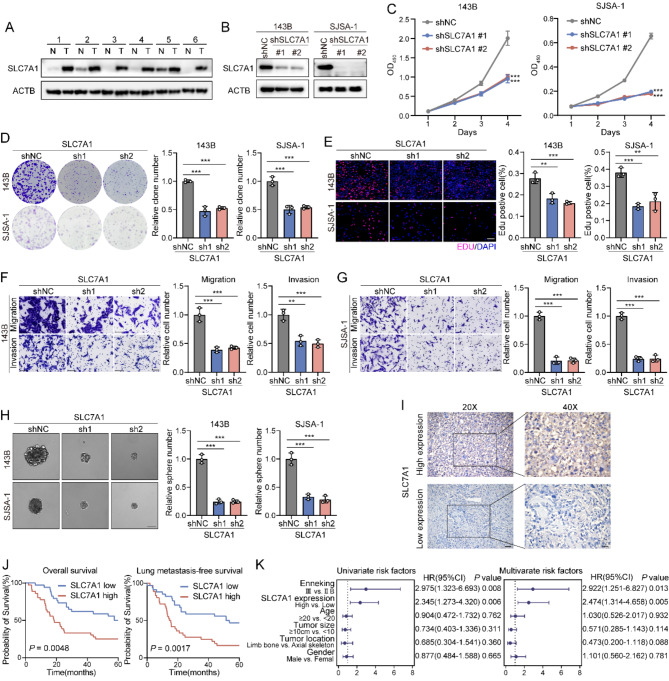
Results: SLCs displayed distinct expression patterns across various cell types within the osteosarcoma microenvironment, with myeloid cells exhibiting a preference for amino acid uptake. A prognostic model comprising nine genes was constructed via LASSO regression, with SLC7A1 showing the highest hazard ratio. Multiple analytical algorithms indicated that SLCs were associated with immune cell infiltration and immune checkpoint gene expression. Single-cell analysis indicated that SLC7A1 was predominantly expressed in osteosarcoma cells and correlated with various malignant tumor characteristics. SLC7A1 also regulate interactions between tumor cells and macrophages, as well as modulate macrophage function through multiple pathways. In vitro assays and survival analysis demonstrated that inhibition of SLC7A1 suppressed the malignant phenotype of osteosarcoma cells, with SLC7A1 expression correlating with poor prognosis. Co-culture models confirmed the involvement of SLC7A1 in macrophage polarization. Finally, virtual screening and CETSA identified Cepharanthine as potential inhibitors of SLC7A1.

Conclusion: SLC-related prognostic signatures can be utilized for the prognostic evaluation of osteosarcoma. Pharmacological inhibition of SLC7A1 may be a feasible therapeutic approach for osteosarcoma.

Keywords: Osteosarcoma; SLC7A1; Solute carrier (SLC) family transporters; TAMs; Tumor immune microenvironment.


Conflict of interest statement

Declarations. Ethics approval and consent to participate: Human sample collection for this study was conducted in accordance with the Declaration of Helsinki, and was approved by the Research Ethics Committee of the First Affiliated Hospital of Sun Yat-sen University, with the reference number [2021]755. Consent for publication: Not applicable. Competing interests: The authors declare that they have no competing interests.

Figures

Fig. 1
Fig. 1
Single-cell landscape in osteosarcoma. (A) t-SNE plot of single cells profiled in osteosarcoma. (B) Cell proportions in each samples. (C) Bubble plot of the average and percent expression of different markers in each cell types. (D) Differential gene expression analysis reveals up and down-regulated genes across various cell types. An adjusted p value < 0.01 is indicated in red, while an adjusted p value ≥ 0.01 is indicated in black. (E) Network of cell-cell communication; Number of interactions (top); Strength of interactions (bottom). (F) Heatmap of cell-cell communication; Number of interactions (left); Strength of interactions (right)
Fig. 2
Fig. 2
Landscape of SLCs in the scRNA-seq dataset for osteosarcoma. (A) Heatmap showing the expression of SLCs in each cell type. (B) Differential expression analysis of SLCs across each cell types. An adjusted p value < 0.01 is indicated in red, while an adjusted p value ≥ 0.01 is indicated in black. (C) Ridge plot of SLC score in each cell type. (D) t-SNE plot of SLC score in osteosarcoma dataset. (E) Enrichment score of Carbohydrates Metabolism SLC; CM-SLC Score in each cell type (left), t-SNE of CM-SLC Score(right). (F) Enrichment score of Lipid Metabolism SLC; LM-SLC Score in each cell type (left), t-SNE of LM-SLC Score(right). (G) Enrichment score of Amino Acid Metabolism SLC; AAM-SLC Score in each cell type (left), t-SNE of AAM-SLC Score(right). (H) Enrichment score of Nucleotide Metabolism SLC; NM-SLC Score in each cell type (left), t-SNE of NM-SLC Score(right)
Fig. 3
Fig. 3
Construction of an SLCs-related prognostic signature in osteosarcoma. (A) Coefficient profiles of SLCs. (B) Identification of the best parameter(lambda) in LASSO. (C) Cox analysis of identified 9 genes to construct the risk model. (D) Kaplan-Meier analysis of overall survival in training group. (E) Receiver operating characteristic (ROC) curve analysis for 1-,3-, and 5-year survival for risk model in training group. (F) Kaplan-Meier analysis of overall survival in testing group. (G) ROC curve analysis for 1-,3-, and 5-year survival for risk model in testing group. (H) Kaplan-Meier analysis of overall survival in GSE21257 cohort. (I) ROC curve analysis for 1-,3-, and 5-year survival for risk model in GSE21257 cohort. (J) Nomogram for predicting 1-, 3-, and 5-year survival rate in osteosarcoma. (K) Calibration curves for internal validation of the nomogram. (L) ROC curve analysis of the nomogram in predicting the overall survival
Fig. 4
Fig. 4
Immune landscape of SLC-related prognostic signature in osteosarcoma patients. (A) GO annotation of differential genes between high and low-risk groups. (B) Network of enriched terms. (C) Comparison of immune score, stromal score, estimate score, and tumor purity between low- and high-risk groups. (D) Immune cell fraction analysis by CIBERSORT. (E) Immune cell infiltration proportions between low- and high-risk groups by CIBERSORT. (F) Immune cell infiltration proportions between low- and high-risk groups by XCELL and MCPcounter. (G) Expression of immune checkpoint genes between low- and high-risk groups
Fig. 5
Fig. 5
Single-cell analysis of SLC7A1 in osteosarcoma cells. (A) Average and percent expression of SLC7A1 in each cell types. (B) t-SNE plot showing the clustering of OS cells. (C) Heatmap showing the differential genes in each OS Clusters. (D) Average and percent expression of SLC7A1 in each OS Clusters. (E) t-SNE plot of SLC7A1 expression in OS cells. (F) t-SNE plot showing density of SLC7A1 in OS cells. (G) Pseudotemporal ordering trajectory map of OS cells. (H) Pseudotemporal ordering of OS Clusters. (I) Trajectory plot showing the expression of SLC7A1. (J) SLC7A1 pseudotemporal expression map. (K) scMetabolism analysis of OS Clusters. (L) The tumor Hallmark scores of SLC7A1-positive and SLC7A1-negative cells in OS cells
Fig. 6
Fig. 6
SLC7A1 promotes the proliferation and metastasis of osteosarcoma in vitro and is correlates with poor prognosis. (A) SLC7A1 protein levels measured in 6 matched pairs of osteosarcoma and adjacent normal tissues by immunoblotting. (B) Knockdown of SLC7A1 in 143B and SJSJ1 cell lines. (C) Proliferation assay of SLC7A1-KD 143B (left) and SJSA-1 (right) cells (n = 6). (D) Colony formation of SLC7A1-KD 143B and SJSA-1 cells (left). Quantification of colony formation (right) (n = 3). (E) EdU incorporation assay of SLC7A1-KD 143B and SJSA-1 cells (left). Quantification of EdU incorporation assay (right). Scale bar: 100 μm (n = 3). (F) Migration and invasion of SLC7A1-KD 143B cells (left). Quantification of migration and invasion (right). Scale bar: 100 μm (n = 3). (G) Migration and invasion of SLC7A1-KD SJSA-1 cells (left). Quantification of migration and invasion (right). Scale bar: 100 μm (n = 3). (H) Sphere formation assay of SLC7A1-KD 143B and SJSA-1 cells (left). Quantification of Sphere formation assay (right) (n = 3). (I) Representative IHC images showing high or low expression of SLC7A1 in patient tumor specimens. Scale bars: 50 μm (left), 25 μm (right). (J) Overall survival (left) and LMFS (right) of patients according to the expression levels of SLC7A1, by log-rank test. (K) Univariate and multivariate analyses of prognostic factors for overall survival and LMFS among patients with osteosarcoma, by Wald test. Data are presented as the mean ± SD. ∗p < 0.05, ∗∗p < 0.01, and ∗∗∗p < 0.001, by two-way ANOVA with Dunnett’s multiple comparisons test (C) and one-way ANOVA with Dunnett’s multiple comparisons test (D, E, F, G, and H)
Fig. 7
Fig. 7
Analysis of immune cell proportions and cell communication in SLC7A1-associated groups (A) Cell proportion in different SLC7A1 expression groups. (B) Clustering of myeloid cells. (C) Feature plots of marker genes in each clusters of myeloid cells. (D) Bubble plot of the average and percent expression of different markers in each clusters of myeloid cells. (E) Cell proportion of TAMs in different SLC7A1 expression groups. (F) scMetabolism analysis of TAMs in different SLC7A1 expression groups. (G) Heatmap of cell-cell communication between OS cells and immune cells. Number of interactions (left); Strength of interactions (right). (H) Network of cell-cell communication between OS cells and immune cells. Number of interactions (left); Strength of interactions (right). (I) Heatmap showing differential interactions between OS cells and immune cells. (J) Differential cell-cell communication signaling pathways between OS cells and TAMs in different SLC7A1 expression groups. (K) Bubble heatmap showing upregulated receptor-ligand interactions between OS cells and TAMs in High-SLC7A1 group. (L) Chord diagram showing upregulated receptor-ligand interactions between OS cells and TAMs in High-SLC7A1 group
Fig. 8
Fig. 8
SLC7A1 influenced M2 macrophage polarization. (A) Schematic diagram of the co-culture model workflow between osteosarcoma cells and macrophages derived from induced THP1 cells. (B) CD206 expression in TAMs co-cultured with control or SLC7A1-KD 143B cells, detected by flow cytometry (left). Quantification of CD206 + TAMs (right) (n = 3). (C) CD86 expression in TAMs co-cultured with control or SLC7A1-KD 143B cells, detected by flow cytometry (left). Quantification of CD86 + TAMs (right) (n = 3). (D) The expression of CD206, ARG1, IL10, TGFB1, and CD163 mRNA in TAMs co-cultured with control or SLC7A1-KD 143B cells, detected by qRT-PCR analyses (n = 3). Data are presented as the mean ± SD, ∗p < 0.05, ∗∗p < 0.01, and ∗∗∗p < 0.001, by Students’ t-test (B, C, and D)
Fig. 9
Fig. 9
Structure-based virtual screen of SLC7A1 (A) Schematic diagram of the workflow for structure-based virtual screening. (B) The predicted 3D structure of SLC7A1 by AlphaFold2. (C) Predicted aligned error of the SLC7A1 3D model. (D) Overall model quality of the SLC7A1 3D analyzed by ProSA-Web. (E) The calculated binding mode between Paritaprevie and SLC7A1. (F) The calculated binding mode between Cepharanthine and SLC7A1. (G) The calculated binding mode between Midostaurin and SLC7A1. (H) The calculated binding mode between Ledipasvir and SLC7A1. (I) The calculated binding mode between Alcuronium and SLC7A1. (J) The calculated binding mode between Venetoclax and SLC7A1. (K) The calculated binding mode between Eltrombopag and SLC7A1. (L) The calculated binding mode between Simeprevir and SLC7A1. (M) The calculated binding mode between Vaprisol and SLC7A1. (N) The calculated binding mode between Glecaprevir and SLC7A1
Fig. 10
Fig. 10
Cepharanthine is a potential targeted inhibitor of SLC7A1. (A) Inhibition of arginine uptake in 143B cells by 10 drugs. (B) IC50 analysis of Paritaprevir, Cepharanthine, Eltrombopag, and Simeprevir. (C) CETSA showing the binding of CPE to SLC7A1 protein. (D) Arginine uptake in 143B cells treated with 0, 2, and 5 µM CPE. (E) CCK8 assay evaluating the proliferation of 143B cells treated with 0, 2, and 5 µM CPE. (F) Schematic of conditioned medium production from CPE -pretreated 143B cells. Cells were treated with 0, 2, or 5 µM CPE, followed by medium replacement after 24 h. After an additional 24-hour incubation, the conditioned medium was collected. This medium was used to culture THP1-induced macrophages for 48 h before flow cytometry analysis. (G) Flow cytometry analysis of CD206 expression in macrophages. (H) Flow cytometry analysis of CD86 expression in macrophages

References

    1. Whelan JS, Davis LE. Osteosarcoma, Chondrosarcoma, and Chordoma. J Clin Oncology: Official J Am Soc Clin Oncol. 2018;36(2):188–93. - PubMed
    1. Mirabello L, Troisi RJ, Savage SA. International osteosarcoma incidence patterns in children and adolescents, middle ages and elderly persons. Int J Cancer. 2009;125(1):229–34. - PMC - PubMed
    1. Gill J, Gorlick R. Advancing therapy for osteosarcoma. Nat Reviews Clin Oncol. 2021;18(10):609–24. - PubMed
    1. Ritter J, Bielack SS, Osteosarcoma. Annals of Oncology. Official J Eur Soc Med Oncol. 2010;21(Suppl 7):vii320–5. - PubMed
    1. Meltzer PS, Helman LJ. New Horizons in the Treatment of Osteosarcoma. N Engl J Med. 2021;385(22):2066–76. - PubMed

Publication types

MeSH terms

LinkOut - more resources