. 2025 Feb 5;166(3):bqaf016.
doi: 10.1210/endocr/bqaf016.

Interaction of B0AT1 Deficiency and Diet on Metabolic Function and Diabetes Incidence in Male Nonobese Diabetic Mice

Affiliations

Interaction of B0AT1 Deficiency and Diet on Metabolic Function and Diabetes Incidence in Male Nonobese Diabetic Mice

Matthew F Waters et al. Endocrinology. .

Abstract

Context: The obesity epidemic parallels an increasing type 1 diabetes incidence, such that westernized diets, containing high fat, sugar, and/or protein, through inducing nutrient-induced islet β-cell stress, have been proposed as contributing factors. The broad-spectrum neutral amino acid transporter (B0AT1), encoded by Slc6a19, is the major neutral amino acids transporter in intestine and kidney. B0AT1 deficiency in C567Bl/6J mice causes aminoaciduria, lowers insulinemia, and improves glucose tolerance.

Objective: We investigated the effects of standard rodent chow (chow), high-fat high-sucrose (HFHS), and high-fat high-protein (HFHP) diets, in addition to B0AT1 deficiency, on the diabetes incidence of male nonobese diabetic (NOD/ShiLtJArc (NOD)) mice.

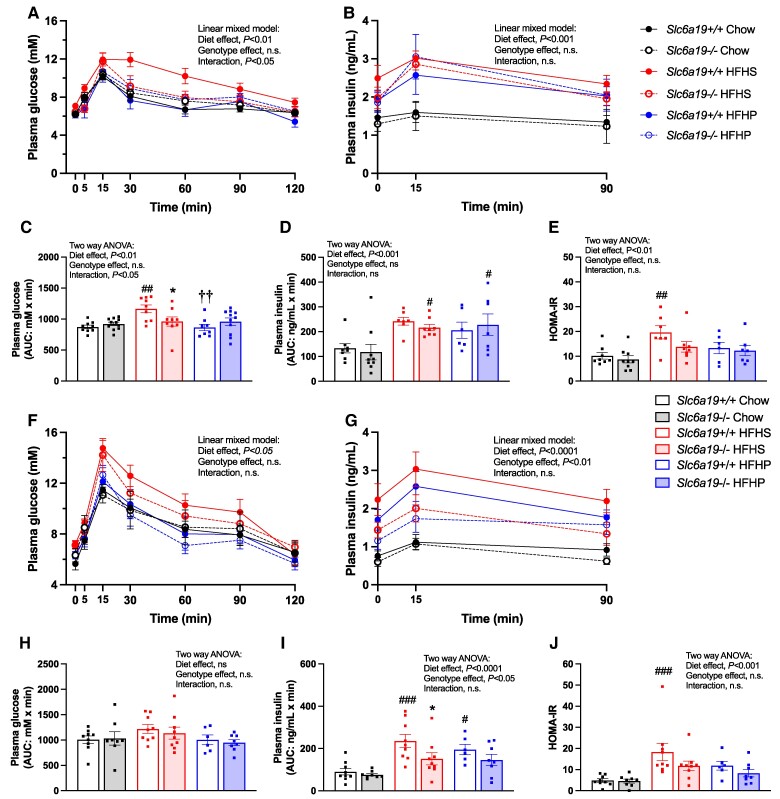
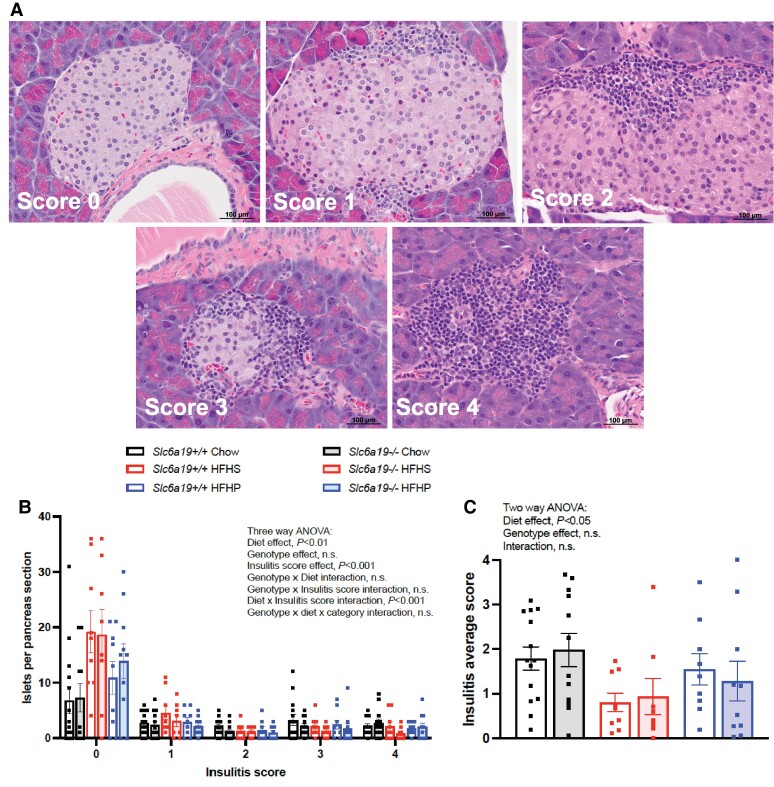
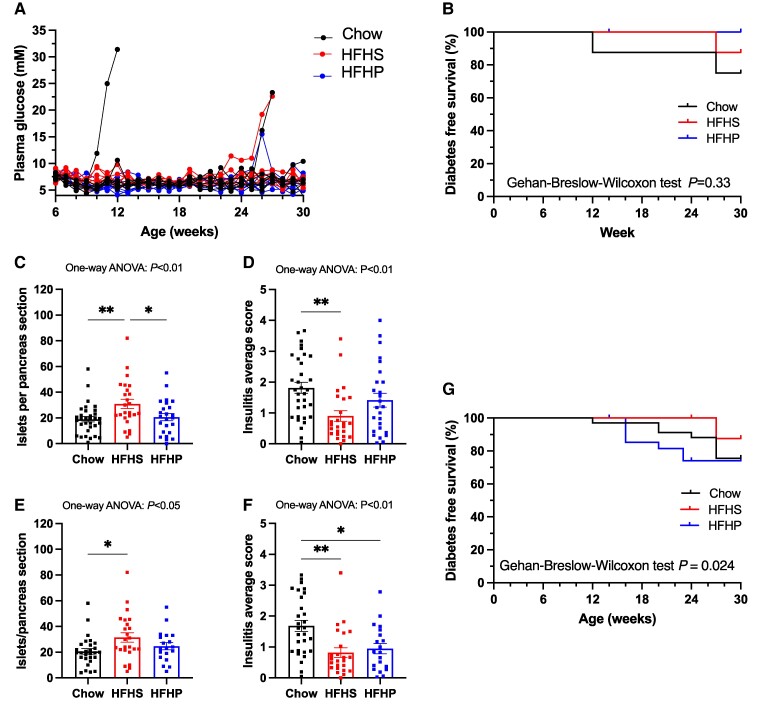
Methods: Male NOD.Slc6a19+/+ and NOD.Slc6a19-/- mice were fed chow, HFHS and HFHP diets from 6 to 24 weeks of age. A separate cohort of male NOD mice were fed the three diets from 6-30 weeks of age. Body weight and fed-state blood glucose and plasma insulin were monitored, and urinary amino-acid profiles, intraperitoneal glucose tolerance, diabetes incidence, pancreatic islet number, insulitis scores and beta-cell mass were measured.

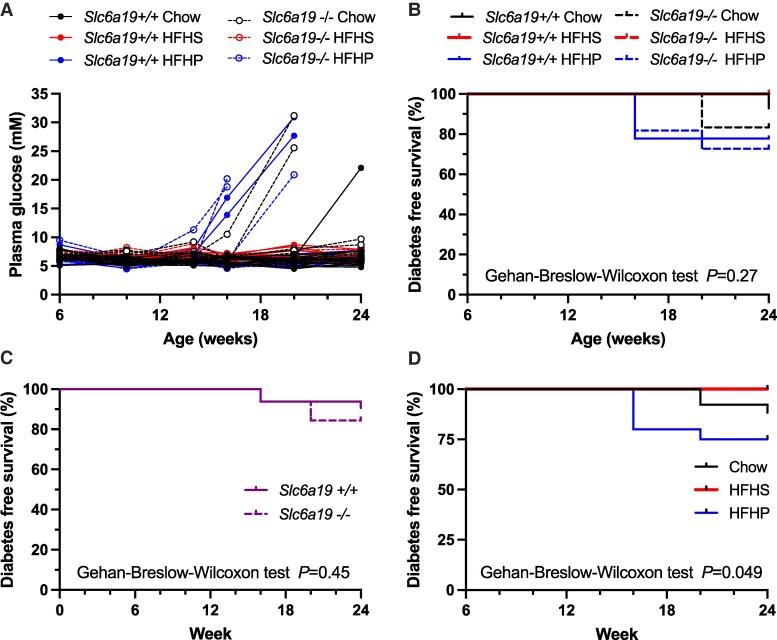
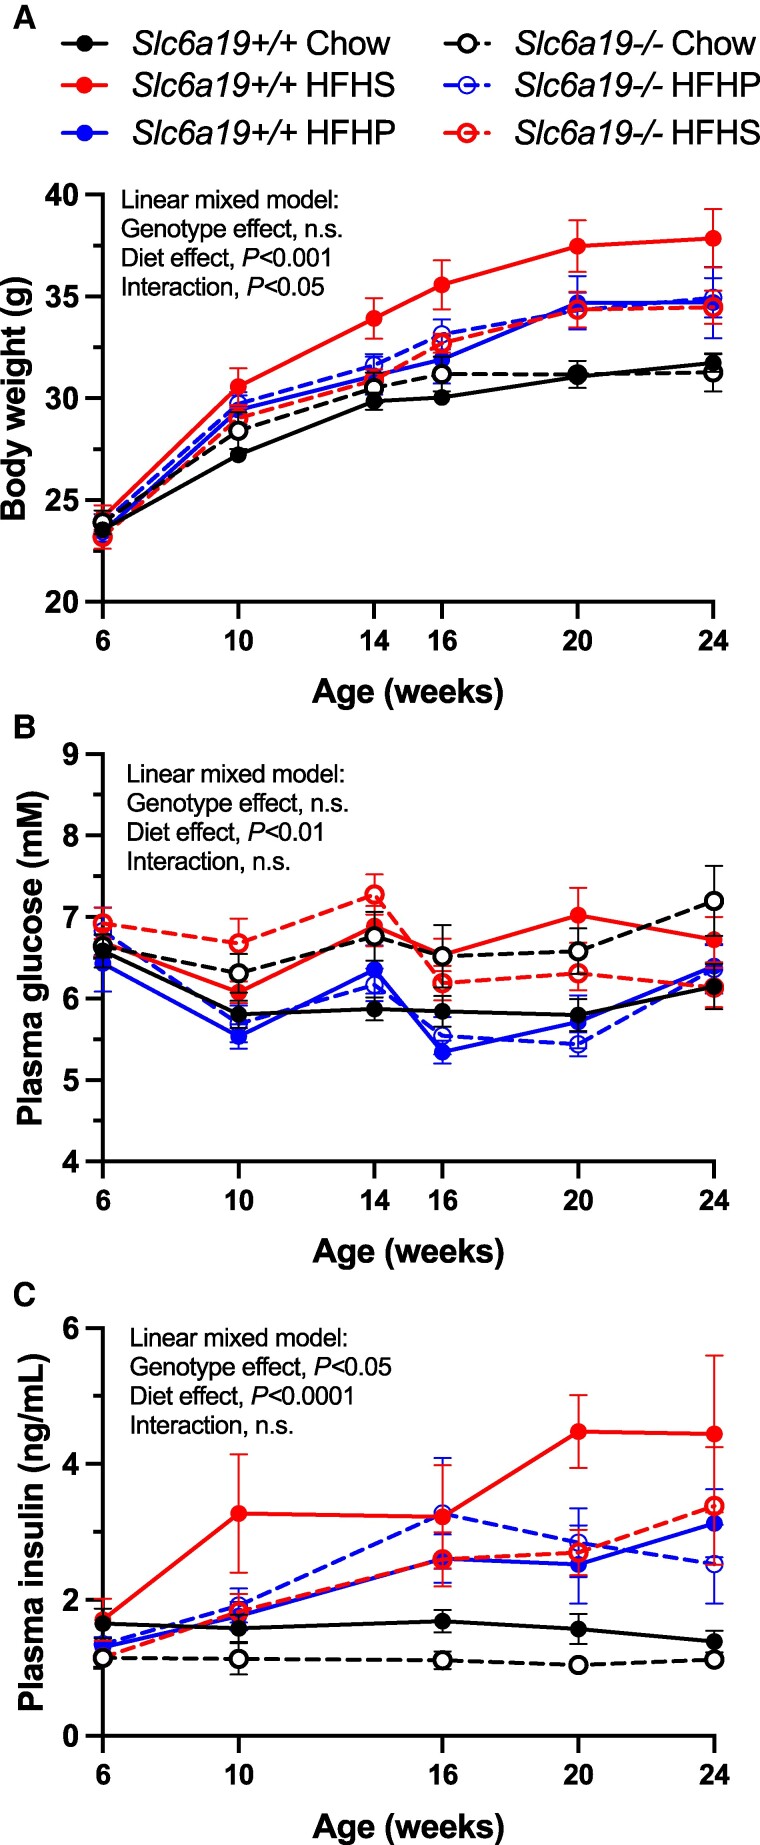
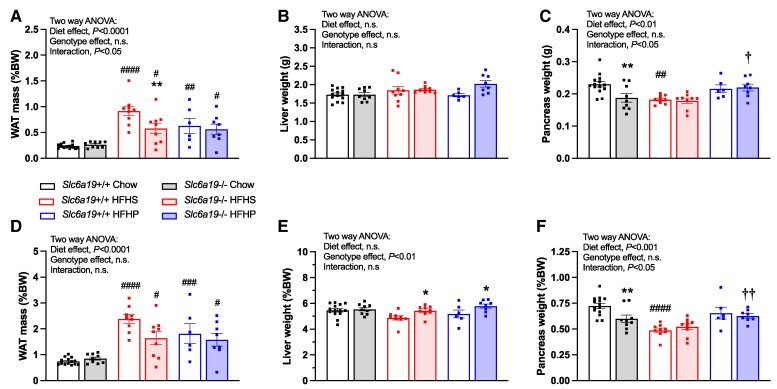
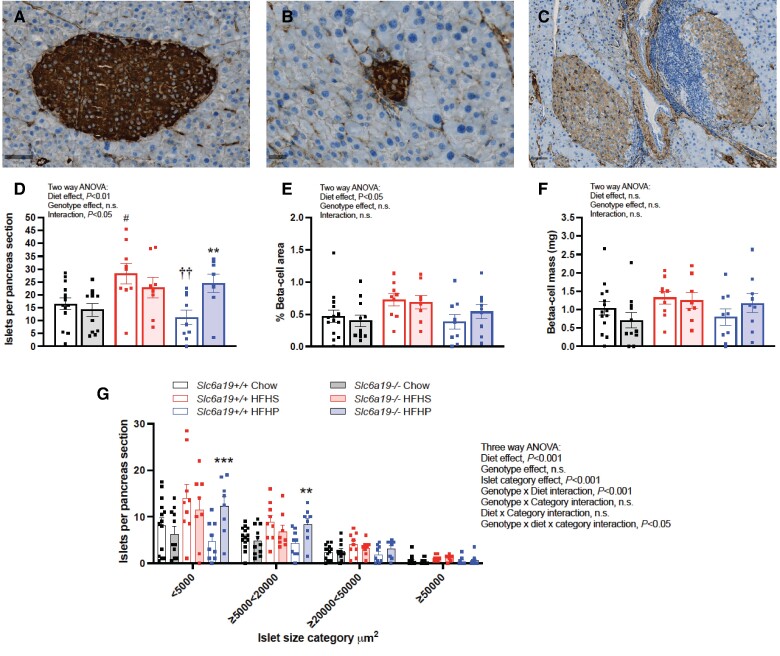
Results: The incidence of diabetes and severe glucose intolerance was 3.8% in HFHS-fed, 25.0% in HFHP-fed, and 14.7% in chow-fed mice, with higher pancreatic islet number and lower insulitis scores in HFHS-fed mice. B0AT1 deficiency had no effect on diabetes incidence, but curtailed HFHS-induced excessive weight gain, adipose tissue expansion, and hyperinsulinemia. In HFHP-fed mice, B0AT1 deficiency significantly increased pancreatic β-cell clusters and small islets. Male NOD mice that did not develop autoimmune diabetes were resistant to diet-induced hyperglycemia.

Conclusion: Dietary composition does, but B0AT1 deficiency does not, affect autoimmune diabetes incidence in male NOD mice. B0AT1 deficiency, however, reduces diet-induced metabolic dysfunction and in HFHP-fed mice increases pancreatic β-cell clusters and small islets.

Keywords: Slc6a19; broad-spectrum neutral amino acid transporter; high-fat high-protein diet; high-fat high-sucrose diet; nonobese diabetic mice; type 1 diabetes.


Figures

Figure 1.
Figure 1.
Diabetes incidence in male NOD.Slc6a19 mice is affected by diet, but not Slc6a19 genotype. A, Serial 9 Am fed plasma glucose (individual mice results shown). B, Diabetes-free survival in NOD.Slc6a19 mice according to diet and genotype (n = 9-14 mice per group; Gehan-Breslow-Wilcoxon test; P = .25). C, Diabetes-free survival according to genotype only (Slc6a19+/+ n = 32 mice, Slc6a19−/− n = 32 mice; Gehan-Breslow-Wilcoxon test; P = .45). D, Diabetes-free survival according to diet only (chow n = 26 mice, high-fat high-sucrose [HFHS] n = 18 mice, high-fat high-protein [HFHP] n = 20 mice; Gehan-Breslow-Wilcoxon test; P = .049; Bonferroni post hoc testing chow vs HFHS; P = .41; chow vs HFHP; P = .28; HFHS vs HFHP; P = .075).
Figure 2.
Figure 2.
Slc6a19 deficiency attenuates accelerated weight gain and the development of hyperinsulinemia in high-fat high-sucrose (HFHS)-fed male NOD.Slc6a19 mice. A, Serial 9 Am fed body weight; B, plasma glucose; and C, plasma insulin. Data are presented as means ± SEM of 9 to 14 mice per group. Linear mixed model Tukey post hoc testing of diet effect: A, chow vs HFHS, P < .001; chow vs high-fat high-protein (HFHP), P < .05; HFHS vs HFHP, n.s.; B, chow vs HFHS, n.s.; chow vs HFHP, P < .05; HFHS vs HFHP, P < .01; and C, chow vs HFHS, P < .0001; chow vs HFHP, P < .01; HFHS vs HFHP, n.s. Linear mixed model Tukey post hoc testing of genotype effect: A, Slc6a19+/+ chow vs Slc6a19−/− chow, n.s.; Slc6a19+/+ HFHS vs Slc6a19−/− HFHS, P < .05; Slc6a19+/+ HFHP vs Slc6a19−/− HFHP, n.s.; C, Slc6a19+/+ chow vs Slc6a19−/− chow, n.s.; Slc6a19+/+ HFHS vs Slc6a19−/− HFHS, P < .05; Slc6a19+/+ HFHP vs Slc6a19−/− HFHP n.s. n.s., not significant.
Figure 3.
Figure 3.
Scl6a19 deficiency reduces high-fat high-sucrose (HFHS)-induced hyperinsulinemia without deterioration in glycemia in male NOD.Scl6a19 mice. A to J, A and F, Intraperitoneal glucose tolerance test plasma glucose; B and G, insulin; C and H, area under the curve (AUC) glucose; D and I, AUC insulin; and E and J, homeostatic model of insulin resistance (HOMA-IR) at A to E, age 13 weeks and F to J, age 26 weeks of age. Data presented as means ± SEM of A to E, n = 6-14 and of F to J, n = 6-9 mice per group. Linear mixed model Tukey post hoc testing diet effect: A, chow vs HFHS, P < .05; chow vs high-fat high-protein (HFHP), n.s.; HFHS vs HFHP, P < .05; B, chow vs HFHS, P < .01; chow vs HFHP, P < .05; HFHS vs HFHP, n.s.; F, chow vs HFHS, n.s.; chow vs HFHP, n.s.; HFHS vs HFHP, n.s.; G, chow vs HFHS, P < .0001; chow vs HFHP P < .01; HFHS vs HFHP, n.s. Linear mixed model Tukey post hoc testing genotype effect: A, Slc6a19+/+ chow vs Slc6a19−/− chow, n.s.; Slc6a19+/+ HFHS vs Slc6a19−/− HFHS, P < .05; Slc6a19+/+ HFHP vs Slc6a19−/− HFHP, n.s.; G, Slc6a19+/+ chow vs Slc6a19−/− chow, n.s.; Slc6a19+/+ HFHS vs Slc6a19−/− HFHS, P < .05; Slc6a19+/+ HFHP vs Slc6a19−/− HFHP, n.s.; C to E and H to J, 2-way analysis of variance with Tukey post hoc testing; *P less than .05 vs Slc6a19+/+ on same diet; #P less than .05, ##P less than .01 vs chow of the same genotype group; P less than .05, ††P less than .01 vs HFHS of same genotype group; n.s., not significant.
Figure 4.
Figure 4.
Effects of chow, high-fat high-sucrose (HFHS), and high-fat high-protein (HFHP) diets on white adipose tissue (WAT), liver, and pancreas tissue weights. A to C, Absolute tissue weights of A, epididymal WAT; B, liver; and C, pancreas at age 30 weeks. D to F, Corresponding tissue weights as a percentage of body weight of D, epididymal WAT; E, liver; and F, pancreas. Data are presented as means ± SEM of 6 to 14 mice per group; A to F, 2-way analysis of variance with Tukey post hoc testing; *P less than .05, **P less than .01 vs Slc6a19+/+ on same diet; #P less than .05, ##P less than .01, ###P less than .001, ####P less than .0001 vs chow of the same genotype group; P less than .05, ††P less than .01 vs HFHS of same genotype group; n.s., not significant.
Figure 5.
Figure 5.
High-fat high-sucrose (HFHS)-fed compared to chow-fed male NOD.Slc6a19 mice have greater numbers of insulitis stage 0 islets. A, Representative hematoxylin-eosin stain; image examples using in insulitis scoring, 0 = no insulitis, 1 = peri-islet insulitis, 2 = invasive insulitis less than 50%, 3 = invasive insulitis 50% or greater, and 4 = invasive insulitis 100%. B, Number of islets at each grade of insulitis (grades 0-4) per pancreas section. C, Insulitis average score per pancreas section. B and C, Data are presented as means ± SEM of 8 to 14 mice per group. B, Three-way analysis of variance (ANOVA) with Tukey post hoc testing for diet effect; for insulitis score 0, chow vs HFHS, P less than .0001; chow vs high-fat high-protein (HFHP), P less than .001; HFHS vs HFHP, P less than .001. C, Two-way ANOVA; n.s., not significant.
Figure 6.
Figure 6.
B0AT1 deficiency increases the number of small islets and β-cell clusters in high-fat high-protein (HFHP)-fed male NOD.Slc6a19 mice. A to C, Representative micrographs showing insulin immunohistochemistry examples. A, Normal size islet (≥20 000 and <50 000 μm2) without evidence of insulitis; B, small cluster of insulin immune-stained cells (<5000 μm2); C, 2 large islets (50 000 μm2) with insulitis scores of 2, one with less than 10% invasion and one at just under 50% inflammatory infiltrate invasion. D to G, D, Number of islets per pancreas section; E, percentage of pancreas area occupied by β cells; F, β-cell mass; and G, islet size distribution. Data presented as means ± SEM of n = 8 to 14 mice per group. D to F, Two-way analysis of variance (ANOVA) with Tukey post hoc testing; **P less than .01 vs Slc6a19+/+ on same diet; #P less than .05 vs chow of the same genotype group; ††P less than .01 vs high-fat high-sucrose (HFHS) of same genotype group; n.s., not significant. G, Three-way ANOVA with Tukey post hoc testing for diet effect; for islet category less than 5000 μm2, chow vs HFHS, P < .0001; chow vs HFHP, n.s.; HFHS vs HFHP, P less than .05; for genotype effect; **P less than .01, ***P less than .001 vs Slc6a19+/+ on same diet.
Figure 7.
Figure 7.
Combining studies, high-fat high-sucrose (HFHS) feeding of male NOD and NOD.Slc6a19 mice increases total number of islets per pancreas and lowers the insulitis average score compared to chow fed mice. A, Serial 9 Am fed plasma glucose of male NOD mice fed chow, HFHS, and high-fat high-protein (HFHP) diets (individual mice results shown, n = 8 mice per group). B, Diabetes-free survival in male NOD mice. Total number of islets counted per pancreas section (Gehan-Breslow-Wilcoxon test, n = 8 mice per group). C, Total number of islets counted per pancreas section, D, insulitis average score per pancreas section in male NOD and NOD.Slc6a19 mice. E, Total number of islets counted per pancreas section, F, insulitis average score per pancreas section in male NOD and NOD.Slc6a19 mice after removal of mice pancreas results of diabetic mice, including severely glucose-intolerant mice. C and D, Chow n = 33 mice, HFHS n = 25 mice, HFHP n = 26 mice; E and F, chow n = 29 mice, HFHS n = 24 mice, HFHP n = 20 mice; one-way analysis of variance with Bonferroni post hoc testing; *P less than .05; **P less than .01. G, Diabetes-free survival all male NOD and NOD.Slc6a19 mice. Chow n = 34, HFHS n = 26, HFHP n = 28; Gehan-Breslow-Wilcoxon test; P = .024; Bonferroni post hoc tests chow vs HFHS; P = .22; chow vs HFHP; P = .52; HFHS vs HFHP; P = .024.

References

    1. DiMeglio LA, Evans-Molina C, Oram RA. Type 1 diabetes. Lancet. 2018;391(10138):2449‐2462. - PMC - PubMed
    1. Insel RA, Dunne JL, Atkinson MA, et al. Staging presymptomatic type 1 diabetes: a scientific statement of JDRF, the Endocrine Society, and the American Diabetes Association. Diabetes Care. 2015;38(10):1964‐1974. - PMC - PubMed
    1. Gregory GA, Robinson TIG, Linklater SE, et al. Global incidence, prevalence, and mortality of type 1 diabetes in 2021 with projection to 2040: a modelling study. Lancet Diabetes Endocrinol. 2022;10(10):741‐760. - PubMed
    1. Hamman RF, Bell RA, Dabelea D, et al. The SEARCH for diabetes in youth study: rationale, findings, and future directions. Diabetes Care. 2014;37(12):3336‐3344. - PMC - PubMed
    1. Patterson CC, Dahlquist GG, Gyurus E, Green A, Soltesz G; EURODIAB Study Group . Incidence trends for childhood type 1 diabetes in Europe during 1989-2003 and predicted new cases 2005-20: a multicentre prospective registration study. Lancet. 2009;373(9680):2027‐2033. - PubMed