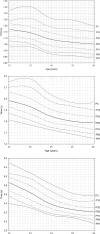
Normative and limit values of speed, endurance and power tests results of young football players
- PMID: 39844899
- PMCID: PMC11751035
- DOI: 10.3389/fphys.2024.1502694
Normative and limit values of speed, endurance and power tests results of young football players
Abstract
Introduction: This study aimed to assess the development of speed, endurance and power in young football players and to create percentile charts and tables for standardized assessment.
Methods: Cross-sectional data were collected from 495 male players aged 12-16 years at RKS Raków Częstochowa Academy in 2018-2022. Players participated in a systematic training in which running time 5 m, 10 m, 30 m, lower limb power (standing long jump), and Maximum Aerobic Speed (MAS) were measured using the 30-15 Intermittent Fitness Test. All tests were performed under constant environmental conditions by qualified personnel. Statistical analysis included ANOVA and percentile distribution for P3, P10, P25, P50, P75, P90, P97.
Results: Results indicated that the most significant improvements occurred between the ages of 13 and 14, with increased speed over all distances and a significant increase in power. Percentile tables were developed, highlighting improvements in speed 5 m: 0.087-0.126 s; 10 m 0.162-0.215 s; 30 m: 0.438-0.719 s and power in the long jump test: 31-48 cm. Improvements in MAS ranged from 0.3 to 0.6 m/s across the percentiles.
Discussion: The results highlight the need for individual training programs tailored to the biological maturity of players. The developed percentile charts and tables offer a valuable tool for coaches and sports scientists to monitor progress, optimize training loads, and minimize the risk of injury, providing a frame of reference for assessing the physical development of young soccer players. Future research should focus on extending these charts and tables to other age groups and genders to refine training methodologies further.
Keywords: endurance; maximal aerobic speed; physical demands; speed; young soccer players.
Copyright © 2025 Nowak, Szymanek-Pilarczyk, Stolarczyk, Oleksy, Muracki and Wąsik.
Conflict of interest statement
The authors declare that the research was conducted in the absence of any commercial or financial relationships that could be construed as a potential conflict of interest.
Figures


References
-
- Abbott A., Collins D. (2002). A theoretical and empirical analysis of a ‘state of the Art’ talent identification model. High. Abil. Stud. 13 (2), 157–178. 10.1080/1359813022000048798 - DOI
-
- Andrzejewski M., Chmura J., Strzelczyk R., Konarski J. (2009). Individualization of physical loads and speed abilities of young soccer players in a six-month training macrocycle. J. Hum. Kinet. 22 (1), 35–41. 10.2478/V10078-009-0021-6 - DOI
-
- Bartosz M., Latocha A., Motowidło J., Krzysztofik M., Zając A. (2024). The relationship between countermovement jump performance and sprinting speed in elite sprinters. Phys. Act. Rev. 12 (2), 29–37. 10.16926/PAR.2024.12.19 - DOI
-
- Buchheit M., Saint P., Club G. F. (2010). The 30-15 intermittent fitness test: 10 year review. Myorobie J. 1. Available at: http://www.martin-buchheit.net.
LinkOut - more resources
Full Text Sources
Research Materials

