. 2025 Jan 8:15:1489900.
doi: 10.3389/fmicb.2024.1489900. eCollection 2024.

Microbial communities in the phyllosphere and endosphere of Norway spruce under attack by Heterobasidion

Affiliations

Microbial communities in the phyllosphere and endosphere of Norway spruce under attack by Heterobasidion

Wen-Jing Meng et al. Front Microbiol. .

Abstract

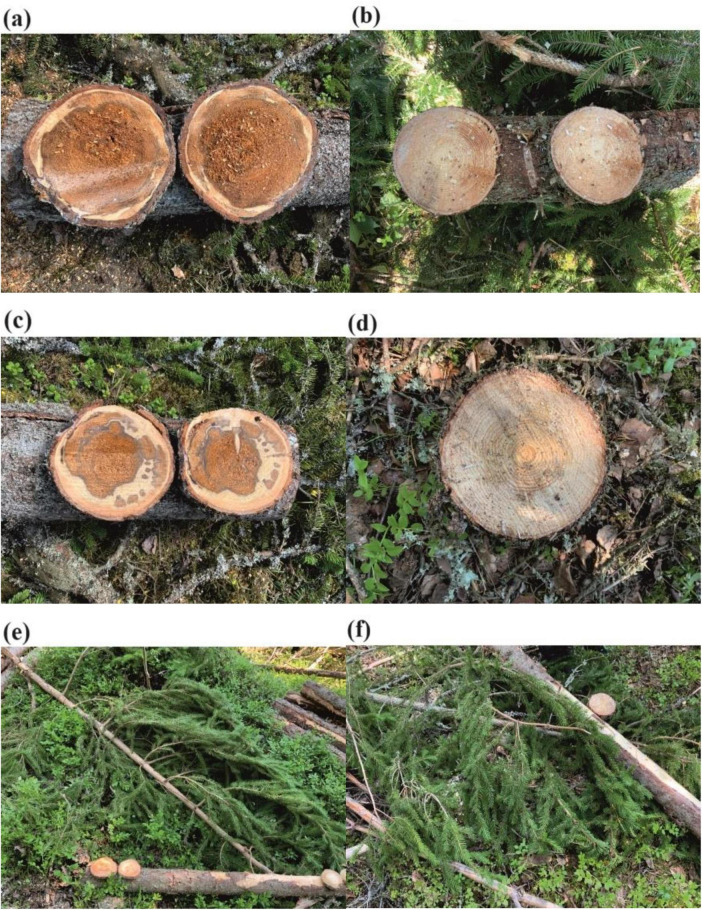
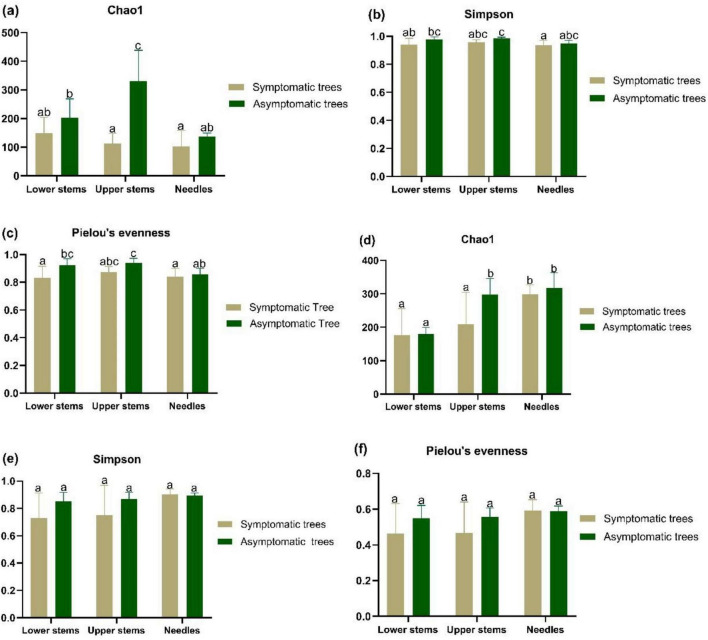
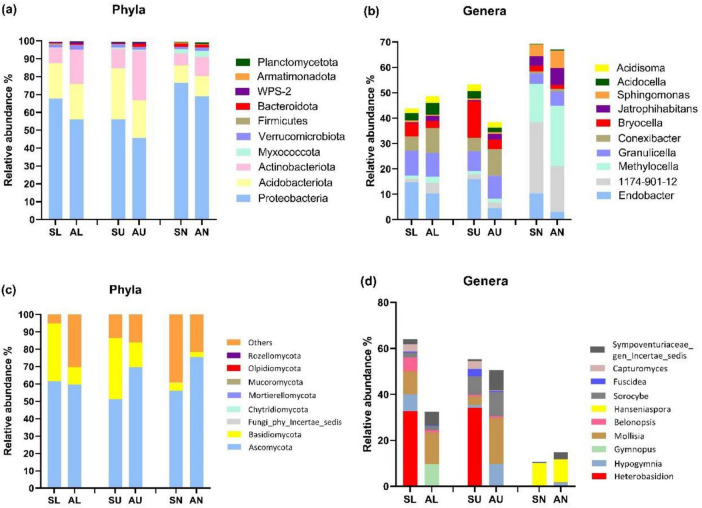
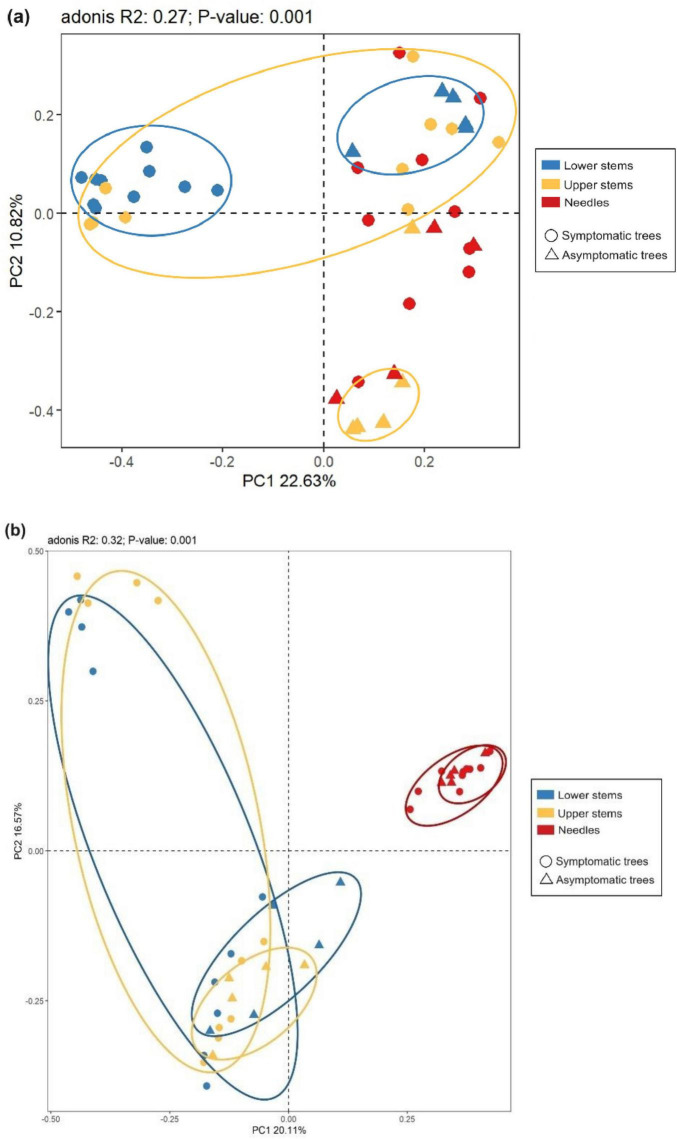
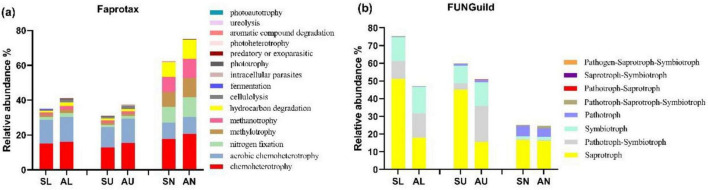
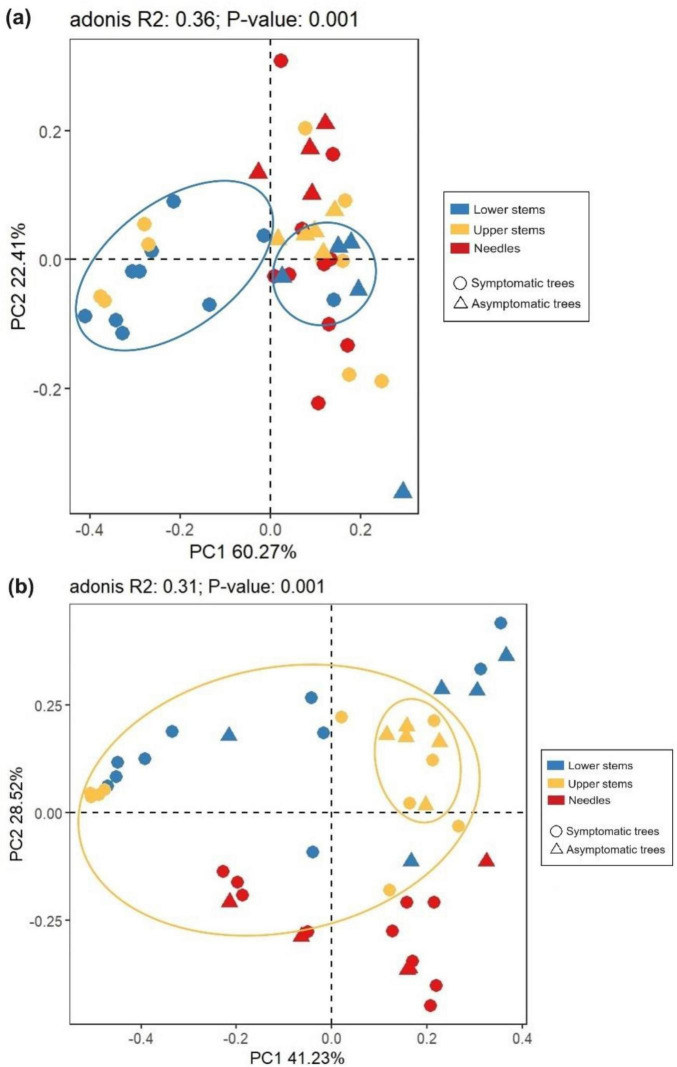
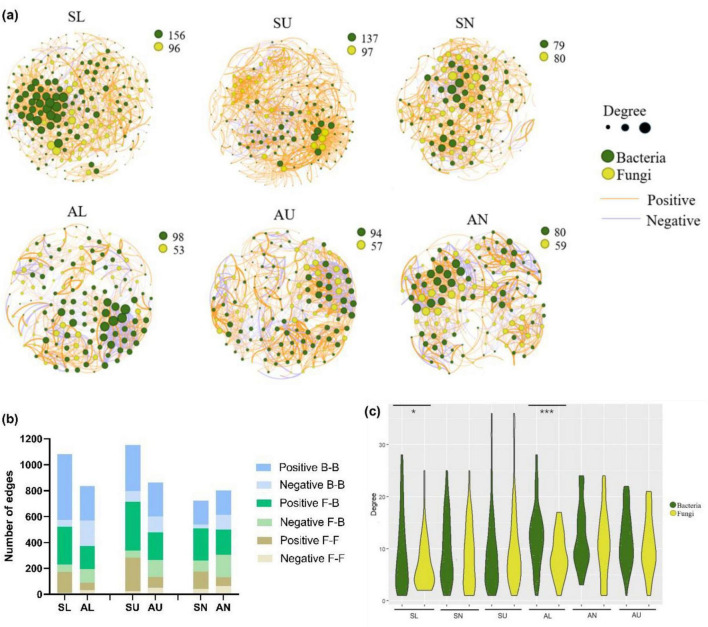
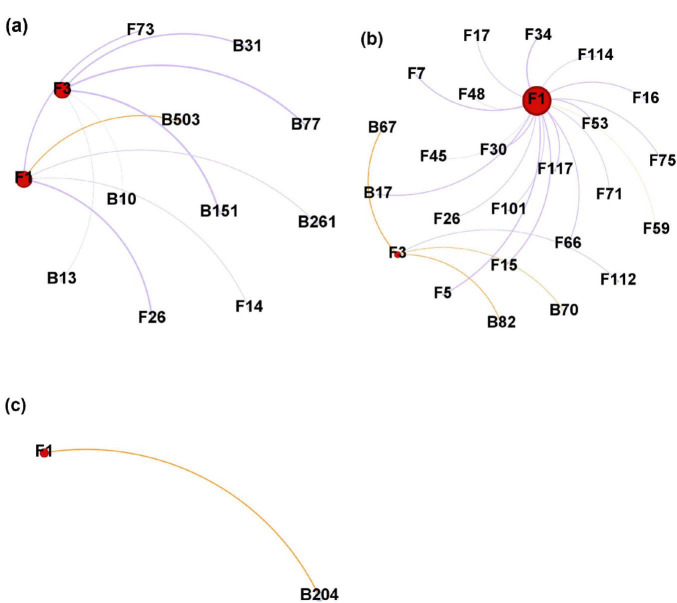
Heterobasidion annosum species complex has been regarded as the most destructive disease agent of conifer trees in boreal forests. Tree microbiome can regulate the plant-pathogen interactions by influencing both host resistance and pathogen virulence. Such information would help to improve the future health of forests and explore strategies to enhance ecosystem stability. In this study, using next-generation sequencing technology, we investigated the microbial community in different tree regions (needles, upper stem, and lower stem) of Norway spruce with and without wood decay symptoms. The primary purpose was to uncover signature characteristic microbiome harbored by asymptomatic trees compared to diseased trees. Additionally, the study was to explore the inter-kingdom and intra-kingdom interactions in microbiome (bacteria and fungi) of symptomatic versus asymptomatic trees. The results showed that in upper stem, species richness (Chao1) of fungi and bacteria were both higher in asymptomatic trees than symptomatic trees (P < 0.05). Compared to symptomatic trees, asymptomatic trees harbored a higher abundance of Actinobacteriota, bacterial genera of Methylocella, Conexibacter, Jatrophihabitans, and fungal genera of Mollisia. Fungal communities from the same anatomic region differed between the symptomatic and asymptomatic trees. Bacterial communities from the two stem regions were also distinct between the symptomatic and asymptomatic trees. The symptomatic trees possessed a less stable microbial network with more positive correlations compared to the asymptomatic trees. In the lower stem, at intra-kingdom level, the distribution of correlation numbers was more even in the bacterial network compared to the fungal network. In conclusion, the Heterobasidion attack decreased the microbial community species richness and shifted the community structure and functional structure to varying degrees. The microbial network was enlarged and became more unstable at both inter-kingdom and intra-kingdom level due to the Heterobasidion infection.

Keywords: Heterobasidion; microbial community diversity; microbial community structure; microbial interaction; network analysis.


Conflict of interest statement

The authors declare that the research was conducted in the absence of any commercial or financial relationships that could be construed as a potential conflict of interest.

Figures

FIGURE 1
FIGURE 1
The lower stems (stems at stump base height) (a), upper stems (stems at breast height) (c), needles (e) from symptomatic Norway spruce and the lower stems (b), upper stems (d), needles (f) from asymptomatic Norway spruce.
FIGURE 2
FIGURE 2
The alpha diversity bacterial community (a–c) and fungal community (d–f) in symptomatic and asymptomatic trees. Bacterial community species richness (Chao1) (a), diversity (Simpson’s diversity) (b), and evenness (Pielou’s evenness) (c) of community. Fungal community species richness (Chao1) (d), diversity (Simpson’s diversity) (e), and evenness (Pielou’s evenness) (f). Letters above the column represent the significant difference (P < 0.05) among groups.
FIGURE 3
FIGURE 3
The top 10 most abundant microbial taxa at phylum and genus level in the three regions from symptomatic and asymptomatic Picea abies tree. The bacterial phyla (a), bacterial genera (b), fungal phyla (c), and fungal genera (d). The first letter S and A stand for symptomatic trees and asymptomatic trees, respectively, while the second letter L, U, and N stand for lower stems (stems at stump base height), upper stems (stems at breast height), and needles.
FIGURE 4
FIGURE 4
Principal co-ordinates analysis (PCoA) illustrates microbial community structures. Bacterial community structures (a) and fungal community structures (b). The colorful eclipses represent the separation of microbial community from the same region between symptomatic and asymptomatic trees.
FIGURE 5
FIGURE 5
The relative abundance of the top 15 microbial trophic modes based on faprotax analysis for bacteria and FUNGuild analysis for fungi. Bacterial trophic modes (a) based on faprotax analysis, and the fungal trophic modes (b) based on FUNGuild analysis, respectively. For the group names, the first letter S and A stand for symptomatic trees and asymptomatic trees, respectively, while the second letter L, U, and N stand for lower stems (stems at stump base height), upper stems (stems at breast height), and needles.
FIGURE 6
FIGURE 6
Principal co-ordinates analysis (PCoA) illustrating the microbial community functional structures. Bacterial community functional structures (a) and fungal community functional structures (b). The colorful eclipses represent the separation of microbial community from the same region between symptomatic and asymptomatic trees.
FIGURE 7
FIGURE 7
Microbial network analysis in symptomatic trees and asymptomatic trees. Microbial co-occurring network in symptomatic trees and asymptomatic trees (a). Each node represents a bacterial/fungal ASV in the network. The degree stands for the connection amount with a particular node, which is indicated by the node size. The thickness of the edge between two nodes represents their correlation level. The number of positive and negative edges within inter-kingdom and intra-kingdom network (b). F-F, fungi to fungi; F-B, fungi to bacteria; B-B, bacteria to bacteria. The distribution of degrees within bacterial and fungal nodes (c). The symbols ‘*’ and ‘***’ represent a significance difference (P < 0.05) and a significance difference (P < 0.001) respectively.
FIGURE 8
FIGURE 8
Microbial network generated from Heterobasidion ASVs and their connected ASVs in lower stems (a), upper stems (b), and needles (c) from symptom trees. B, bacterial ASV; F, fungal ASV. Orange edges present positive correlations, purple edges represent negative correlations. F1 and F3 are H. parviporum ASVs.

Similar articles

References

    1. Addison S. L., Rúa M. A., Smaill S. J., Singh B. K., Wakelin S. A. (2024). Partner or perish: Tree microbiomes and climate change. Trends Plant Sci. 29 1029–1040. 10.1016/j.tplants.2024.03.008 - DOI - PubMed
    1. Ardanov P., Sessitsch A., Häggman H., Kozyrovska N., Pirttilä A. M. (2012). Methylobacterium-induced endophyte community changes correspond with protection of plants against pathogen attack. PLoS One 7:e46802. 10.1371/journal.pone.0046802 - DOI - PMC - PubMed
    1. Asiegbu F. O., Adomas A., Stenlid J. (2005). Conifer root and butt rot caused by Heterobasidion annosum (Fr.) Bref. s.l. Mol. Plant Pathol. 6 395–409. 10.1111/j.1364-3703.2005.00295.x - DOI - PubMed
    1. Astudillo-García C., Bell J. J., Webster N. S., Glasl B., Jompa J., Montoya J. M., et al. (2017). Evaluating the core microbiota in complex communities: A systematic investigation. Environ. Microbiol. 19 1450–1462. 10.1111/1462-2920.13647 - DOI - PubMed
    1. Baldrian P., López-Mondéjar R., Kohout P. (2023). Forest microbiome and global change. Nat. Rev. Microbiol. 21 487–501. 10.1038/s41579-023-00876-4 - DOI - PubMed

LinkOut - more resources