

Comparative evaluation of specimen type and processing conditions for studying oyster microbiomes
- PMID: 39845046
- PMCID: PMC11750828
- DOI: 10.3389/fmicb.2024.1504487
Comparative evaluation of specimen type and processing conditions for studying oyster microbiomes
Abstract
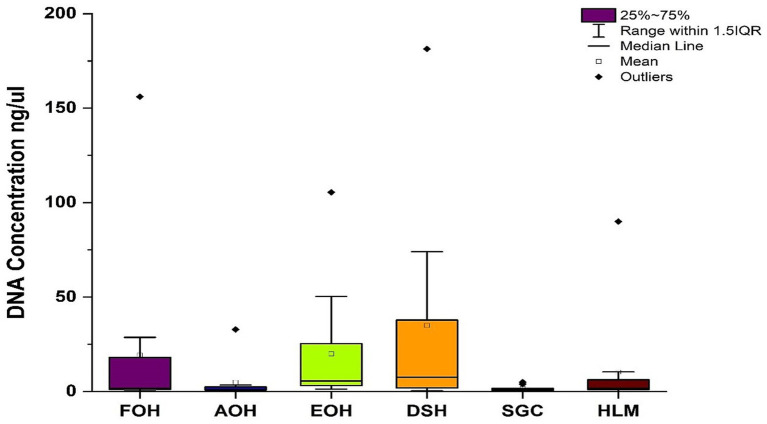
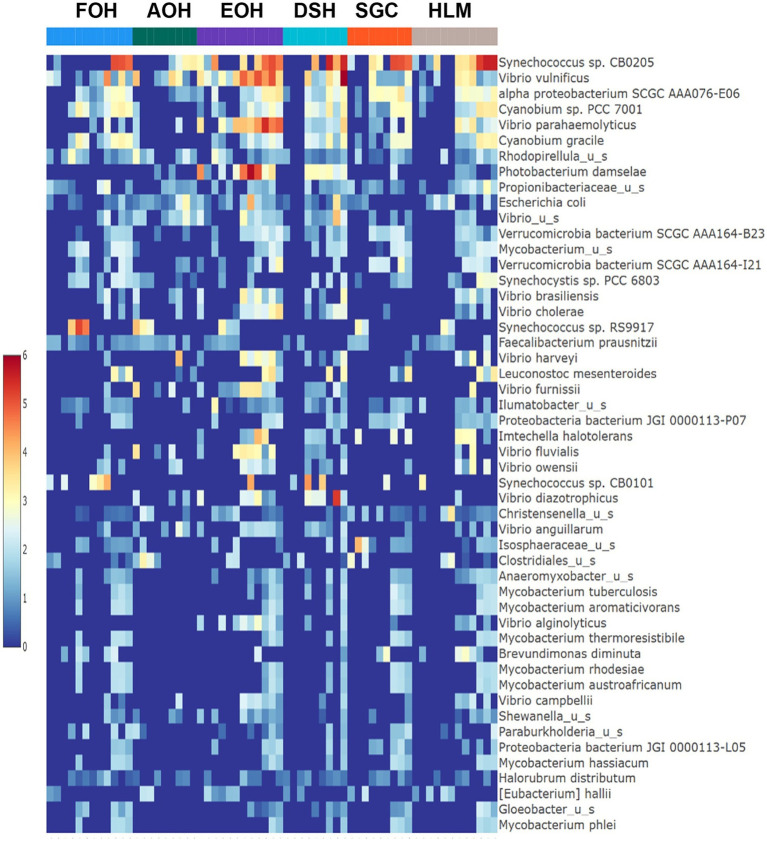
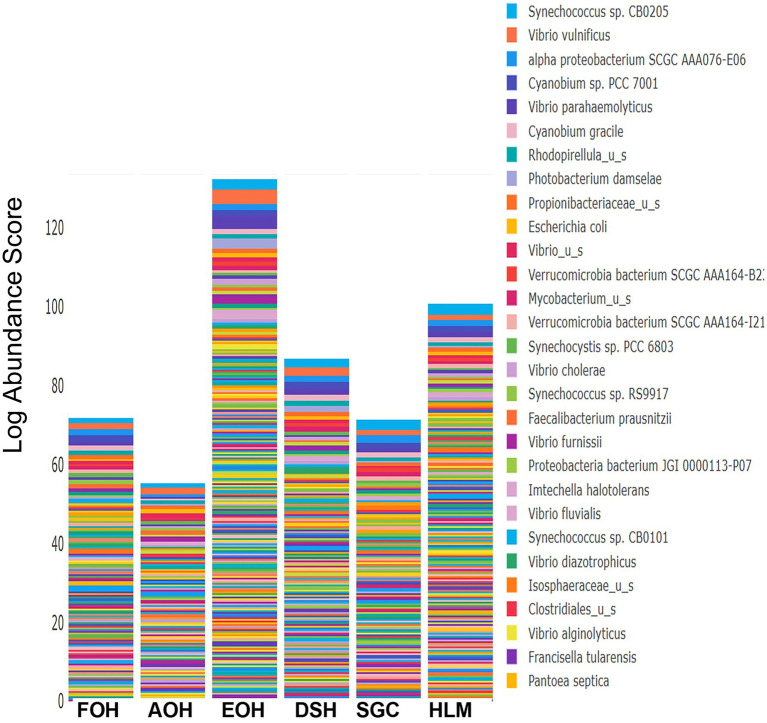
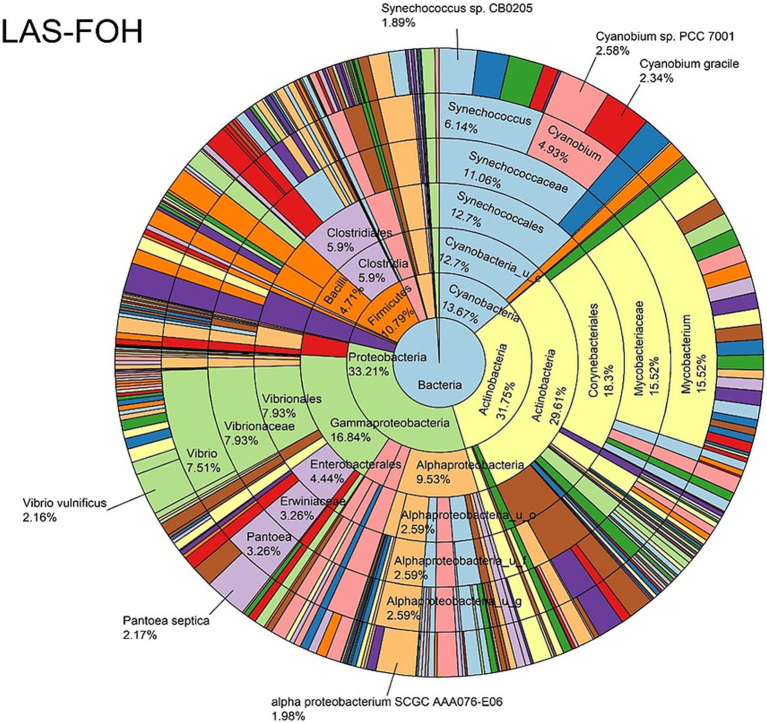
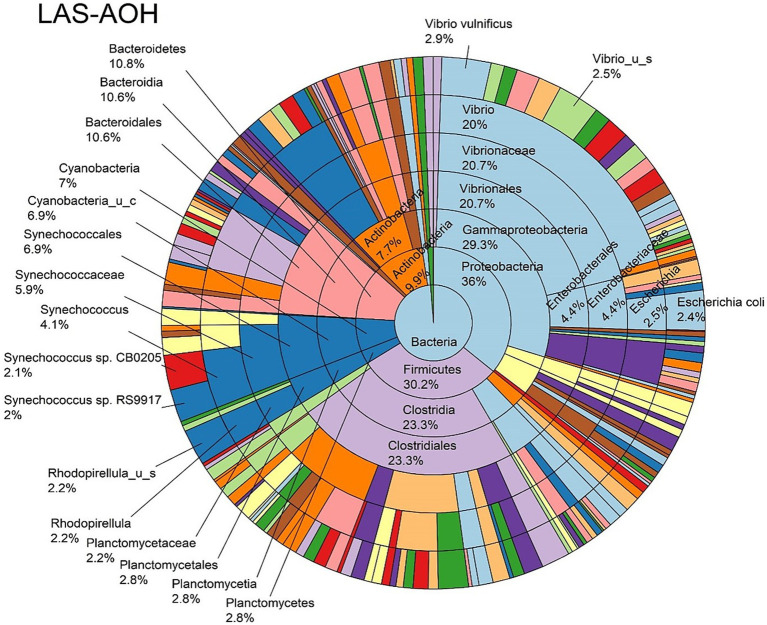
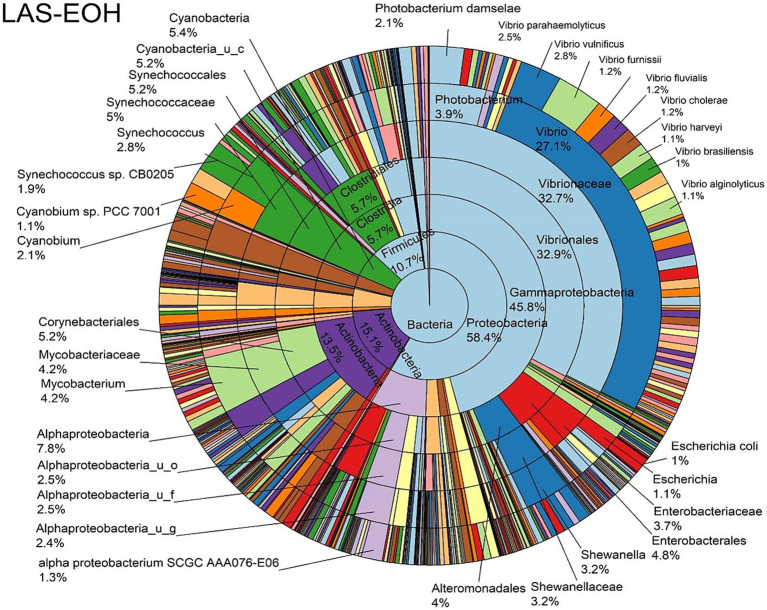
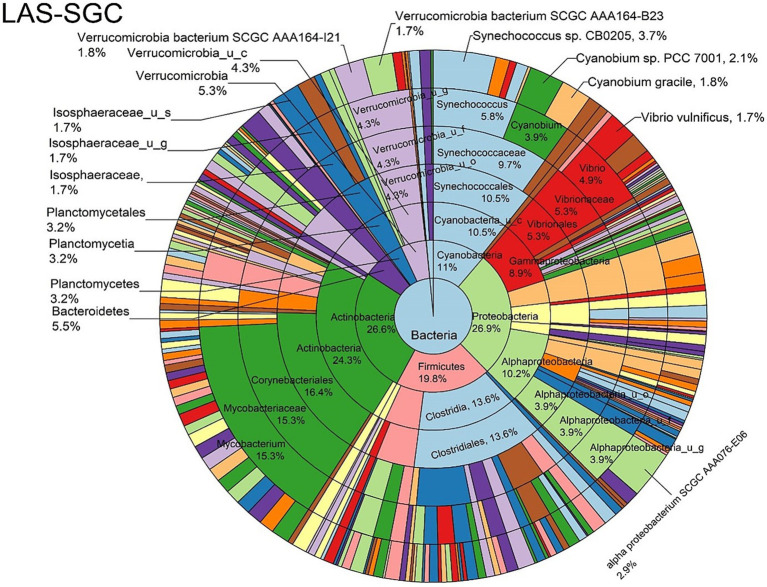
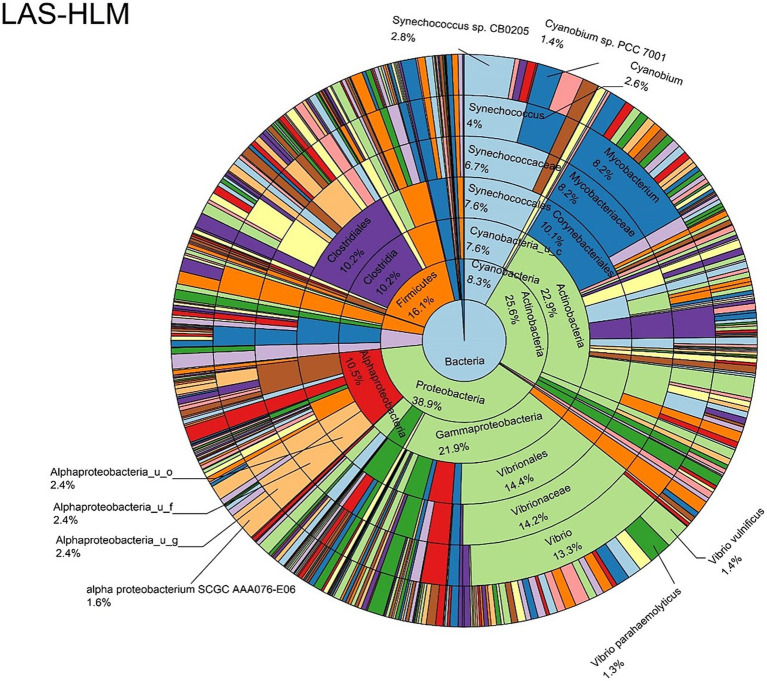
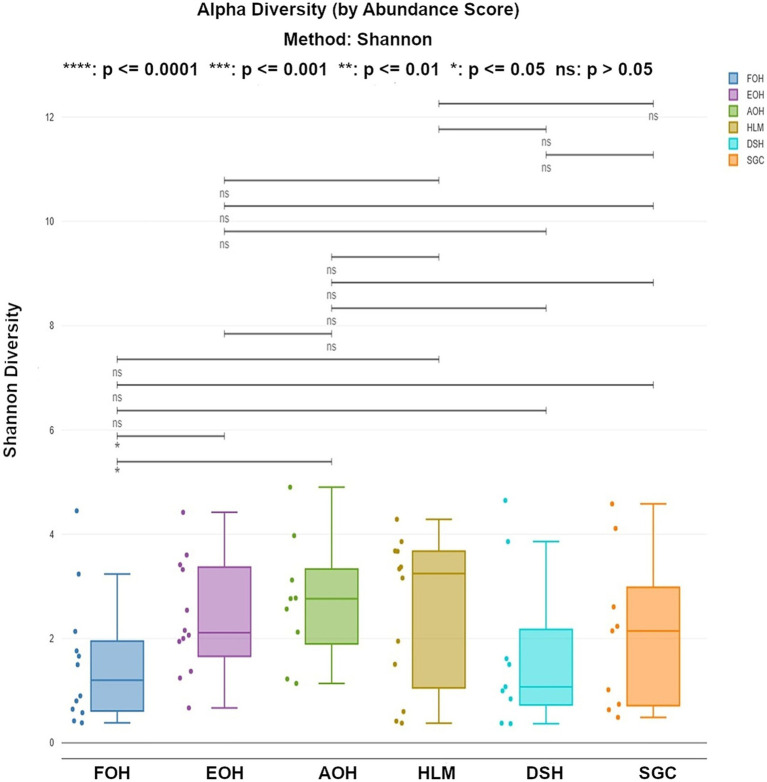
Metagenomic sequencing is increasingly being employed to understand the assemblage and dynamics of the oyster microbiome. Specimen collection and processing steps can impact the resultant microbiome composition and introduce bias. To investigate this systematically, a total of 54 farmed oysters were collected from Chesapeake Bay between May and September 2019. Six different specimen types and processing methods were evaluated for microbial community composition using shotgun metagenomics, namely fresh oyster homogenate (FOH), oyster homogenate after simulated temperature abuse (AOH), Luria broth-enriched oyster homogenate (EOH), dissected stomach homogenate (DSH), hemolymph (HLM), and stomach-gut content (SGC). In general, DSH, EOH, and FOH yielded the highest DNA concentration, while EOH had the highest microbial reads, followed by DSH, HLM, and FOH. HLM produced the highest bacterial species alpha diversity, followed by AOH, EOH, and SGC. Although alpha diversities did not differ significantly, beta-diversity measurements showed significant dissimilarity among methods (p < 0.05) indicating that the specimen types and processing steps do play an important role in representing the composition of the bacterial community. Bacterial species that had the highest log mean abundance included Cyanobium sp. PCC 7001 in FOH, Vibrio vulnificus in AOH, EOH, and DSH, and lastly Synechococcus sp. CB0205 in the DSH, HML, and SGC samples. EOH displayed higher bacterial hits, distinct microbial composition, and higher values of bacterial, phages, and antimicrobial resistance gene reads. Therefore, if studying the overall oyster microbial community, prioritizing optimum specimen collection and processing methods that align with the overall goal of the study is recommended.
Keywords: Crassostrea virginica; Vibrio spp.; mollusk; oyster microbiome; shotgun metagenomics.
Copyright © 2025 Almuhaideb, Hasan, Grim, Rashed and Parveen.
Conflict of interest statement
NH was employed by EzBiome Inc. The remaining authors declare that the research was conducted in the absence of any commercial or financial relationships that could be construed as a potential conflict of interest. The author(s) declared that they were an editorial board member of Frontiers, at the time of submission. This had no impact on the peer review process and the final decision.
Figures

Similar articles
-
Microbiome Analysis Reveals Diversity and Function of Mollicutes Associated with the Eastern Oyster, Crassostrea virginica.mSphere. 2021 May 12;6(3):e00227-21. doi: 10.1128/mSphere.00227-21. mSphere. 2021. PMID: 33980678 Free PMC article.
-
Gut Microbiomes of the Eastern Oyster (Crassostrea virginica) and the Blue Mussel (Mytilus edulis): Temporal Variation and the Influence of Marine Aggregate-Associated Microbial Communities.mSphere. 2019 Dec 11;4(6):e00730-19. doi: 10.1128/mSphere.00730-19. mSphere. 2019. PMID: 31826972 Free PMC article.
-
Analysis of stomach and gut microbiomes of the eastern oyster (Crassostrea virginica) from coastal Louisiana, USA.PLoS One. 2012;7(12):e51475. doi: 10.1371/journal.pone.0051475. Epub 2012 Dec 12. PLoS One. 2012. PMID: 23251548 Free PMC article.
-
Impact of Hurricane Irene on Vibrio vulnificus and Vibrio parahaemolyticus concentrations in surface water, sediment, and cultured oysters in the Chesapeake Bay, MD, USA.Front Microbiol. 2014 May 7;5:204. doi: 10.3389/fmicb.2014.00204. eCollection 2014. Front Microbiol. 2014. PMID: 24847319 Free PMC article.
-
High salinity relay as a post-harvest processing method for reducing Vibrio vulnificus levels in oysters (Crassostrea virginica).Int J Food Microbiol. 2018 Aug 20;279:70-79. doi: 10.1016/j.ijfoodmicro.2018.04.043. Epub 2018 May 2. Int J Food Microbiol. 2018. PMID: 29738928
Cited by
-
Hybridization capture sequencing for Vibrio spp. and associated virulence factors.mBio. 2025 Aug 13;16(8):e0051625. doi: 10.1128/mbio.00516-25. Epub 2025 Jun 25. mBio. 2025. PMID: 40558084 Free PMC article.
References
-
- Bloomfield S. J., Zomer A. L., O'grady J., Kay G. L., Wain J., Janecko N., et al. . (2023). Determination and quantification of microbial communities and antimicrobial resistance on food through host DNA-depleted metagenomics. Food Microbiol. 110:104162. doi: 10.1016/j.fm.2022.104162, PMID: - DOI - PubMed
LinkOut - more resources
Full Text Sources
Miscellaneous