. 2025 Jan 8:15:1499531.
doi: 10.3389/fmicb.2024.1499531. eCollection 2024.

Insights into microbial compositions of the respiratory tract of neonatal dairy calves in a longitudinal probiotic trial through 16S rRNA sequencing

Affiliations

Insights into microbial compositions of the respiratory tract of neonatal dairy calves in a longitudinal probiotic trial through 16S rRNA sequencing

Jia W Tan et al. Front Microbiol. .

Abstract

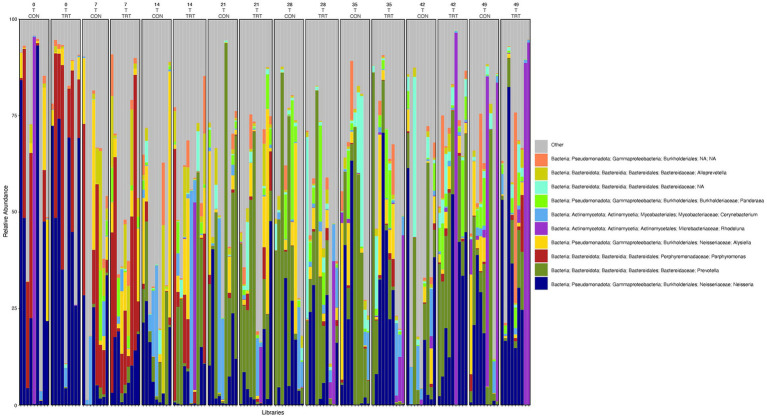
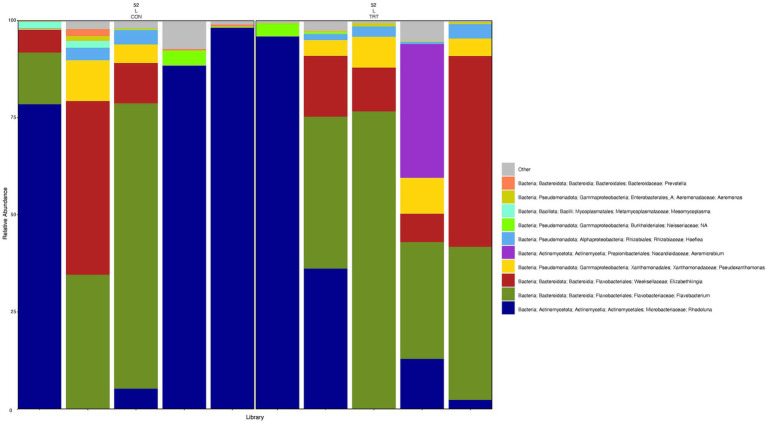
Introduction: Probiotics are a promising intervention for modulating the microbiome and the immune system, promoting health benefits in cattle. While studies have characterized the calf lung bacterial profile with and without oral probiotics, simultaneous probiotic effects on the bacterial populations of multiple sites along the respiratory tract have not been characterized.

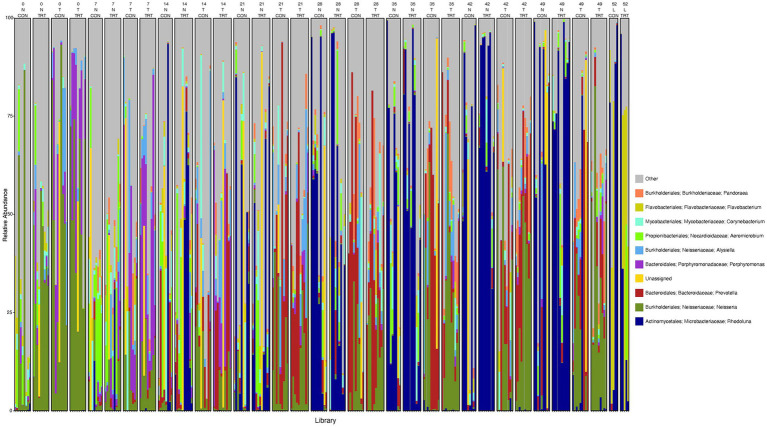
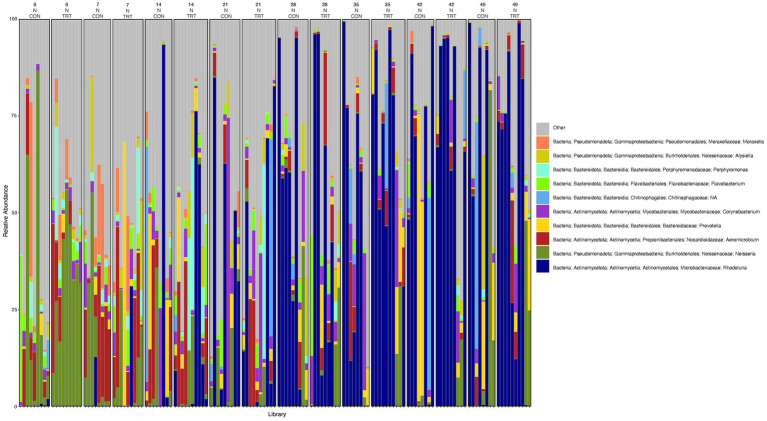
Methods: This study utilized the same pre-weaning diary calf group from our previous studies to characterize the bacterial populations present in the nostril and tonsil across control and treatment groups and nine sampling time points. DNA was exacted from the nostril and tonsil swabs and lung lavage fluids, and 16S ribosomal RNA gene hypervariable regions 1-3 were subsequently sequenced.

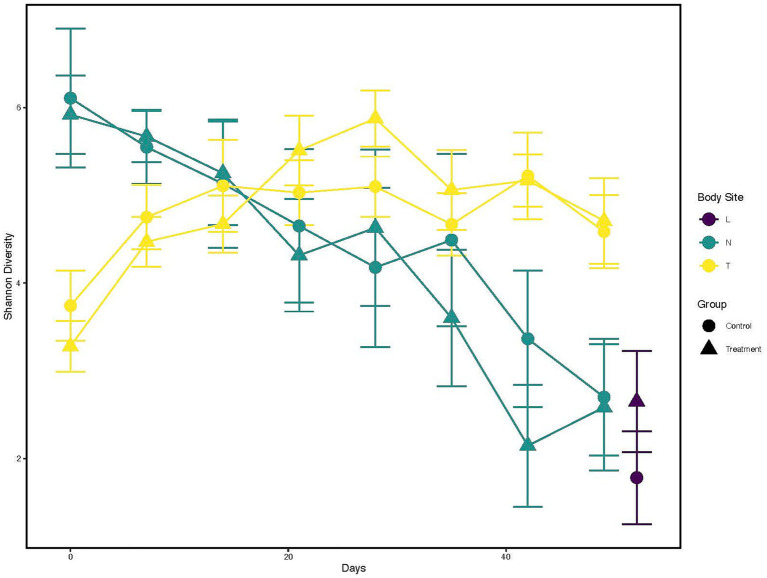
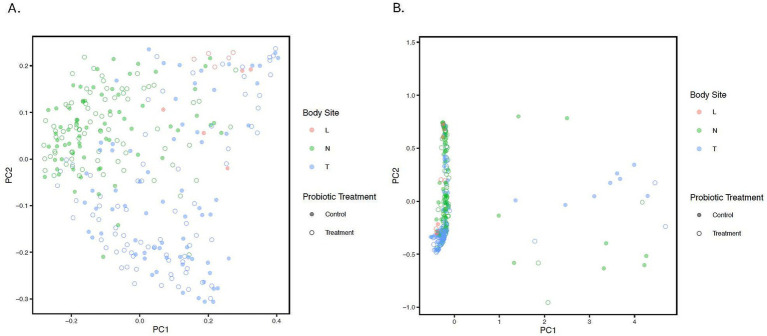
Results: Temporal variation in alpha bacterial diversity within the nostril, tonsil, and lung samples was observed, indicating distinct bacterial compositions among sampling time points. Oral probiotic treatment did not change alpha diversity in any respiratory tissue, however, spatial variability in bacterial taxa composition was observed among the three respiratory tract regions. While the majority of differentially abundant taxa in probiotic treated calves were unique to their anatomical location, a few were common to two anatomical locations and one Finegoldia amplicon sequence variant was differentially abundant in all three anatomical locations.

Discussion: In conclusion, these findings contribute to the understanding of the dynamic nature of bacterial diversity and the potential effects of probiotics within the bovine respiratory tract and provides insight for future studies of probiotics on animal health, disease prevention, and management.

Keywords: 16S rRNA; dairy cattle; microbiome; probiotic; respiratory.


Conflict of interest statement

KB was employed by Chr. Hansen, Inc. The remaining authors declare that the research was conducted in the absence of any commercial or financial relationships that could be construed as a potential conflict of interest. The author(s) declared that they were an editorial board member of Frontiers, at the time of submission. This had no impact on the peer review process and the final decision.

Figures

Figure 1
Figure 1
Alpha diversity changes over time and across different anatomical locations, and probiotic treatment groups. X-axis indicates the different time points a sample was collected. While the Y-axis represents Shannon Index value. The color of the line represents the anatomical locations; Yellow: Tonsil samples, Green: Nostril samples, Purple: Lung samples. The shapes represents whether a probiotic was fed; Dot: Control samples, Triangle: Probiotic treatment.
Figure 2
Figure 2
Principle Coordinate Analysis (PCoA) of unweighted (A) and weighted (B). UniFrac distances illustrating variation in microbial community structure associated with anatomical location and probiotic treatment groups. The PCoA demonstrates the clustering of 16S rRNA gene sequences from samples collected at different anatomical locations and by treatment. Different colors represent the location; Blue: Tonsil samples, Green: Nostril samples, Red: Lung samples. While solid circles represent the control samples, open unfilled circles represent treated samples from treated calves. Statistical difference was observed for lung-tonsil, tonsil-nostril, and nostril-lung samples (adjusted p < 0.001).
Figure 3
Figure 3
Relative abundance profile of top 10 microbial taxa at the genus level separated by sampling time point, anatomical locations, and probiotic treatment. The top 10 most abundant taxa with the relative abundance of ≥1% have been selected to show the distribution change over time (day 0, 7, 14, 21, 28, 35, 42 and 49 for nostril and tonsil and day 52 for lung), in different anatomical locations (N = nostril, T = tonsil, and L = lung), and on probiotic treatment (CON = control and TRT = treatment). Taxa that could not be classified to the genus level are grouped as unclassified with the remaining genera of low abundance identified as other. Classification in the legend is from order to genus.
Figure 4
Figure 4
Relative abundance profile of top 10 microbial taxa at the genus level for nostril separated by sampling time point and probiotic treatment. The top 10 most abundant taxa with the relative abundance of ≥1% have been selected to show the distribution change over time (day 0, 7, 14, 21, 28, 35, 42 and 49) and probiotic treatment (CON = control and TRT = treatment) at the nostril sampling site (N = nostril). Remaining genera of low abundance identified as other. Classification in the legend is from kingdom to genus.
Figure 5
Figure 5
Relative abundance profile of top 10 microbial taxa at the genus level for tonsil separated by sampling time point and probiotic treatment. The top 10 most abundant taxa with the relative abundance of ≥1% have been selected to show the distribution change over time (day 0, 7, 14, 21, 28, 35, 42 and 49) and probiotic treatment (CON = control and TRT = treatment) at the tonsil sampling site (T = tonsil). Remaining genera of low abundance identified as other. Classification in the legend is from kingdom to genus.
Figure 6
Figure 6
Relative abundance profile of top 10 microbial taxa at the genus level for lung separated by probiotic treatment. The top 10 most abundant taxa with the relative abundance of ≥1% have been selected to show the distribution change over probiotic treatment (CON = control and TRT = treatment) at the lung sampling site (L = lung). Remaining genera of low abundance identified as other. Classification in the legend is from kingdom to genus.

Similar articles

References

    1. Adjei-Fremah S., Ekwemalor K., Asiamah E. K., Ismail H., Ibrahim S., Worku M. (2018). Effect of probiotic supplementation on growth and global gene expression in dairy cows. J. Appl. Anim. Res. 46, 257–263. doi: 10.1080/09712119.2017.1292913 - DOI
    1. Alayande K. A., Aiyegoro O. A., Ateba C. N. (2020). Probiotics in animal husbandry: applicability and associated risk factors. Sustain. For. 12:1087. doi: 10.3390/su12031087 - DOI
    1. Al-Shawi S. G., Dang D. S., Yousif A. Y., Al-Younis Z. K., Najm T. A., Matarneh S. K. (2020). The potential use of probiotics to improve animal health, efficiency, and meat quality: a review. Agriculture 10:452. doi: 10.3390/agriculture10100452 - DOI
    1. Alugongo G. M., Xiao J. X., Chung Y. H., Dong S. Z., Li S. L., Yoon I., et al. . (2017). Effects of Saccharomyces cerevisiae fermentation products on dairy calves: performance and health. J. Dairy Sci. 100, 1189–1199. doi: 10.3168/jds.2016-11399, PMID: - DOI - PubMed
    1. Ban Y., Guan L. L. (2021). Implication and challenges of direct-fed microbial supplementation to improve ruminant production and health. J. Anim. Sci. Biotechnol. 12:109. doi: 10.1186/s40104-021-00630-x, PMID: - DOI - PMC - PubMed

LinkOut - more resources