. 2025 Jan 8:15:1504482.
doi: 10.3389/fpls.2024.1504482. eCollection 2024.

Synergistic interaction between wheat streak mosaic virus and Triticum mosaic virus modulates wheat transcriptome to favor disease severity

Affiliations

Synergistic interaction between wheat streak mosaic virus and Triticum mosaic virus modulates wheat transcriptome to favor disease severity

Haritha Nunna et al. Front Plant Sci. .

Abstract

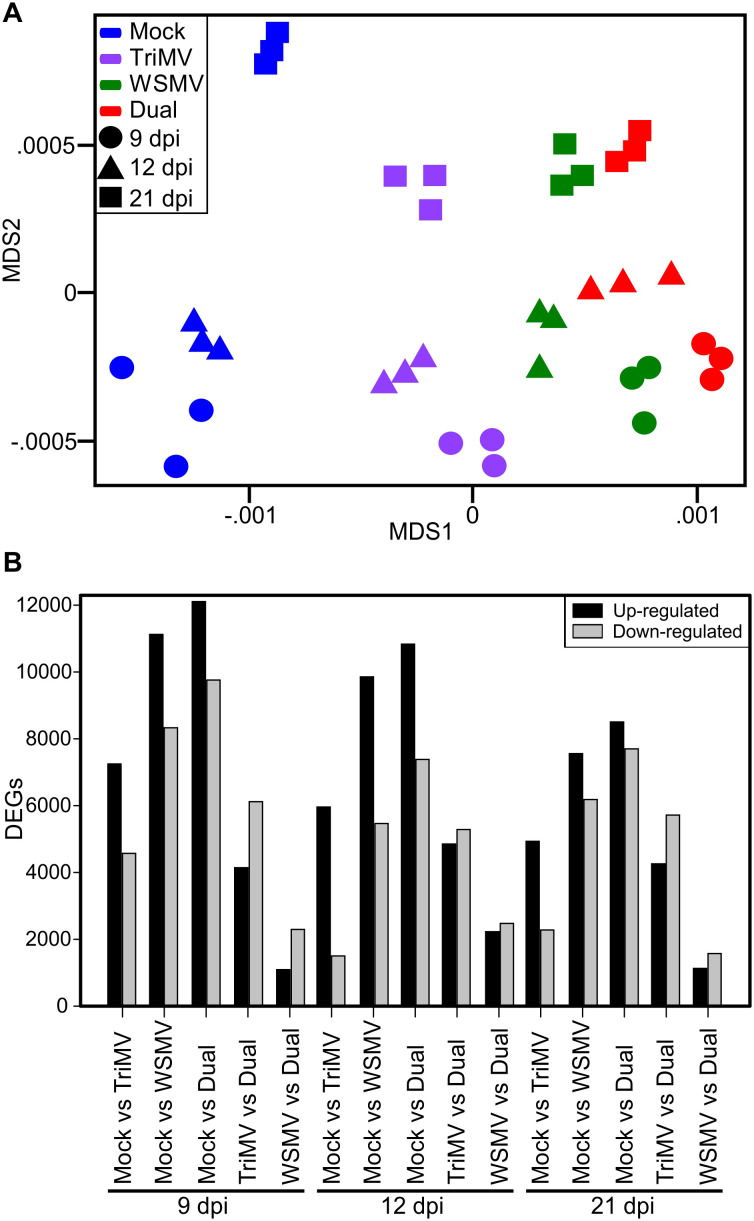
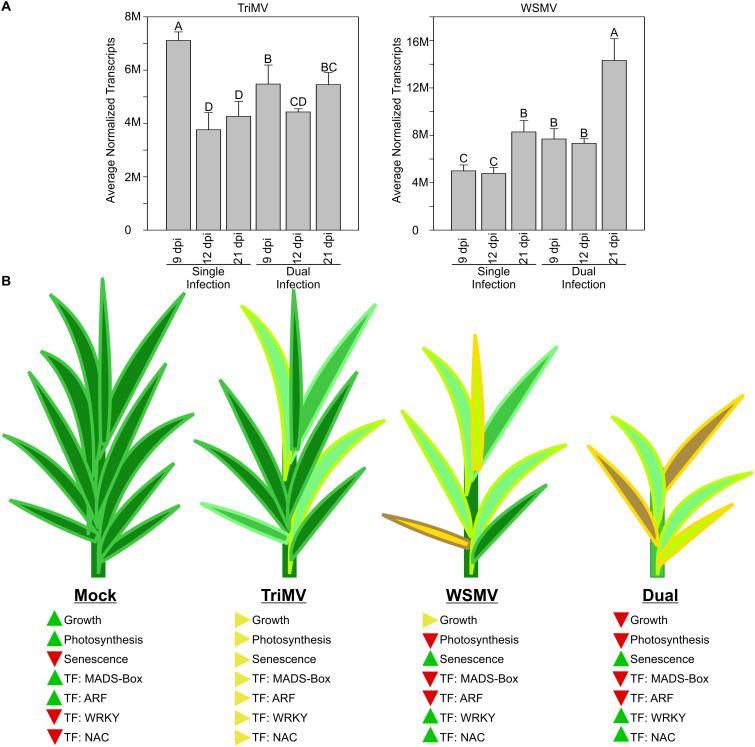
Wheat streak mosaic virus (WSMV; Tritimovirus tritici) and Triticum mosaic virus (TriMV; Poacevirus tritici), the type members of the genera Tritimovirus and Poacevirus, respectively, in the family Potyviridae, are economically important wheat viruses in the Great Plains region of the USA. Co-infection of wheat by WSMV and TriMV results in disease synergism. Wheat transcriptome from singly (WSMV or TriMV) and doubly (WSMV+TriMV) infected upper uninoculated leaves were analyzed by RNA-Seq at 9, 12, and 21 days postinoculation. A total of 31,754 differentially expressed wheat genes were identified among all comparisons. Weighted gene co-expression network analysis resulted in 11 co-expression modules that broadly indicated gene expression profiles attributable to control, single, and double infections. Gene ontology, protein domain and KEGG (Kyoto Encyclopedia of Genes and Genomes) pathway enrichment analysis revealed that genes specifically related to photosynthesis, growth, stress, senescence, and defense were differentially enriched. Analyses of transcription factor families indicated that genes encoding MADS-Box and ARFs were strongly enriched in control plants, moderately repressed in TriMV-infected plants, and more strongly repressed in WSMV- and doubly-infected plants, whereas genes encoding WRKYs and NACs were more enriched in WSMV or doubly infected plants. Synergistic interactions between WSMV and TriMV drastically enhanced disease phenotype compared to individual virus infections. The progression of disease phenotype was correlated to transcriptomic changes, indicating the strong disruption to plant metabolism and likely channeling of energy and metabolites for viral replication. There also appeared to be a connection between viral replication and plastid health, with stronger downregulation of genes needed for chloroplast functions and integrity and increased synergism between TriMV and WSMV. This study provides an overview of transcriptomic changes distinctly influenced by TriMV and WSMV either singly or in combination and provides a good correlation between specific transcription factors and genes associated with metabolism to observed phenotypic changes in plant growth and disease synergism.

Keywords: Triticum mosaic virus; disease synergism; synergistic interaction; transcription factors; transcriptome; wheat; wheat streak mosaic virus.


Conflict of interest statement

The authors declare that the research was conducted in the absence of any commercial or financial relationships that could be construed as a potential conflict of interest. The author(s) declared that they were an editorial board member of Frontiers, at the time of submission. This had no impact on the peer review process and the final decision.

Figures

Figure 1
Figure 1
Symptom phenotype of wheat streak mosaic virus (WSMV), Triticum mosaic virus (TriMV), and Dual infection (WSMV+TriMV) in wheat cv. Tomahawk. (A) Wheat leaves showing symptoms of TriMV, WSMV, or both at 21 dpi. (B) Wheat plants showing the stunting symptoms elicited by WSMV, TriMV, or WSMV+TriMV at 21 dpi.
Figure 2
Figure 2
Overview of differentially expressed genes (DEGs) in wheat infected by wheat streak mosaic virus (WSMV), Triticum mosaic virus (TriMV), or both at 9, 12, and 21 days postinoculation (dpi). (A) Multidimensional scaling (MDS) plot showing the clustering of biological replicates where the X-axis separates the samples by treatment and the Y-axis separates the samples by days postinoculation. Each time point is depicted by shapes. 9 dpi=Circle, 12 dpi=Triangle, and 21 dpi=Square. Treatment is depicted by colors: Mock=Blue, TriMV=Violet, WSMV=Green, and double infection=Red. (B) Bar chart depicting the number of differentially expressed genes (DEGs) in wheat transcriptome in response to WSMV, TriMV, and dual virus infection relative to buffer inoculated plants at 9, 12, and 21 dpi.
Figure 3
Figure 3
Weighted Gene Coexpression Network Analysis (WGCNA) of differentially expressed genes in wheat infected by wheat streak mosaic virus (WSMV), Triticum mosaic virus (TriMV), or both. M1 to M11 modules showed expression patterns of a set of genes expressed at 9, 12, and 21 days postinoculation (dpi). The dots represent the time points, and the colors represent the treatments. Blue=Mock, Violet=TriMV, Green=WSMV, and Red=Double infection.
Figure 4
Figure 4
Venn diagrams of up- and down-regulated wheat genes in response to wheat streak mosaic virus (WSMV), Triticum mosaic virus (TriMV), or dual infection at 9, 12, and 21 days postinoculation (dpi). Venn diagrams representing (A) up-regulated and (B) down-regulated genes in wheat infected by WSMV, TriMV, or dual viruses at 9, 12, and 21 dpi.
Figure 5
Figure 5
Gene ontology analysis of commonly expressed differentially expressed genes (DEGs) in wheat infected by wheat streak mosaic virus (WSMV), Triticum mosaic virus (TriMV), or dual viruses (WSMV+TriMV) at all time points. (A) Biological process (BP) enrichment of genes induced by infection; (B) Molecular function (MF) enrichment of genes induced by infection; (C) Biological process enrichment of genes suppressed by infection; and (D) Molecular function enrichment of genes suppressed by infection in all the treatments at all time points. The size of the dot represents the number of genes, and the color represents the enrichment.
Figure 6
Figure 6
Gene ontology analysis of differentially expressed genes (DEGs) unique to co-infected wheat by wheat streak mosaic virus and Triticum mosaic virus at two or more time points. (A) Venn diagrams representing the uniquely expressed genes in wheat infected by dual viruses at 9 days postinoculation (dpi), 12 dpi, and 21 dpi. Biological process (BP) enrichment of genes induced (B) and suppressed (C) by infection only in dual virus infection at two or more time points; (D) Molecular function (MF) enrichment of genes suppressed by only in dual virus infection at two or more time points. The size of the dot represents the number of genes, and the color represents the enrichment.
Figure 7
Figure 7
Heat maps representing transcription factor expression in wheat infected by wheat streak mosaic virus (WSMV), Triticum mosaic virus (TriMV), or dual viruses (WSMV+TriMV) at all time points. The responses of the genes were mapped from blue to white to yellow with a z-score of -2 to 0 to +2, where blue represents low expression, grey represents intermediate expression, and yellow represents high expression. (A) MADS-box transcription factors; (B) WRKY transcription factors; (C) NAC transcription factors; and (D) ARF transcription factors.
Figure 8
Figure 8
Summary of the number of viral transcripts and expression of wheat genes and transcription factors (TF) in Triticum mosaic virus (TriMV), wheat streak mosaic virus, or dual virus (WSMV+TriMV)-infected wheat. (A) The number of transcripts specific to TriMV and WSMV from single and dual infections in wheat at 9 days postinoculation (dpi), 12 dpi, and 21 dpi. (B) Cartoon diagrams of wheat plants of mock, TriMV, WSMV, and dual virus infection at 21 dpi. The levels of expressed genes related to growth, photosynthesis, and senescence, as well as TF of MADS-Box, ARF, WRKY, and NAC, are indicated with arrowheads. The levels of accumulation were indicated with upward (increase), side (no change), and downward (decrease) arrowheads.

Similar articles

Cited by

References

    1. Adhikari P. B., Kasahara R. D. (2024). An overview on MADS box members in plants: A meta-review. Int. J. Mol. Sci. 25, 8233. doi: 10.3390/ijms25158233 - DOI - PMC - PubMed
    1. Albrecht T., White S., Layton M., Stenglein M., Haley S., Nachappa P. (2022). Occurrence of wheat curl mite and mite-vectored viruses of wheat in colorado and insights into the wheat virome. Plant Dis. 106, 2678–2688. doi: 10.1094/PDIS-02-21-0352-RE - DOI - PubMed
    1. Bascom C. (2023). Hormone synergy: Auxin and jasmonate boost abscisic acid signaling via ARF10 and ARF16. Plant Cell 35, 971–972. doi: 10.1093/plcell/koad012 - DOI - PMC - PubMed
    1. Brakke M. K. (1987). “Virus disease in wheat,” in Wheat and wheat improvement, 2nd ed. Ed. Heyne E. G. (American Society of Agronomy, Crop Science Society of America, Soil Science Society of America, Madison, WI, U.S.A: ), 585–603.
    1. Burrows M., Franc G., Rush C., Blunt T., Ito D., Kinzer K., et al. . (2009). Occurrence of viruses in wheat in the Great Plains regio. Plant Health Prog. 10, 14. doi: 10.1094/PHP-2009-0706-01-RS - DOI

LinkOut - more resources