. 2025 Jan 22:8:0590.
doi: 10.34133/research.0590. eCollection 2025.

Altered Atlas of Exercise-Responsive MicroRNAs Revealing miR-29a-3p Attacks Armored and Cold Tumors and Boosts Anti-B7-H3 Therapy

Affiliations

Altered Atlas of Exercise-Responsive MicroRNAs Revealing miR-29a-3p Attacks Armored and Cold Tumors and Boosts Anti-B7-H3 Therapy

Jie Mei et al. Research (Wash D C). .

Abstract

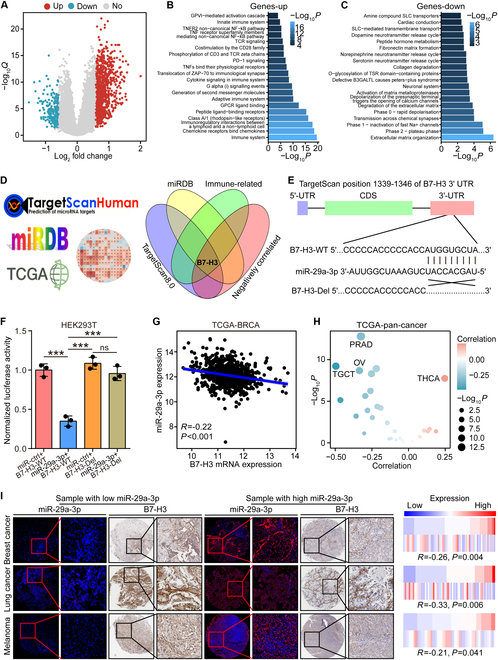
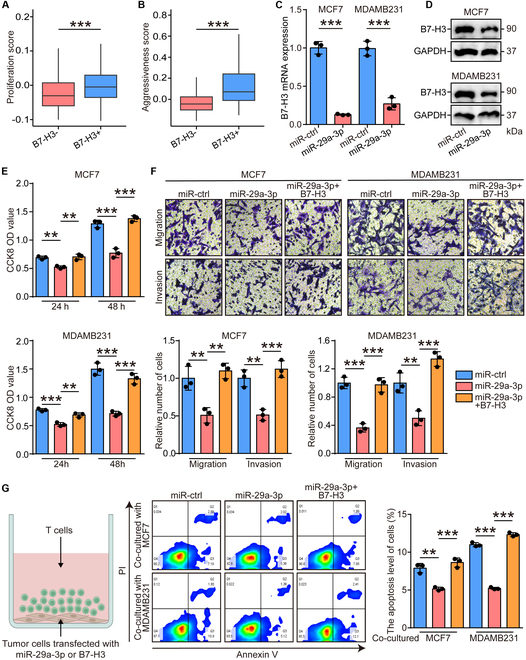
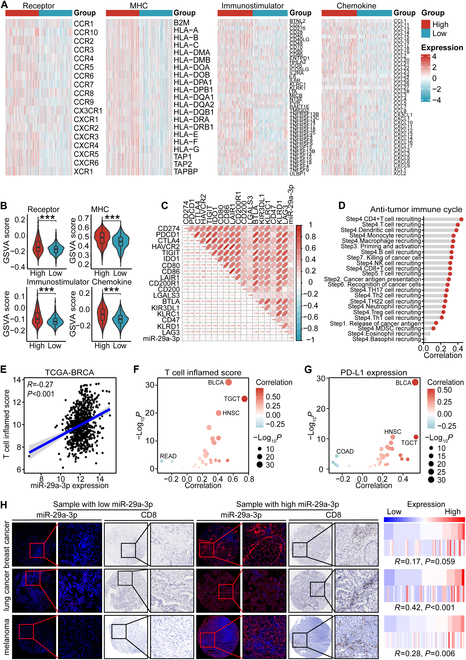
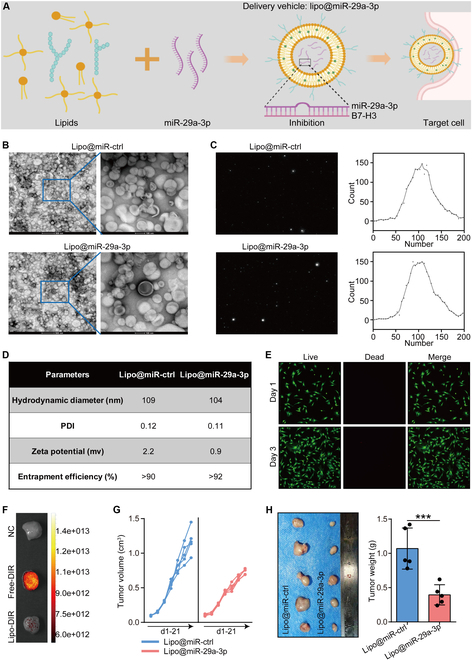
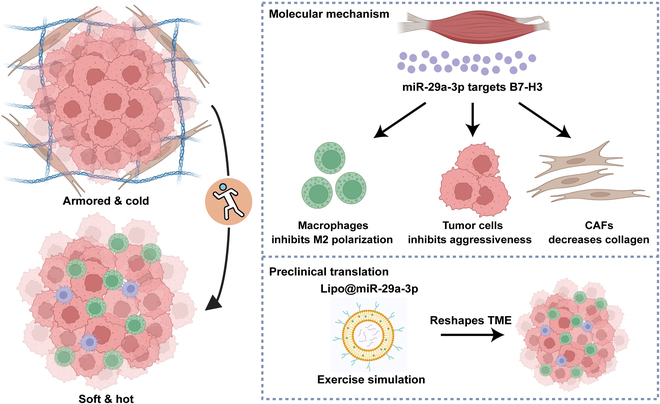
Increasing evidence has shown that physical exercise remarkably inhibits oncogenesis and progression of numerous cancers and exercise-responsive microRNAs (miRNAs) exert a marked role in exercise-mediated tumor suppression. In this research, expression and prognostic values of exercise-responsive miRNAs were examined in breast cancer (BRCA) and further pan-cancer types. In addition, multiple independent public and in-house cohorts, in vitro assays involving multiple, macrophages, fibroblasts, and tumor cells, and in vivo models were utilized to uncover the tumor-suppressive roles of miR-29a-3p in cancers. Here, we reported that miR-29a-3p was the exercise-responsive miRNA, which was lowly expressed in tumor tissues and associated with unfavorable prognosis in BRCA. Mechanistically, miR-29a-3p targeted macrophages, fibroblasts, and tumor cells to down-regulate B7 homolog 3 (B7-H3) expression. Single-cell RNA sequencing (scRNA-seq) and cytometry by time-of-flight (CyTOF) demonstrated that miR-29a-3p attacked the armored and cold tumors, thereby shaping an immuno-hot tumor microenvironment (TME). Translationally, liposomes were developed and loaded with miR-29a-3p (lipo@miR-29a-3p), and lipo@miR-29a-3p exhibited promising antitumor effects in a mouse model with great biocompatibility. In conclusion, we uncovered that miR-29a-3p is a critical exercise-responsive miRNA, which attacked armored and cold tumors by inhibiting B7-H3 expression. Thus, miR-29a-3p restoration could be an alternative strategy for antitumor therapy.


Conflict of interest statement

Competing interests: The authors declare that they have no competing interests.

Figures

Fig. 1.
Fig. 1.
Identification of miR-29a-3p as a clinically relevant exercise-responsive miRNA. (A) Landscape of exercise-responsive miRNAs. (B) Differential expression of exercise-responsive miRNAs between tumor and para-tumor tissues in BRCA. Significance was calculated with Student’s t test. (C) Prognostic value in predicting overall survival of exercise-responsive miRNAs in BRCA. Data were obtained from the Kaplan–Meier Plotter tool. Significance was calculated with the log-rank test. (D) Intersection of exercise-responsive miRNAs with differential expression and prognostic value. (E) Validation of miR-29a-3p expression in BRCA patients with and without exercise habit. Data are presented as mean ± SD. Significance was calculated with Mann–Whitney test. ***P < 0.001. (F) Representative images showing miR-29a-3p expression in tumor and para-tumor tissues, along with semiquantitative analysis. Total original magnification, 50× (left) and 200× (right). Data are presented as mean ± SD. Significance was calculated with Mann–Whitney test for (G). *P < 0.05. (G) Prognostic value in predicting overall survival of miR-29a-3p in the in-house BRCA cohort. Significance was calculated with the log-rank test.
Fig. 2.
Fig. 2.
B7-H3 was identified as the target gene of miR-29a-3p. (A) Volcano plot revealing DEGs between low- and high-miR-29a-3p expression with the criterion of FC ≥ 1.5 and adjusted P value ≤ 0.05. (B and C) Enrichment of up-regulated and down-regulated genes in the high-miR-29a-3p group using gene sets derived from the Reactome pathway database. (D) Intersection of predicted target genes, immune-related genes, and negatively correlated genes with miR-29a-3p. (E) Diagram revealing the miR-208a-5p binding site in B7-H3 3′-UTR. (F) Luciferase activity in HEK293T cells transfected with WT B7-H3 3′-UTR or mutant B7-H3 3′-UTR and miR-29a-3p or miR-ctrl. Data are presented as mean ± SD. Significance was calculated with one-way ANOVA with Tukey’s multiple-comparison test. ns, no significance. ***P < 0.001. (G and H) Correlation between miR-29a-3p and B7-H3 expression in BRCA and pan-cancer. Data were obtained from the TCGA database. Significance was calculated with Pearson test. (I) Representative images showing B7-H3 expression in tumor tissues with low- and high-miR-29a-3p expression in BRCA, lung cancer, and melanoma, along with semiquantitative analysis. Staining data of miR-29a-3p in lung cancer and melanoma from our previous study [42] were used as controls. Total original magnification, 50× (left) and 200× (right). Significance was calculated with Spearman test.
Fig. 3.
Fig. 3.
miR-29a-3p inhibited macrophage M2 polarization and collagen expression in CAFs. (A) Number of cell with B7-H3-postive in our published scRNA-seq dataset. (B) Expression of B7-H3 in MCF7, MDAMB231, THP1, CAF, and Jurkat T cells. (C) Level of M1 and M2 signatures in macrophages with B7-H3-positive and B7-H3-negative expression. Significance was calculated with Student’s t test. ***P < 0.001. (D and E) Down-regulated B7-H3 in both mRNA and protein levels after miR-29a-3p overexpression in THP1 cells. GAPDH was used as the loading control. Significance was calculated with Student’s t test for (D). ***P < 0.001. (F) The expression of M1 marker CD86 and M2 marker CD163 of control, miR-29a-3p-overexpressed, and B7-H3-rescured THP1 cells was examined at 24 h after transfection by flow cytometry. Data are presented as mean ± SD. Significance was calculated with Student’s t test. ***P < 0.001. (G) Level of activated signature in fibroblast with B7-H3-positive and B7-H3-negative expression. Significance was calculated with Student’s t test. ***P < 0.001. (H and I) Down-regulated B7-H3 in both mRNA and protein levels after miR-29a-3p overexpression in CAFs. GAPDH was used as the loading control. Significance was calculated with Student’s t test for (H). ***P < 0.001. (J) The expression of B7-H3, COL1A1, YAP, and phosphor-YAP in control, miR-29a-3p-overexpressed, and B7-H3-rescured CAFs was assessed by Western blotting assay. (K) Subcellular location of YAP1 in control, miR-29a-3p-overexpressed, and B7-H3-rescured CAFs was assessed by immunofluorescence assays. Data are presented as mean ± SD. Significance was calculated using the ANOVA with the Tukey’s multiple-comparison test. ***P < 0.001. (L) The expression of B7-H3 and COL1A1 in control, B7-H3-overexpressed, and Cyto-D-treated CAFs was assessed by Western blotting assay.
Fig. 4.
Fig. 4.
miR-29a-3p inhibited tumor cell aggressiveness and immune escape. (A and B) Level of proliferative and invasive signatures in tumor cells with B7-H3-positive and B7-H3-negative expression. Significance was calculated with Student’s t test. ***P < 0.001. (C and D) Down-regulated B7-H3 in both mRNA and protein levels after miR-29a-3p overexpression in MCF7 and MDAMB231 cells. GAPDH was used as the loading control. Significance was calculated with Student’s t test for (B). ***P < 0.001. (E) The proliferative capacity of control, miR-29a-3p-overexpressed, and B7-H3-rescured tumor cells was examined at 24 and 48 h after transfection by CCK-8 assay. Data are presented as mean ± SD. Significance was calculated with Student’s t test. **P < 0.01, ***P < 0.001. (F) The migratory and invasive capacities of control, miR-29a-3p-overexpressed, and B7-H3-rescured tumor cells were examined at 24 h after transfection by Boyden chamber assay. Total original magnification, 200×. Significance was calculated with Student’s t test. **P < 0.01, ***P < 0.001. (G) Apoptosis levels of T cells cocultured with control, miR-29a-3p-overexpressed, and B7-H3-rescured tumor cells were checked by flow cytometry. Data are presented as mean ± SD. Significance was calculated with Student’s t test. *P < 0.05, **P < 0.01, ***P < 0.001.
Fig. 5.
Fig. 5.
miR-29a-3p was associated with the inflamed TME. (A and B) Expression levels of immunomodulators (MHC, receptors, immunostimulators, and chemokines) in the high- and low-miR-29a-3p groups in BRCA. Data are presented as mean ± SD. Significance was calculated with Student’s t test. ***P < 0.001. (C) Correlations between miR-29a-3p and inhibitory immune checkpoints. The color and the values indicate the Pearson correlation coefficient. (D) Correlations between miR-29a-3p and the activities of the various steps of the cancer immunity cycle calculated by ssGSEA algorithm. Significance was calculated with Pearson test. (E and F) Correlation between miR-29a-3p and T cell inflamed score in BRCA and pan-cancer. Data were obtained from the TCGA database. Significance was calculated with Pearson test. (G) Correlation between miR-29a-3p and PD-L1 expression in pan-cancer. Data were obtained from the TCGA database. Significance was calculated with Pearson test. (H) Representative images showing CD8 expression in tumor tissues with low- and high-miR-29a-3p expression in BRCA, lung cancer, and melanoma, along with semiquantitative analysis. Staining data of miR-29a-3p and CD8 in lung cancer and melanoma from our previous study [42] were used as controls. Total original magnification, 50× (left) and 200× (right). Significance was calculated with Spearman test.
Fig. 6.
Fig. 6.
miR-29a-3p was associated with decreased collagen deposition. (A) Gene set enrichment analysis (GSEA) of collagen-related genes in BRCA samples with low- and high-miR-29a-3p expression. (B and C) Correlation between miR-29a-3p and collagen I expression in BRCA and pan-cancer. Collagen I expression was calculated from the mean values of COL1A1 and COL1A2. Data were obtained from the TCGA database. Significance was calculated with Spearman test. (D) Representative images showing collagen area determined by Masson staining in tumor tissues with low- and high-miR-29a-3p expression in BRCA, lung cancer, and melanoma, along with semiquantitative analysis. Staining data of miR-29a-3p and Masson in lung cancer and melanoma from our previous study [42] were used as controls. Total original magnification, 50× (left) and 200× (right). Significance was calculated with Pearson test. (E to G) Representative images uncovering miR-29a-3p expression in samples with different subtypes in BRCA, lung cancer, and melanoma and semiquantitative analysis. Data are presented as mean ± SD. Significance was calculated with Kruskal–Wallis with Dunn’s multiple-comparison test. *P < 0.05, **P < 0.01.
Fig. 7.
Fig. 7.
Characterization and antitumor effects of Lipo@miR-29a-3p. (A) Diagram of the synthesis steps of lipo@miR-29a-3p. (B) Transmission electron micrographs of lipo@miR-29a-3p and lipo@miR-ctrl. Scale bar, 500 or 100 nm. (C) NTA characterization plots of the liposome. The plot on the left shows the microscopic size of the liposome, and the plot on the right is a graph of the data from the particle size analysis. (D) Table of parameters for hydrodynamic diameter, polydispersity, zeta potential, and stability. (E) Cell viability of primary stem cells from the Achilles tendon of mice cocultured with the liposomes for 1 and 3 d was evaluated using the live/dead staining. Total original magnification, 200×. (F) Fluorescence tracing of free DIR dye or DIR-lipo@miR-29a-3p or NC-lipo@miR-29a-3p for tumors. (G) Effect of lipo@miR-29a-3p on tumor volume in BALB/C mice bearing 4T1 cells. (H) Effect of lipo@miR-29a-3p on tumor weight in BALB/C mice bearing 4T1 cells and quantitative analysis. Data are presented as mean ± SD. Significance was calculated with Student’s t test. ***P < 0.001.
Fig. 8.
Fig. 8.
Lipo@miR-29a-3p activated TME and boosted anti-B7-H3 therapy. (A) t-SNE visualization of single cells passed quality controls with different cell subtypes. (B) Heatmap for gene expression levels of top 10 cell type-specific genes. (C) Difference in cell subtypes in lipo@miR-ctrl- and lipo@miR-29a-3p-treated tumor tissues. (D) GESA of interferon-γ response in macrophages from tumor tissues with lipo@miR-ctrl and lipo@miR-29a-3p treatment. (E) Level of M1 and M2 signature in macrophages from tumor tissues with lipo@miR-ctrl and lipo@miR-29a-3p treatment. The scores were calculated by “AddModuleScore” function in the Seurat package. Significance was calculated with Student’s t test. *P < 0.05, ***P < 0.001. (F) CyTOF showed the typic trend of each cellular type in the TME. (G) The expression of M1 and M2 macrophage markers, CD8, and Ki-67 was examined by immunofluorescence assay. Total original magnification, 200×. (H) Effect of B7-H3 monoclonal antibody (mAb), lipo@miR-29a-3p, and combination on tumor volume in BALB/C mice bearing 4T1 cells. (I) Effect of B7-H3 mAb, lipo@miR-29a-3p, and combination on tumor weight in BALB/C mice bearing 4T1 cells and quantitative analysis. Data are presented as mean ± SD. Significance was calculated with one-way ANOVA with Tukey’s multiple-comparison test. *P < 0.05, **P < 0.01, ***P < 0.001.
Fig. 9.
Fig. 9.
Schematic overview of the current study. Exercise-responsive miR-29a-3p can make armored and cold tumors turn into soft and hot tumors, which greatly increases its therapeutic significance in clinical practice. Mechanistically, miR-29a-3p targets B7-H3 expression to inhibit tumor cell aggressiveness, macrophage M2 polarization, and collagen synthesis of fibroblasts. Translationally, a novel biomaterial lipo@miR-29a-3p was developed to simulate the benefits of exercise. Copyrighted from the BioRender platform.

Similar articles

Cited by

References

    1. Siegel RL, Giaquinto AN, Jemal A. Cancer statistics, 2024. CA Cancer J Clin. 2024;74(1):12–49. - PubMed
    1. Mendiratta G, Ke E, Aziz M, Liarakos D, Tong M, Stites EC. Cancer gene mutation frequencies for the U.S. population. Nat Commun. 2021;12(1):5961. - PMC - PubMed
    1. Rozhok AI, DeGregori J. The evolution of lifespan and age-dependent cancer risk. Trends Cancer. 2016;2(10):552–560. - PMC - PubMed
    1. Wu S, Zhu W, Thompson P, Hannun YA. Evaluating intrinsic and non-intrinsic cancer risk factors. Nat Commun. 2018;9(1):3490. - PMC - PubMed
    1. Lee IM, Shiroma EJ, Lobelo F, Puska P, Blair SN, Katzmarzyk PT, Lancet Physical Activity Series Working Group. Effect of physical inactivity on major non-communicable diseases worldwide: An analysis of burden of disease and life expectancy. Lancet. 2012;380(9838):219–229. - PMC - PubMed

LinkOut - more resources