. 2025 Jan 8:15:1521634.
doi: 10.3389/fimmu.2024.1521634. eCollection 2024.

Deciphering hub genes and immune landscapes related to neutrophil extracellular traps in rheumatoid arthritis: insights from integrated bioinformatics analyses and experiments

Affiliations

Deciphering hub genes and immune landscapes related to neutrophil extracellular traps in rheumatoid arthritis: insights from integrated bioinformatics analyses and experiments

Yang Li et al. Front Immunol. .

Abstract

Background: Rheumatoid arthritis (RA) is a chronic autoimmune disease characterized by synovial inflammation and progressive joint destruction. Neutrophil extracellular traps (NETs), a microreticular structure formed after neutrophil death, have recently been implicated in RA pathogenesis and pathological mechanisms. However, the underlying molecular mechanisms and key genes involved in NET formation in RA remain largely unknown.

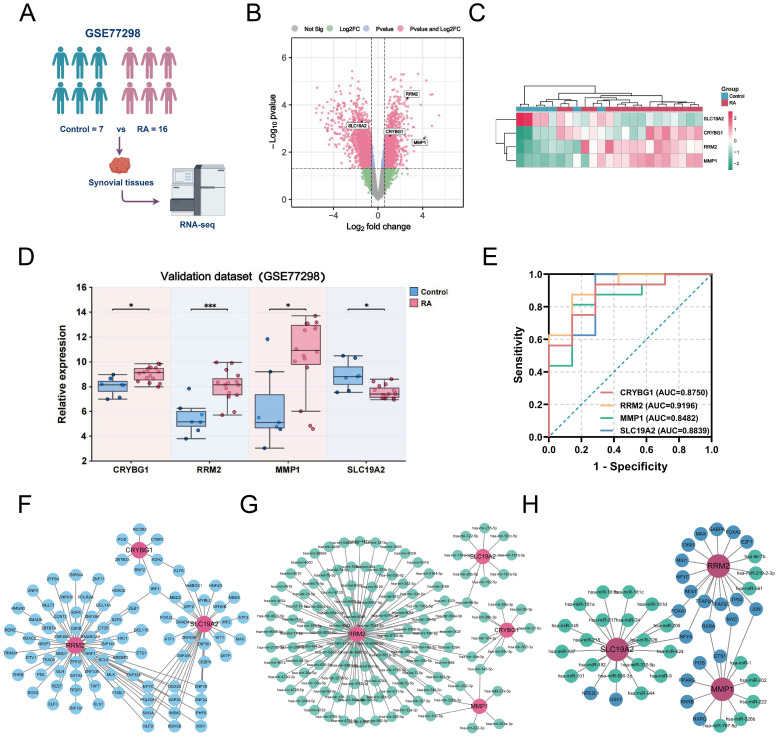
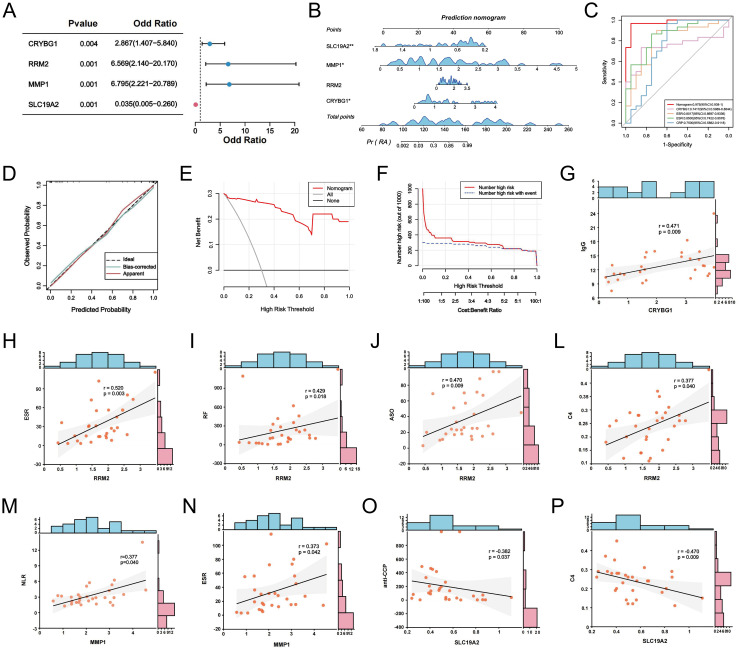
Methods: We obtained single-cell RNA sequencing data of synovial tissues from the Gene Expression Omnibus (GEO) database and performed cellular annotation and intercellular communication analyses. Subsequently, three microarray datasets were collected for a training cohort and correlated with a bulk RNA-seq dataset associated with NETs. Differentially expressed genes were identified, and weighted gene correlation network analysis was used to characterize gene association. Using three machine learning techniques, we identified the most important hub genes to develop and evaluate a nomogram diagnostic model. CIBERSORT was used to elucidate the relationship between hub genes and immune cells. An external validation dataset was used to verify pivotal gene expression and to construct co-regulatory networks using the NetworkAnalyst platform. We further investigated hub gene expression using immunohistochemistry (IHC) in an adjuvant-induced arthritis rat model and real-time quantitative polymerase chain reaction (RT-qPCR) in a clinical cohort.

Results: Seven cellular subpopulations were identified through downscaling and clustering, with neutrophils likely the most crucial cell clusters in RA. Intercellular communication analysis highlighted the network between neutrophils and fibroblasts. In this context, 4 key hub genes (CRYBG1, RMM2, MMP1, and SLC19A2) associated with NETs were identified. A nomogram model with a diagnostic value was developed and evaluated. Immune cell infiltration analysis indicated associations between the hub genes and the immune landscape in NETs and RA. IHC and RT-qPCR findings showed high expression of CRYBG1, RMM2, and MMP1 in synovial and neutrophilic cells, with lower expression of SLC19A2. Correlation analysis further emphasized close associations between hub genes and laboratory markers in patients with RA.

Conclusion: This study first elucidated neutrophil heterogeneity in the RA synovial microenvironment and mechanisms of communication with fibroblasts. CRYBG1, RMM2, MMP1, and SLC19A2 were identified and validated as potential NET-associated biomarkers, offering insights for diagnostic tools and immunotherapeutic strategies in RA.

Keywords: inflammation; neutrophil extracellular traps; neutrophils; rheumatoid arthritis; synovial microenvironment; systems bioinformatics.


Conflict of interest statement

The authors declare that the research was conducted in the absence of any commercial or financial relationships that could be construed as a potential conflict of interest.

Figures

Figure 1
Figure 1
The flowchart depicting the investigation procedure of this study.
Figure 2
Figure 2
Single-cell landscape of the RA synovial microenvironment. (A) Flowchart of single-cell analysis. (B) t-SNE plot showing 18 clusters (0-17) identified from the GSE192504 dataset by dimensionality reduction clustering analysis. (C) Clusters were annotated into 7 cell types based on SingleR and literature. (D) Dot plots of marker gene expression levels annotated by different cell types. (E) Differences in cell distribution and expression between RA and healthy controls. (F) Stacked plot of the proportion of abundance of each cell type in synovial tissues of RA and healthy controls.
Figure 3
Figure 3
Kinetic analysis of intercellular communication in the RA synovial microenvironment. (A) Circle plots plotting the weights of interactions between the seven major cellular subclusters in the RA group, with fibroblasts and neutrophils shown in detail. (B-D) Graphical representation of the three major signaling pathways (Collagen signaling pathway, MIF signaling pathway, and Fn1 signaling pathway) by which neutrophils and fibroblasts interact, including chordal diagrams (left) and circle diagrams (right) demonstrating the process of cellular interactions. (E) Dot plots highlighting ligand-receptor pairs between neutrophils and other cells in the RA microenvironment, with the size of the dots representing the p-value of pathway involvement and colored by the probability of communication. (F) A graphical representation of the CXCL signaling pathway, consisting of chord and circle diagrams demonstrating the process of cellular interactions, an exploratory heatmap highlighting the strength of interactions, and a violin plot exploring the level of gene expression.
Figure 4
Figure 4
Differential gene identification and biological characterization of RA. (A) Schematic of batch RNA sequencing analysis. (B) UMAP-based analysis showing the distribution of sample expression before and after de-batch effects for GSE55235, GSE55457, and GSE206848. (C) Volcano plot showing the differentially expressed genes (|logFC| > 1.5 and P < 0.05) between RA and control in the training cohort merged by the three data sets. (D) Heatmap showing the top 50 up-/down-regulated genes in the differential expression analysis between the two samples. (E) Bar graph demonstrating the results of GO function analysis of RA key genes. (F) Bubble graph showing the KEGG analysis results of RA key genes. GSEA results of GO enrichment (G) and KEGG enrichment (H) based on gene expression levels.
Figure 5
Figure 5
Construction of WGCNA and identification of key modular genes in RA. (A) Estimation of scale-independent indices for different soft-threshold powers. (B) Estimation of average connectivity for different soft threshold powers. (C) Gene hierarchy clustering dendrogram in which different modules are indicated by different colors. (D) Heatmap for inter-module correlation analysis. (E) Relationships between module-characterized genes and clinical traits in the RA group and normal control group, with numbers in the modules representing correlation coefficients and p-values. Further screening of candidate hub genes within modules (with GS > 0.1 and MM > 0.8 as thresholds) was visualized by Cytoscape. Scatter plots were generated to show the association between GS and MM within the turquoise module (F), blue module (G), and green module (H), respectively.
Figure 6
Figure 6
Identification of NETs-related core hub genes in RA. (A) Volcano plots demonstrating differential genes between NETs-stimulated and unstimulated FLS in the GSE150466 dataset (|logFC| > 1.5 and P < 0.05). (B) UpSet crossover plot showing the distribution of overlapping genes between RA-DEGs, co-expressed key module genes, and NETs-DEGs. (C) Heatmap showing the expression differences of the 36 crossovers characterized genes in the tested cohort. (D) Circle correlation connectivity plot of co-expression among the 36 characterized genes. (E) Circle plot showing the results of GO enrichment analysis of 36 feature genes, including 12 BP terms, 5 CC terms and 7 MF terms. (F) Sankey bubble plot showing the top 10 most significant KEGG enrichment results. (G) t-SNE plot showing the distribution of 36 characterized genes in different cells at the single-cell level. (H) Circle plot of 36 characterized genes localized on chromosomes. (I) Eight candidate hub genes were obtained based on LASSO regression and 10-fold cross-validation. (J) Generation of coefficient profiles for log(lambda) sequences in the LASSO model, the vertical dashed line is the optimal log(λ) value. (K) Establishment of 11 potential hub genes after identification by SVM-RFE algorithm. (L) Random forest tree plot depicting the error rate versus the number of classification trees, where red, green, and black points represent RA samples, normal group samples, and all samples, respectively. (M) Bar chart showing the top 23 genes ranked based on importance scores. (N) Venn diagram showing the identification of four final NETs-related core genes by the three algorithms described above.
Figure 7
Figure 7
Construction of NETs-associated nomogram with immune infiltration characteristics. (A) Comparison of the expression levels of the four NETs-related hub genes between the control and RA groups in the training cohort. (B) Disease prediction score modeling based on four NETs-related hub genes for diagnosis of RA. (C) ROC curves of the nomogram model and the diagnostic performance of the four NETs-related hub genes within the model. (D) Calibration curves predicted by the nomogram model. (E) DCA curves are predicted by the nomogram model. (F) Clinical impact curves of the nomogram model. (G) The proportion of various immune cell infiltrates in the training cohort analyzed using the CIBERSORT algorithm. (H) Comparison of the levels of various immune cell infiltrations between the RA group and the control group in the training cohort. (I) Correlation heatmaps demonstrating the correlation between NETs-related hub genes and various infiltrating immune cells and between immune cells. Data are expressed as mean ± standard deviation. *P < 0.05, **P < 0.01, ***P < 0.001, ****P < 0.0001.
Figure 8
Figure 8
External validation of NETs-related hub genes and construction of target gene networks. (A) Schematic diagram of the analysis of the external validation dataset GSE77298. (B) Volcano plot showing the differentially expressed genes (|logFC| > 1.5 and P < 0.05) in the externally validated dataset GSE77298, in which 4 hub genes were labeled. (C) Heatmap showing the expression differences of the four hub genes between the two groups in the GSE77298 dataset. (D) Comparison of the expression levels of the 4 NETs-associated hub genes between the control and RA groups in GSE77298. (E) ROC curves highlighting the diagnostic performance of the 4 NETs-related hub genes in GSE77298. (F) Construction of TF-Gene interaction network. (G) Construction of Gene-miRNA regulatory network. (H) Construction of TF-Gene-miRNA co-regulatory network. Data are expressed as mean ± standard deviation. *P < 0.05, ***P < 0.001.
Figure 9
Figure 9
Validation of pivotal gene expression in the mouse model. (A) H&E-stained images of synovial tissues of a mouse model. Expression of CRYBG1 (B), RRM2 (C), MMP1 (D) and SLC19A2 (E) proteins in synovial tissues of mouse knee joints was detected by IHC (standard bar = 50 μm). Data are expressed as mean ± standard deviation. ***P < 0.001, ****P < 0.0001.
Figure 10
Figure 10
Validation of NETs formation and hub gene expression in a clinical cohort. (A, B) Immunofluorescence microscopy examination revealed the presence of NETs in RA, defined as MPO (green) and NE (red) (standard bar = 50 μm). RT-qPCR was applied to detect the expression levels of hub genes CRYBG1 (C), RRM2 (D), MMP1 (E) and SLC19A2 (F) in neutrophils. ***P < 0.001, ****P < 0.0001.
Figure 11
Figure 11
NETs-related hub genes are clinically relevant. (A) Forest plot of logistic regression analysis of hub genes in RA prediction. (B) The clinical RA prediction nomogram model is based on 4 NETs-related hub genes. (C) ROC curves of the nomogram model and the characteristic variables within the model. Calibration curves (D), DCA (E) and CIC (F) were predicted by the nomogram model. (G-P) Correlation analysis between CRYBG1, RRM2, MMP1, and SLC19A2 and laboratory markers in RA patients. *P < 0.05, **P < 0.01.

Similar articles

Cited by

References

    1. Di Matteo A, Bathon JM, Emery P. Rheumatoid arthritis. Lancet. (2023) 402:2019–33. doi: 10.1016/S0140-6736(23)01525-8 - DOI - PubMed
    1. Figus FA, Piga M, Azzolin I, McConnell R, Iagnocco A. Rheumatoid arthritis: extra-articular manifestations and comorbidities. Autoimmun Rev. (2021) 20:102776. doi: 10.1016/j.autrev.2021.102776 - DOI - PubMed
    1. Yip K, Navarro-Millán I. Racial, ethnic, and healthcare disparities in rheumatoid arthritis. Curr Opin Rheumatol. (2021) 33:117–21. doi: 10.1097/BOR.0000000000000782 - DOI - PMC - PubMed
    1. Aletaha D, Smolen JS. Diagnosis and management of rheumatoid arthritis: a review. JAMA. (2018) 320:1360–72. doi: 10.1001/jama.2018.13103 - DOI - PubMed
    1. Coutant F, Miossec P. Evolving concepts of the pathogenesis of rheumatoid arthritis with focus on the early and late stages. Curr Opin Rheumatol. (2020) 32:57–63. doi: 10.1097/BOR.0000000000000664 - DOI - PubMed

LinkOut - more resources