. 2025 Jan 7:15:1512491.
doi: 10.3389/fimmu.2024.1512491. eCollection 2024.

Impact of glioma metabolism-related gene ALPK1 on tumor immune heterogeneity and the regulation of the TGF-β pathway

Affiliations

Impact of glioma metabolism-related gene ALPK1 on tumor immune heterogeneity and the regulation of the TGF-β pathway

YaoFeng Hu et al. Front Immunol. .

Abstract

Background: Recent years have seen persistently poor prognoses for glioma patients. Therefore, exploring the molecular subtyping of gliomas, identifying novel prognostic biomarkers, and understanding the characteristics of their immune microenvironments are crucial for improving treatment strategies and patient outcomes.

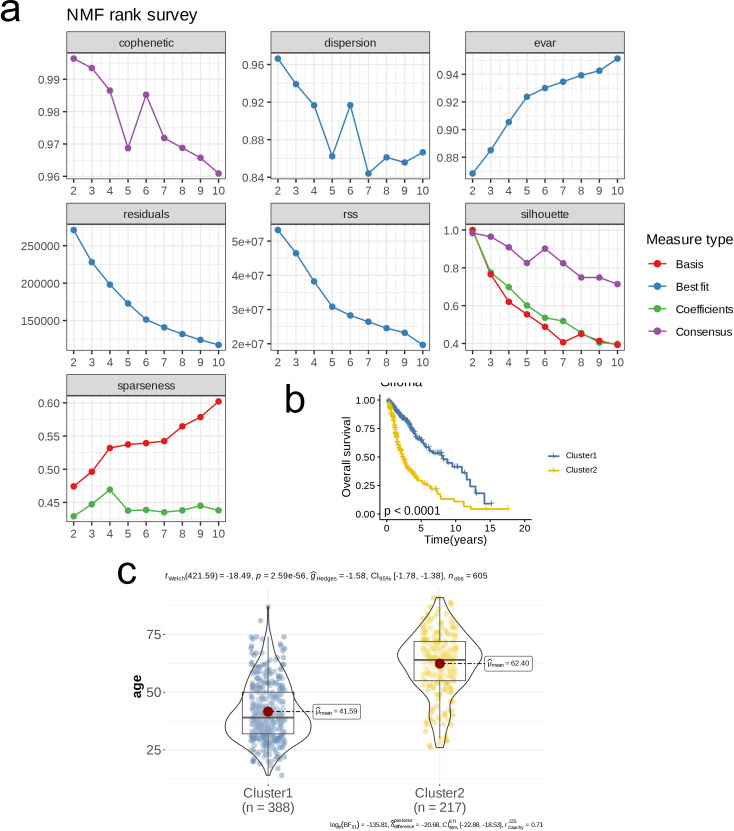
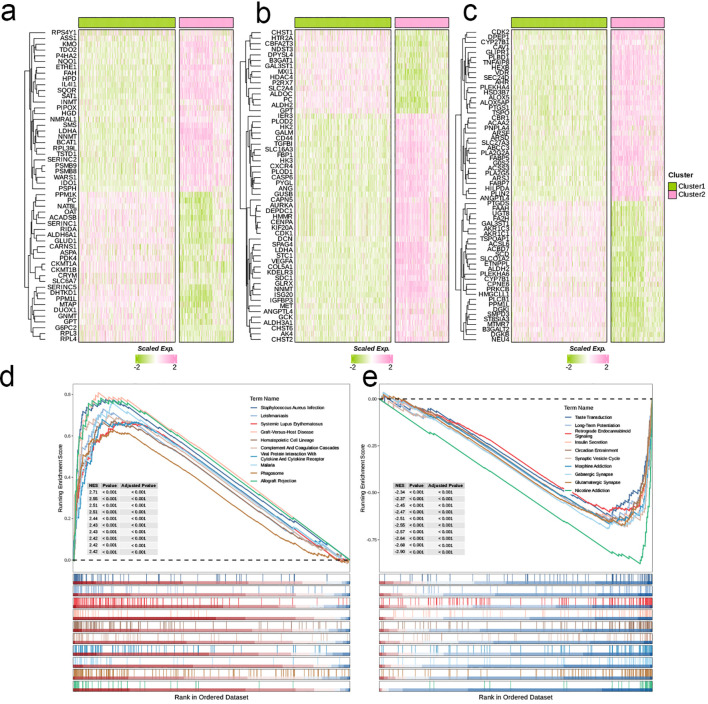
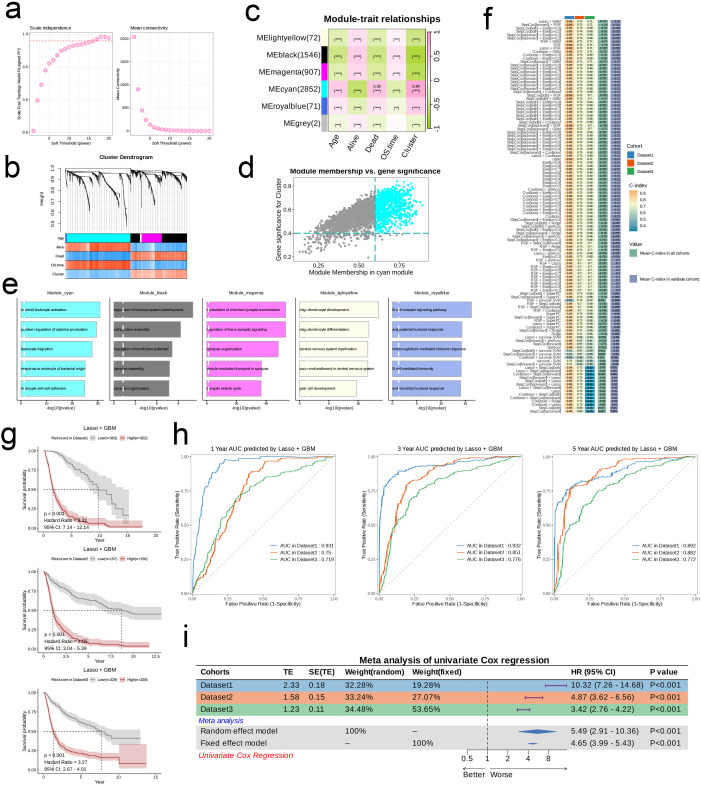
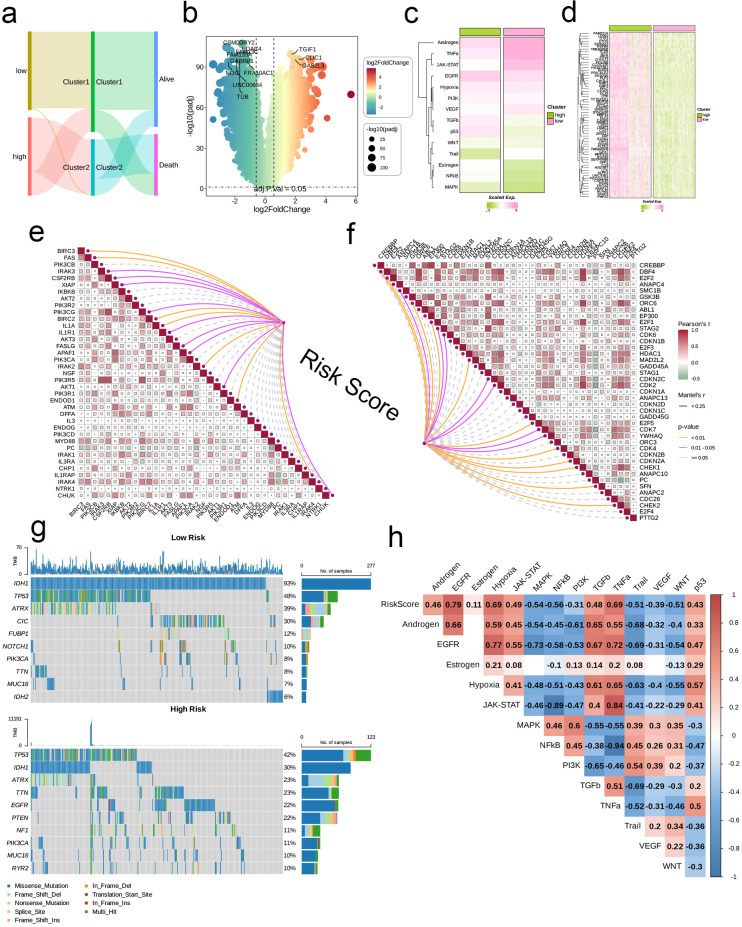
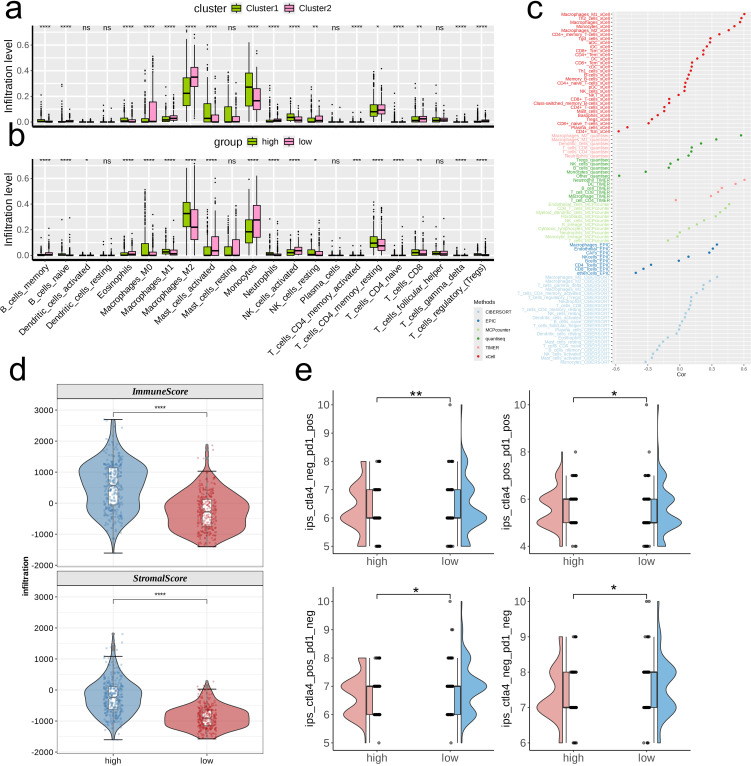
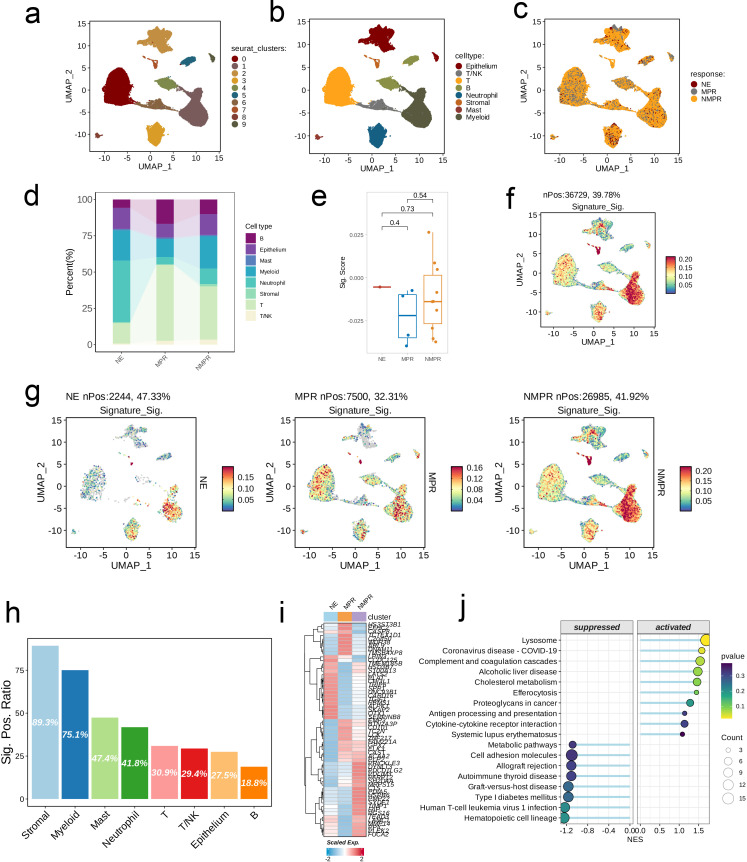
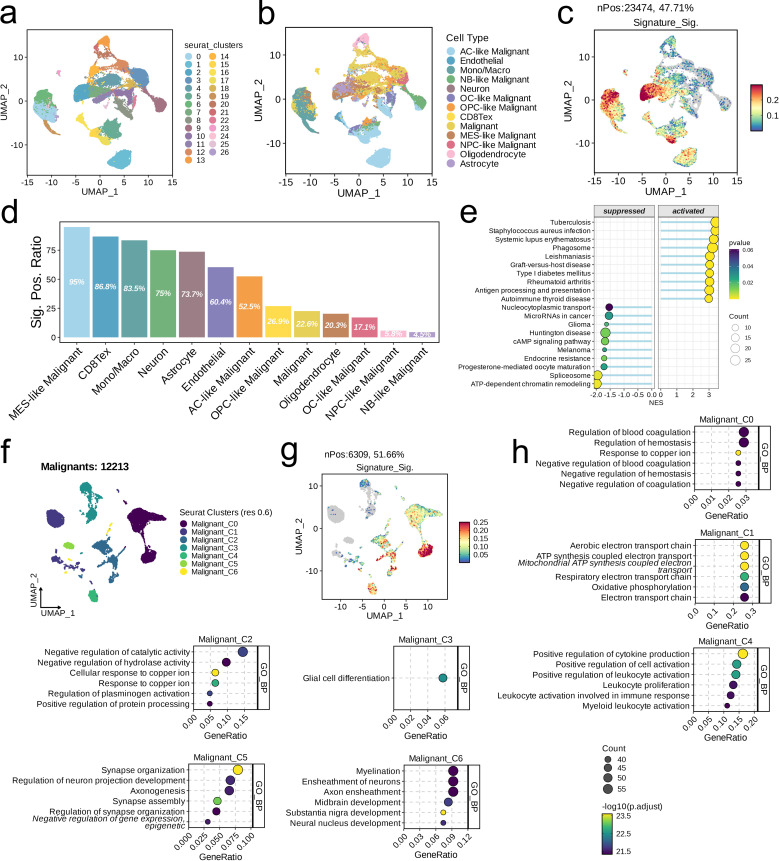
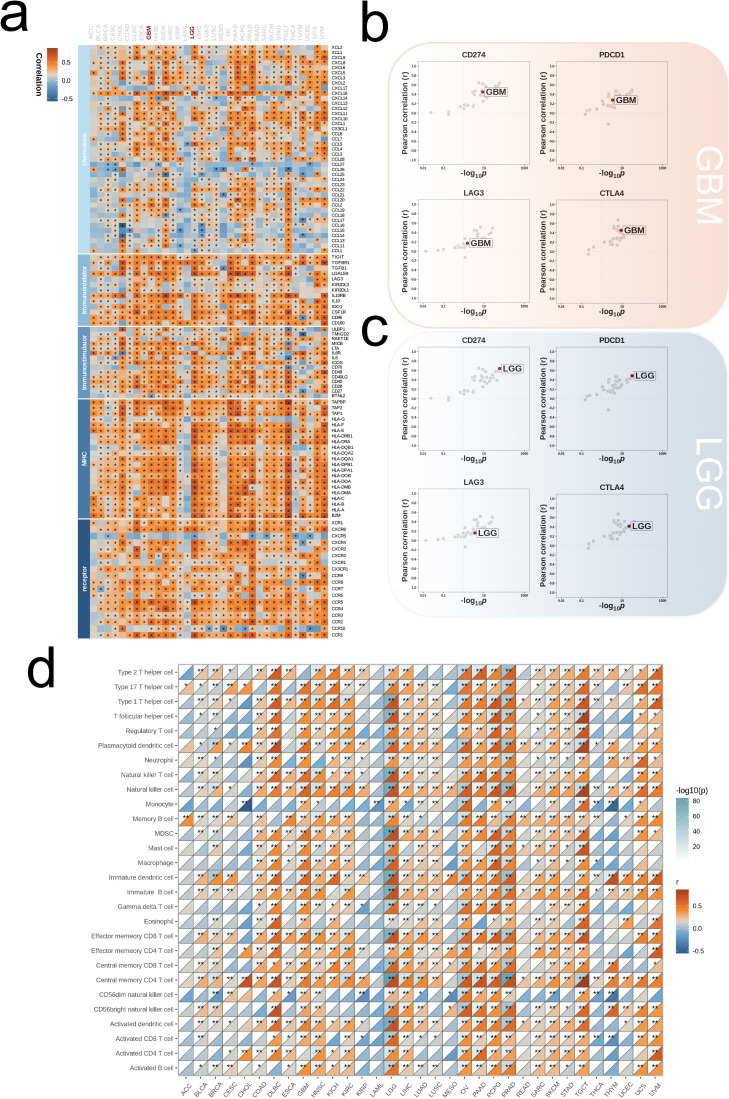
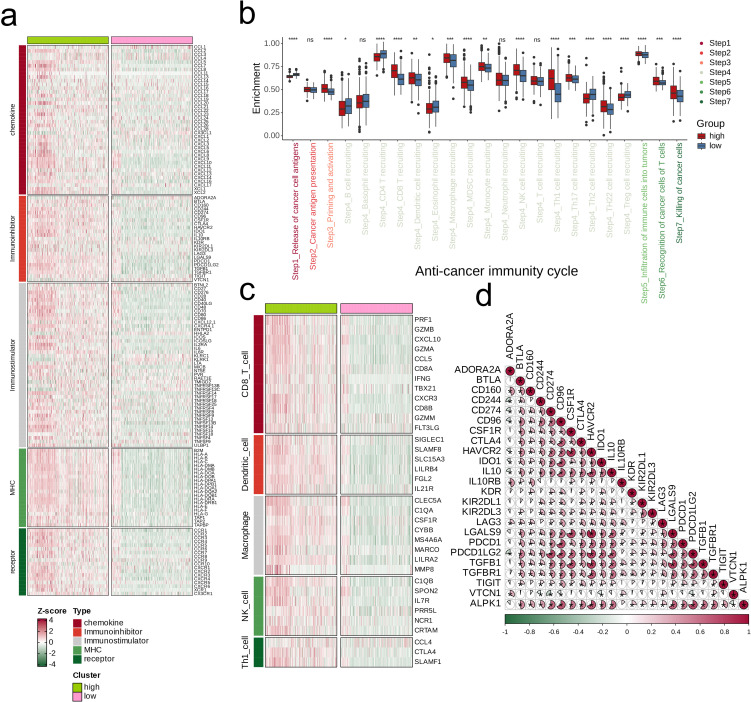
Methods: We integrated glioma datasets from multiple sources, employing Non-negative Matrix Factorization (NMF) to cluster samples and filter for differentially expressed metabolic genes. Additionally, we utilized Weighted Gene Co-expression Network Analysis (WGCNA) to identify key genes. A predictive model was developed utilizing the optimal consistency index derived from a combination of 101 machine learning techniques, and its effectiveness was confirmed through multiple datasets employing different methodologies. In-depth analyses were conducted on immune cell infiltration and tumor microenvironmental aspects. Single-cell sequencing data were employed for clustering and differential expression analysis of genes associated with glioma. Finally, the immune relevance of the model gene ALPK1 in the context of pan-cancer was explored, including its relationship with immune checkpoints.

Results: The application of NMF, coupled with differential analysis of metabolic-related genes, led to the identification of two clusters exhibiting significant differences in survival, age, and metabolic gene expression among patients. Core genes were identified through WGCNA, and a total of 101 machine learning models were constructed, with LASSO+GBM selected as the optimal model, demonstrating robust validation performance. Comprehensive analyses revealed that high-risk groups exhibited greater expression of specific genes, with ALPK1 showing significant correlations with immune regulation.

Conclusion: This research employed a multi-dataset strategy and various methods to clarify the differences in metabolic traits and immune conditions in glioma patients, while creating an innovative prognostic risk evaluation framework. These results offer fresh perspectives on the intricate biological processes that define gliomas.

Keywords: ALPK1; glioma; immune microenvironment; metabolic genes; prognostic biomarkers.


Conflict of interest statement

The authors declare that the research was conducted in the absence of any commercial or financial relationships that could be construed as a potential conflict of interest.

Figures

Figure 1
Figure 1
Nucleotide metabolism subclusters and prognosis in TCGA- LGG/GBM. (A) Cophenetic distributions, residual sum of squares (RSS), and dispersion indices for ranks 2–10. (B) Overall Kaplan-Meier survival curves for both subclusters. (C) The age distribution between two subclusters.
Figure 2
Figure 2
Crosstalk between nucleotide metabolism subclusters and key metabolic pathways. (A) Differences in glycolysis-related genes between subclusters. (B) Differences in amino acid metabolism-related genes between subclusters. (C) Differences in lipid metabolism-related genes between subclusters. (D) Gene set enrichment analysis (GSEA) reveals pathways downregulated in subtype C2 relative to C1. (E) GSEA reveals pathways upregulated in subtype C2 relative to C1.
Figure 3
Figure 3
Models Construction based on nucleotide metabolism subclusters. (A) Analysis of network topology for different soft-threshold power. The left panel shows the impact of soft-threshold power (power = 16) on the scale-free topology fit index; the right panel displays the impact of soft-threshold power on the mean connectivity. (B) Cluster dendrogram of the co-expression modules. Each color indicates a co-expression module. (C) Module-trait heatmap displaying the correlation between module eigengenes and clinical traits. (D) Correlation between module membership and gene significance in the turquoise module. Dots in color were regarded as the hub genes of the corresponding module (MM > 0.6 & GS > 0.4). (E) Top five enriched GO terms of module genes in each module except for the grey. (F) A total of 101 kinds of prediction models fitted in TCGA- LGG/GBM (Dataset1) and verified in the other two validation cohorts (GSE102073 [Dataset2] and GSE26712 [Dataset3]). The model was ordered by the average of the C-index of all datasets. The optimal model developed by “StepCox[forward]+GBM” was utilized in subsequent analyses. (G) Survival differences between two groups in the three datasets. (H) Time-dependent ROC analysis of the model in the three datasets. (I) Meta analysis of univariate Cox regression across the three datasets.
Figure 4
Figure 4
Associations between risk scores, clinical features, and oncogenic pathways in TCGA- LGG/GBM. (A) Distribution of risk groups among nucleotide metabolism subclusters and survival samples. (B) Differential genes between risk groups. (C) Activity differences in classic cancer-related pathways between risk groups. (D) Relationships between risk groups and gene expression levels. (E) Correlation of risk scores with apoptosis-related genes. (F) Correlation of risk scores with cell proliferation-related genes. (G) Distribution of the top 10 genes with the highest mutation frequencies across different risk groups. (H) Correlation of risk scores with enrichment scores of different classic tumor pathways.
Figure 5
Figure 5
Investigation of the correlation between risk score and the immune microenvironment of TCGA- LGG/GBM. (A, B) Differences in infiltration levels of 22 immune cell types between nucleotide metabolism subclusters and between risk groups. (C) Correlation of risk scores with various immune cells as revealed by seven different algorithms. (D) Differences in tumor microenvironment scores between different risk groups as revealed by the ESTIMATE algorithm. (E) Differences in IPS scores predicting effectiveness of PD-L1 or CTLA-4 inhibitor treatments between different risk groups. IPS score of each TCGA- LGG/GBM sample was acquired from the TCIA (https://tcia.at/home). ns, not significant; *p < 0.05; **p < 0.01; ***p < 0.001; ****p < 0.0001.
Figure 6
Figure 6
Single-cell analysis of risk score in immunochemotherapy treated scRNA-seq cohort. (A–C) UMAP visualization of 92,330 cells from the public NSCLC scRNA-seq cohort treated with immunochemotherapy. A total of ten subpopulations were identified under the resolution of 0.6 and manually annotated to eight meta-clusters based on the cranial markers provided in the original publication. (D) Differences in the abundance of cell types across different groups. (E) Distribution of the signature scores between groups. The signature score was calculated by the (AddModuleScore) function implemented in the “Seurat” package based on the genes derived from the model from the machine-learning pipeline. (F, G) UMAP visualization of the signature scores across cell types (F) and different groups (G). (H) The positive ratio of the signature across each cell type. (I) The differences in the abundance of signature genes across different groups in all patients. (J) GSEA reveals significantly altered pathways in cells with high signature scores compared to those with low scores.
Figure 7
Figure 7
Single-cell analysis of risk score in the integrated LGG/GBM scRNA-seq datasets. (A–C) UMAP visualization of single cells from the public LGG/GBM scRNA-seq cohorts. A total of 16 subpopulations were identified under the resolution of 0.6 and manually annotated to nine meta-clusters based on the cranial markers. (C) UMAP visualization of the signature scores across cell types. (D) The positive ratio of the signature across each cell type. (E) GSEA reveals significantly altered pathways in cells with high signature scores compared to those with low scores. (F) UMAP showing the subpopulations of malignant cells. (G) UMAP visualization of the signature scores across cell types. (D) The positive ratio of the signature across each cell type. (H) Top six enriched GO terms of each malignant subpopulation.
Figure 8
Figure 8
Influence of ALPK1 on immune landscapes in pan-cancer. (A) Association of ALPK1 with various immunoregulators (including receptors, MHC molecules, immunostimulators, and chemokines). (B) The associations between different tumor types and four immune checkpoints: CD274 (PD-L1), CTLA-4, LAG-3, and PDCD1 (PD-1), with dots representing various cancer types. GBM is marked with a red dot. (C) The associations between different tumor types and four immune checkpoints: CD274 (PD-L1), CTLA-4, LAG-3, and PDCD1 (PD-1), with dots representing various cancer types. LGG is marked with a red dot. (D) Relationship between ALPK1 and infiltration levels of 28 immune cells in different tumor types, as analyzed by the ssGSEA method. The correlation strength is depicted by color intensity. Statistically significant correlations, determined through Pearson correlation analysis, are marked with asterisks. *p < 0.05; **p < 0.01; ***p < 0.001.
Figure 9
Figure 9
Impact of ALPK1 on the TME in TCGA- LGG/GBM. (A) Expression differences of immunoregulators (as identified in Figure 8A ) between the high- and low- ALPK1 expression groups in TCGA- LGG/GBM. (B) Variations in the stages of the cancer immunity cycle for high versus low ALPK1 expression groups. (C) Association of ALPK1 with infiltration levels of five types of tumor-infiltrating immune cells: CD8+ T cells, DCs, macrophages, NK cells, and Th1 cells, determined by the six TME decoding algorithms. (D) Expression differences in effector genes of these immune cells between the high- and low- ALPK1 groups. Asterisks denote the significance levels as determined by the Mann-Whitney U test. ns, not significant; *p < 0.05; **p < 0.01; ***p < 0.001; ****p < 0.0001.
Figure 10
Figure 10
The effect of ALPK1 on Glioma was verified by wet experiment. (A) Comparison of mRNA expression levels of ALPK1 among cell lines. (B) ALPK1 knock inefficiency assessment. (C) Changes in proliferation levels after ALPK1 knockdown in LN229 cell lines. (D) Changes in proliferation levels after ALPK1 knockdown in HS683 cell lines. *p < 0.05; **p < 0.01; ***p < 0.001.

Similar articles

Cited by

References

    1. Xiao Z, Yao S, Wang ZM, Zhu DM, Bie YN, Zhang SZ, et al. . Multiparametric MRI features predict the SYP gene expression in low-grade glioma patients: A machine learning-based radiomics analysis. Front Oncol. (2021) 11:663451. doi: 10.3389/fonc.2021.663451 - DOI - PMC - PubMed
    1. Yang T, Hu Y, Miao J, Chen J, Liu J, Cheng Y, et al. . A BRD4 PROTAC nanodrug for glioma therapy via the intervention of tumor cells proliferation, apoptosis and M2 macrophages polarization. Acta Pharm Sin B. (2022) 12:2658–71. doi: 10.1016/j.apsb.2022.02.009 - DOI - PMC - PubMed
    1. Zhao ZQ, Wu XJ, Cheng YH, Zhou YF, Ma XM, Zhang J, et al. . TROAP regulates cell cycle and promotes tumor progression through Wnt/β-Catenin signaling pathway in glioma cells. CNS Neurosci Ther. (2021) 27:1064–76. doi: 10.1111/cns.13688 - DOI - PMC - PubMed
    1. Deng T, Liu Y, Yang Y, Yuan L, Liu F, Wang X, et al. . Regulation of microRNA miR-197-3p/CDC28 protein kinase regulatory subunit 1B (CKS1B) axis by Circular RNA hsa_circ_0000285 promotes glioma progression. Bioengineered. (2022) 13:4757–72. doi: 10.1080/21655979.2022.2031673 - DOI - PMC - PubMed
    1. Zhang C, Xu J, Chen L, Lin X. Multi-omics landscape of circadian rhythm pathway alterations in Glioma. Bioengineered. (2021) 12:3294–308. doi: 10.1080/21655979.2021.1947075 - DOI - PMC - PubMed

Substances

LinkOut - more resources