. 2025 Jan 18;46(1):87-102.
doi: 10.24272/j.issn.2095-8137.2024.269.

DNA2 knockout aggravates cerebral ischemia/reperfusion injury by reducing postsynaptic Homer1a

Affiliations

DNA2 knockout aggravates cerebral ischemia/reperfusion injury by reducing postsynaptic Homer1a

Ting Ma et al. Zool Res. .

Abstract

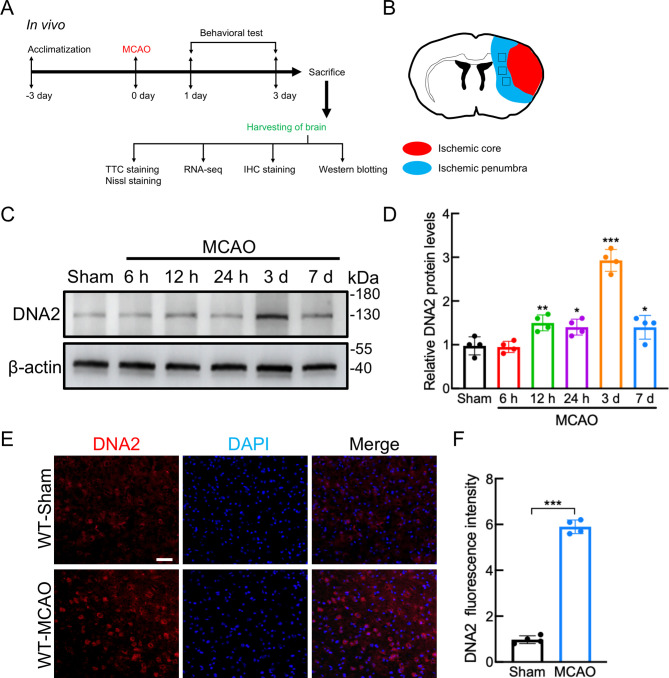
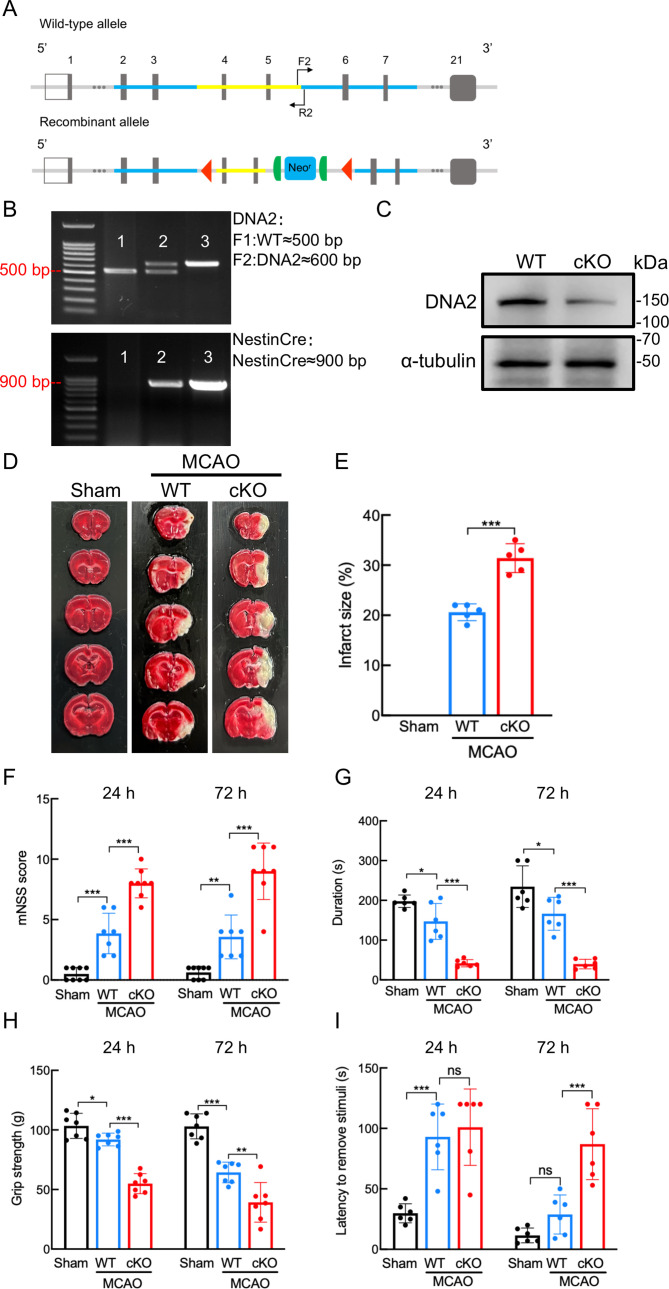
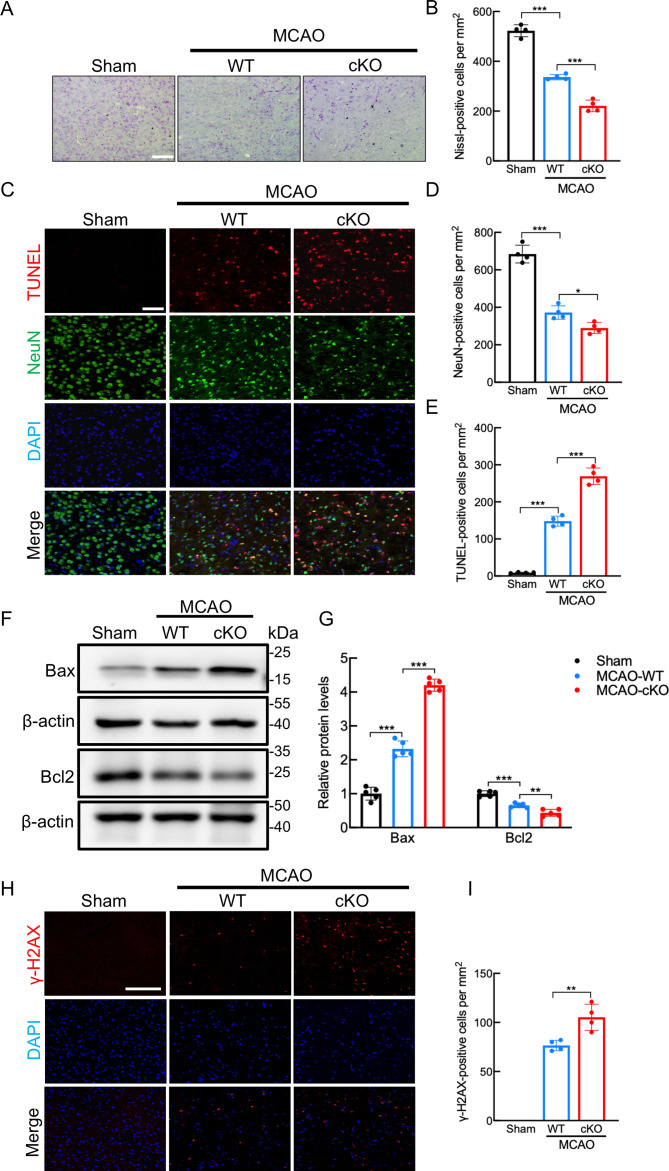
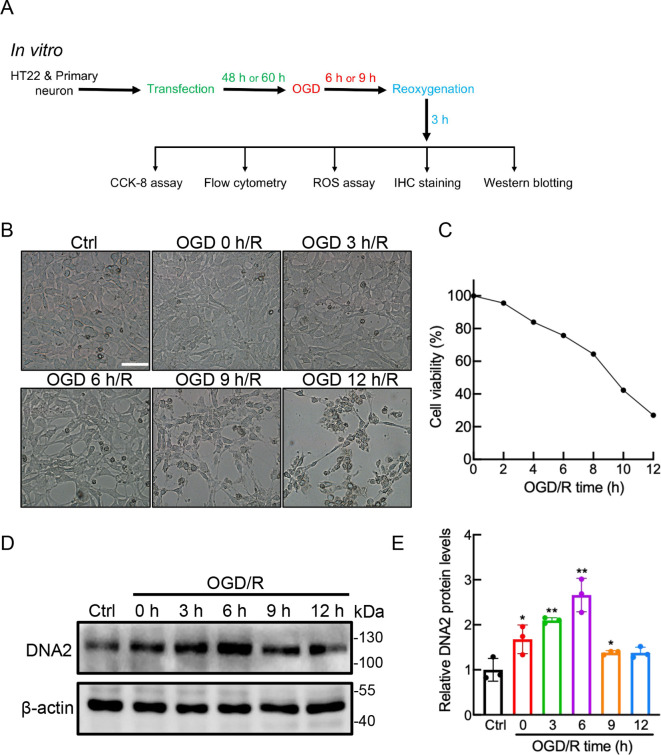
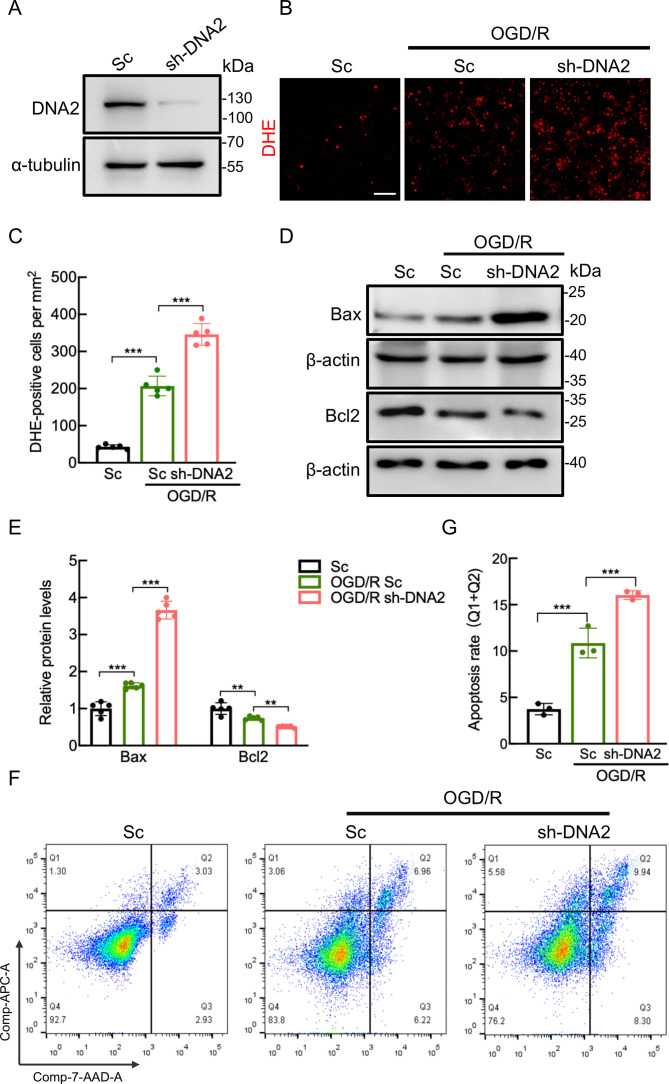
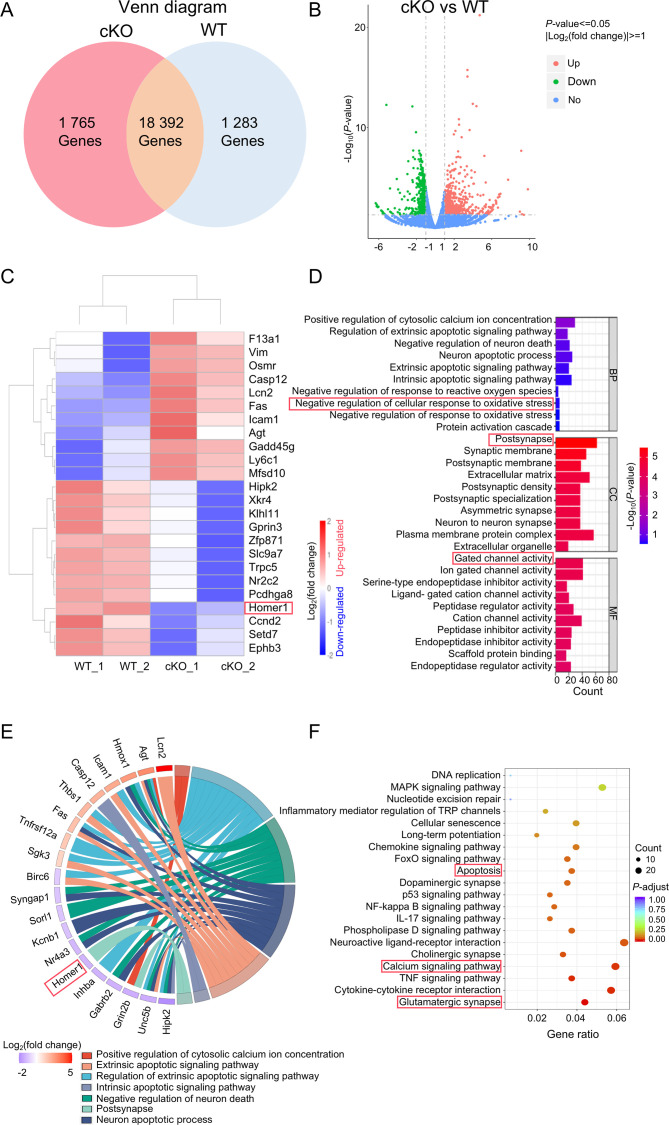
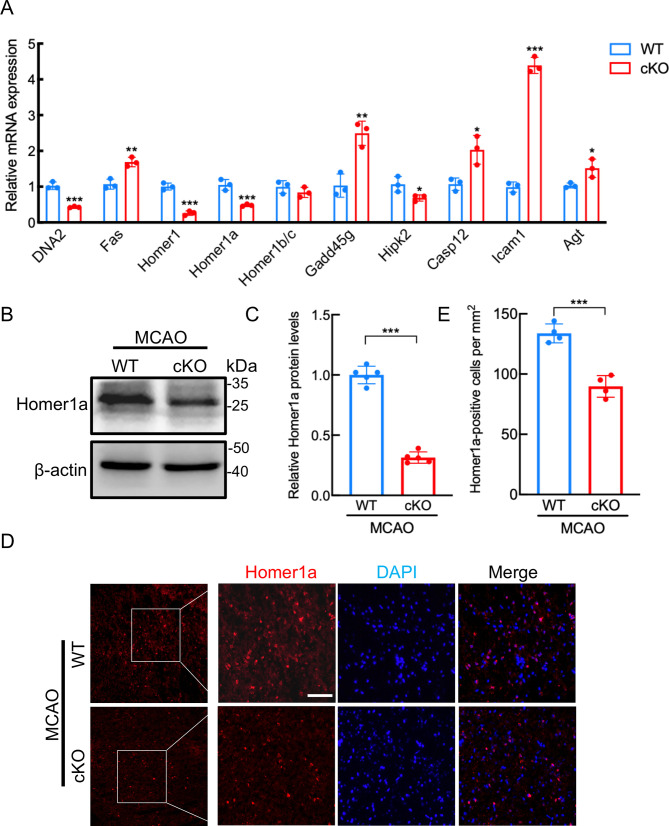
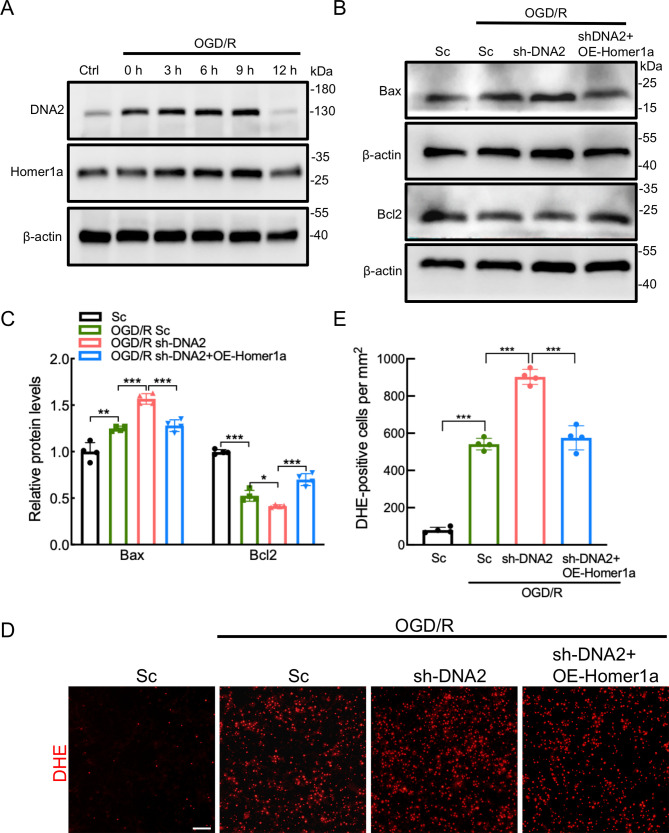
DNA2, a multifunctional enzyme with structure-specific nuclease, 5 '-to-3 ' helicase, and DNA-dependent ATPase activities, plays a pivotal role in the cellular response to DNA damage. However, its involvement in cerebral ischemia/reperfusion (I/R) injury remains to be elucidated. This study investigated the involvement of DNA2 in cerebral I/R injury using conditional knockout (cKO) mice ( Nestin-Cre) subjected to middle cerebral artery occlusion (MCAO), an established model of cerebral I/R. Results demonstrated a gradual up-regulation of DNA2 expression, peaking at 72 h post-MCAO. Notably, DNA2 cKO mice exhibited more pronounced brain injury, neurological deficits, and neuronal apoptosis within the penumbra following MCAO. Additionally, DNA2 expression was elevated in an oxygen-glucose deprivation/reoxygenation (OGD/R) cell culture model, and DNA2 knockdown (KD) exacerbated neuronal apoptosis and oxidative stress. Transcriptome analysis of ischemic penumbra tissues via RNA sequencing revealed significant down-regulation of Homer1 in DNA2 cKO mice. Furthermore, in vitro experiments demonstrated that overexpression of Homer1a ameliorated DNA2 KD-induced neuronal apoptosis. Collectively, these findings demonstrate that DNA2 deficiency exacerbates cerebral I/R injury through the down-regulation of Homer1a, highlighting a novel regulatory axis in ischemic neuroprotection.

DNA2是一种多功能酶,在冈崎片段加工、端粒维护、DNA双链断裂修复以及DNA复制叉处理等过程中发挥关键作用,对基因组稳定性至关重要。然而,DNA2在脑缺血/再灌注(Ischemia/reperfusion,I/R)损伤中的作用尚未明确。该研究利用 DNA2条件性敲除(Conditional knockout,cKO)小鼠,通过建立大脑中动脉闭塞(Middle cerebral artery occlusion,MCAO)模型探讨其功能。结果显示,MCAO后DNA2表达逐渐上调,并在72小时达到峰值。值得注意的是,cKO小鼠在MCAO后表现出显著的神经功能缺损和半暗带神经元凋亡。此外,在氧糖剥夺/复氧(Oxygen-glucose deprivation/reoxygenation,OGD/R)细胞模型中, DNA2敲低(Knockdown,KD)加剧了神经元凋亡和氧化应激反应。为进一步探究 DNA2在脑I/R损伤中的机制,我们对缺血半暗带组织进行了全转录组测序(Transcriptome sequencing,RNA-seq),结果发现,cKO小鼠的 Homer1表达显著下调。此外, Homer1a过表达能够改善 DNA2 KD引起的神经元凋亡。综上所述,该研究表明, DNA2敲除通过下调 Homer1a表达加剧脑I/R损伤。.

Keywords: Cerebral I/R; DNA2; Homer1a; Neuronal apoptosis; OGD/R.


Conflict of interest statement

The authors declare that they have no competing interests.

Figures

Figure 1
Figure 1
Expression pattern of DNA2 in ischemic penumbra following middle cerebral artery occlusion (MCAO) A: Schematic of animal experiments. B: Schematic of ischemic core (red) and penumbra (blue). C: WB images showing levels of DNA2 in ischemic penumbra at indicated time intervals following MCAO. D: Quantification of DNA2 protein levels (n=4), normalized to β-actin, with Sham group set to 1. *: P<0.05; **: P<0.01; ***: P<0.001 (one-way ANOVA with Dunnett’s post hoc analysis, F(5,18)=48.15). E: Representative images of IHC staining of DNA2 (red), cell nuclei counterstained with DAPI (blue) in ischemic penumbra from Sham or MCAO groups. Scale bar: 50 μm. F: Quantification of DNA2 fluorescence intensity (n=4). ***: P<0.001 (Student’s t-tests, t(6)=28.94).
Figure 2
Figure 2
DNA2 deficiency exacerbates neurobehavioral deficits and brain damage in MCAO A: Schematic of DNA2fl/fl mouse line construction. B: Representative genotyping images of DNA2fl/fl mice using standard PCR method, with DNA gels showing genotypes of homozygous DNA2fl/fl (600 bp), WT (500 bp), and Nestin-Cre (900 bp) mice. C: Representative WB images of DNA2 protein levels in cerebral ischemic penumbra. D: Representative brain sections stained with TTC showing infarcts 72 h after MCAO. E: Quantitative analysis of infarct size presented as a percentage of contralateral hemisphere size 3 days after MCAO (n=5). ***: P<0.001 (Student’s t-tests, t(8)=7.25). F: Neurological deficit scores of mice at 24 h and 72 h after MCAO (n≥6). 24 h: F(2,20)=78.23, 72 h: F(2,20)=48.34. G: Duration of mice on rotarod (n≥6). 24 h: F(2,15)=48.01, 72 h: F(2,15)=38.12. H: Comparison of forelimb grip strength in mice (n≥6). 24 h: F(2,18)=64.68, 72 h: F(2,18)=46.85. I: Time taken by mice to remove tape from their left paw (n≥6). 24 h: F(2,15)=15.22, 72 h: F(2,15)=24.33. ns: Not significant; *: P<0.05; **: P<0.01; ***: P<0.001 (one-way ANOVA with Dunnett’s post hoc analysis in F, G, H, and I).
Figure 3
Figure 3
DNA2 conditional knockout (cKO) aggravates MCAO-induced neuronal loss A: Nissl-stained images of neurons in cerebral ischemic penumbra in WT and DNA2 cKO mouse brains. Scale bar: 100 μm. B: Quantitative results of Nissl-positive neurons (n=4). ***: P<0.001 (one-way ANOVA with Dunnett’s post hoc analysis, F(2,9)=226.4). C: IHC images showing NeuN (green) and TUNEL (red) staining in cerebral ischemic penumbra. Scale bar: 50 μm. D: Quantitative analysis of NeuN-positive cells in cerebral ischemic penumbra (n=4). *: P<0.05; ***: P<0.001 (one-way ANOVA with Dunnett’s post hoc analysis, F(2,9)=117.7). E: Quantitative analysis of TUNEL-positive cells in cerebral ischemic penumbra (n=4). ***: P<0.001 (one-way ANOVA with Dunnett’s post hoc analysis, F(2,9)=300.5). F: Immunoblotting images showing levels of Bax and Bcl2 at 72 h after MCAO or Sham treatment. G: Quantitative analysis of Bax and Bcl2 protein levels (n=5), normalized to β-actin, with Sham group set to 1. **: P<0.01, ***: P<0.001 (one-way ANOVA with Dunnett’s post hoc analysis, Bax: F(2,12)=317.3, Bcl2: F(2,12)=57.34). H: Representative images of IHC staining of γ-H2AX (red) in ischemic penumbra from Sham or MCAO groups. Scale bar: 100 μm. I: Quantitative analysis of γ-H2AX-positive cells in cerebral ischemic penumbra (n=4). **: P<0.01 (Student’s t-tests, t(6)=4.01).
Figure 4
Figure 4
Expression pattern of DNA2 during oxygen-glucose deprivation/reoxygenation (OGD/R) in neuronal cultures A: Schematic of in vitro OGD/R study design. B: Morphological characteristics of HT22 cells at various OGD/R time points. Scale bar: 50 μm. C: Comparison of cell survival ratios under different experimental conditions, determined using CCK-8 assays. D: Representative WB images showing DNA2 levels at various OGD/R time points in HT22 cells. E: Quantitative analysis of DNA2 protein levels, normalized to β-actin, with Ctrl group set to 1. Data are from at least three independent experiments. *: P<0.05; **: P<0.01 (one-way ANOVA with Dunnett’s post hoc analysis, F(5,12)=19.86).
Figure 5
Figure 5
DNA2 knockdown (KD) enhances apoptosis in HT22 cells subjected to OGD/R A: Representative WB images depicting DNA2 protein levels in HT22 cells. B: Fluorescence images showing ROS levels in HT22 cells transfected with scrambled shRNA (Sc) and DNA2 shRNA (sh-DNA2). Scale bar: 100 μm. C: Quantitative analysis of DHE-positive cells. Data are from at least five independent experiments. ***: P<0.001 (one-way ANOVA with Dunnett’s post hoc analysis, F(2,12)=217.4). D: WB images showing expression levels of Bax and Bcl2 proteins in HT22 cells post-OGD/R. E: Quantitative analysis of Bax and Bcl2 protein levels, normalized to β-actin, with Sc group set to 1. Data are from at least five independent experiments. **: P<0.01; ***: P<0.001 (one-way ANOVA with Dunnett’s post hoc analysis, Bax: F(2,12)=296.5, Bcl2: F(2,12)=32.55). F, G: Flow cytometry results of annexin V-APC/7-AAD staining, showing percentage of total neuronal apoptosis (sum of Q1 and Q2 quadrants), Q1: Early apoptosis, Q2: Late apoptosis, Q3: Necrosis, Q4: Viable cells. Data are from at least three independent experiments. ***: P<0.001 (one-way ANOVA with Dunnett’s post hoc analysis, F(2,6)=109.2).
Figure 6
Figure 6
RNA-seq analysis of DNA2 cKO mice compared to WT mice following MCAO A: Venn diagram showing overlap of genes between cKO and WT groups. B: Volcano plot showing differentially expressed genes (DEGs) between DNA2 cKO and WT mice, highlighting significant changes. C: Heatmap of hierarchical cluster analysis for DEGs between cKO and WT mice, with red indicating up-regulated genes and blue indicating down-regulated genes. D: GO analysis of biological processes (BP), cellular components (CC), and molecular functions (MF), identifying key affected categories. E: Chord diagrams of GO enrichment analysis, showing gene names on the left semicircle and their corresponding functions on the right semicircle. F: Analysis of KEGG signaling pathways influenced by DNA2 cKO. Red rectangles highlight key genes or signaling pathways identified by RNA-seq.
Figure 7
Figure 7
DNA2 cKO reduces Homer1a expression at 3 days post-MCAO A: Real-time qPCR analysis of gene expression, selected from RNA-seq data (n=3). *: P<0.05; **: P<0.01 ***: P<0.001 (Student’s t-tests, DNA2: t(4)=10.06, Fas: t(4)=5.63, Homer1: t(4)=11.13, Homer1a: t(4)=7.72, Homer1b/c: t(4)=1.18, Gadd45g: t(4)=5.38, Hipk2: t(4)=2.84, Casp12: t(4)=3.80, Icam1: t(4)=22.42, Agt: t(4)=3.17). B: WB analysis of Homer1a protein levels in WT and cKO mice following MCAO. C: Quantitative analysis of Homer1a protein levels (n=5), normalized to β-actin, with WT group set to 1. ***: P<0.001 (Student’s t-tests, t(8)=17.62). D: IHC images showing Homer1a expression (red) in cerebral ischemic penumbra of WT and cKO mice at 3 days post-MCAO, with nuclei counterstained using DAPI. Scale bar: 50 µm. E: Quantitative analysis of Homer1a-positive cells within ischemic penumbra (n=4). ***: P<0.001 (Student’s t-tests, t(6)=7.41).
Figure 8
Figure 8
Overexpression (OE) of Homer1a mitigates apoptosis in primary neurons mediated by DNA2 KD in OGD/R A: Representative WB images showing levels of DNA2 and Homer1a at indicated time points during OGD/R in primary neurons. B: WB analysis of pro-apoptotic Bax and anti-apoptotic Bcl2 protein levels in primary neurons following OGD/R treatment. C: Quantitative analysis of Bax and Bcl2 protein levels, normalized to β-actin, with Sc group set to 1. Data are from at least four independent experiments. *: P<0.05; **: P<0.01; ***: P<0.001 (one-way ANOVA with Dunnett’s post hoc analysis, Bax: F(3,12)=49.50, Bcl2: F(3,12)=120.5). D: Fluorescence images showing ROS levels in primary neurons from indicated groups. Scale bar: 100 μm. E: Quantitative analysis of ROS-positive cells using DHE probe (red). Data are from at least four independent experiments. ***: P<0.001 (one-way ANOVA with Dunnett’s post hoc analysis, F(3,12)=259.9).

Similar articles

References

    1. Bockaert J, Perroy J, Ango F The complex formed by group I metabotropic glutamate receptor (mGluR) and Homer1a plays a central role in metaplasticity and homeostatic synaptic scaling. The Journal of Neuroscience. 2021;41(26):5567–5578. doi: 10.1523/JNEUROSCI.0026-21.2021. - DOI - PMC - PubMed
    1. Bouët V, Freret T, Toutain J, et al Sensorimotor and cognitive deficits after transient middle cerebral artery occlusion in the mouse. Experimental Neurology. 2007;203(2):555–567. doi: 10.1016/j.expneurol.2006.09.006. - DOI - PubMed
    1. Buchser WJ, Pardinas JR, Shi Y, et al 96-well electroporation method for transfection of mammalian central neurons. Biotechniques. 2006;41(5):619–624. doi: 10.2144/000112279. - DOI - PMC - PubMed
    1. Budd ME, Campbell JL The pattern of sensitivity of yeast dna2 mutants to DNA damaging agents suggests a role in DSB and postreplication repair pathways. Mutation Research/DNA Repair. 2000;459(3):173–186. doi: 10.1016/S0921-8777(99)00072-5. - DOI - PubMed
    1. Caston RA, Fortini P, Chen K, et al Maintenance of flap endonucleases for long-patch base excision DNA repair in mouse muscle and neuronal cells differentiated in vitro. International Journal of Molecular Sciences. 2023;24(16):12715. doi: 10.3390/ijms241612715. - DOI - PMC - PubMed

LinkOut - more resources