

Comprehensive Analysis Reveals the Potential Diagnostic Value of Biomarkers Associated With Aging and Circadian Rhythm in Knee Osteoarthritis
- PMID: 39846237
- PMCID: PMC11872380
- DOI: 10.1111/os.14370
Comprehensive Analysis Reveals the Potential Diagnostic Value of Biomarkers Associated With Aging and Circadian Rhythm in Knee Osteoarthritis
Abstract
Objective: Knee osteoarthritis (KOA) is characterized by structural changes. Aging is a major risk factor for KOA. Therefore, the objective of this study was to examine the role of genes related to aging and circadian rhythms in KOA.
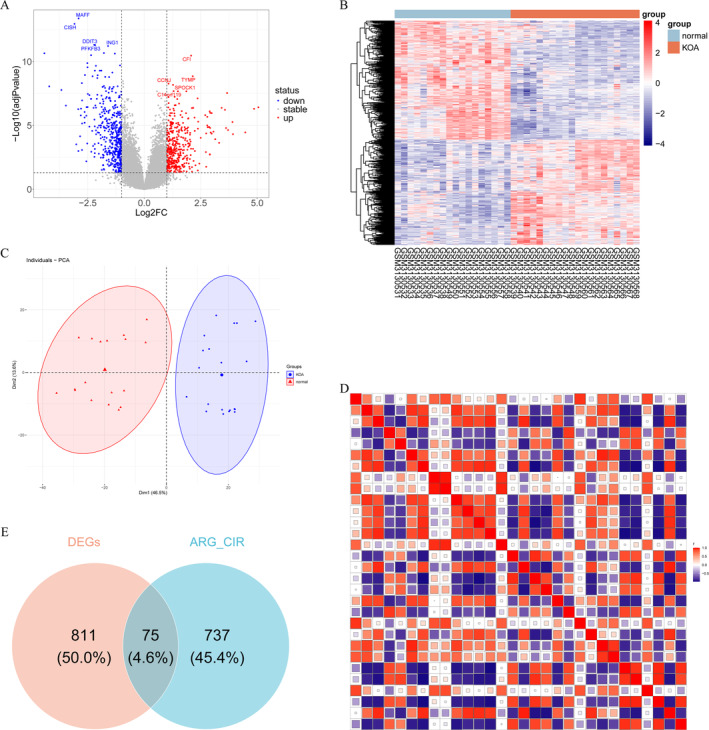
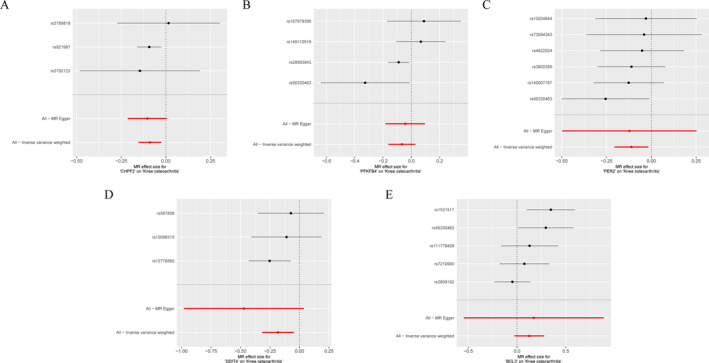
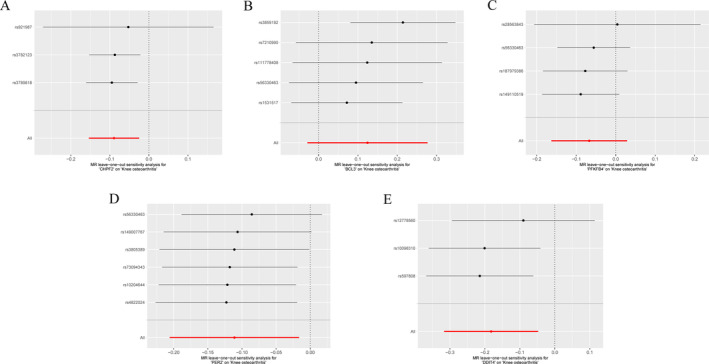
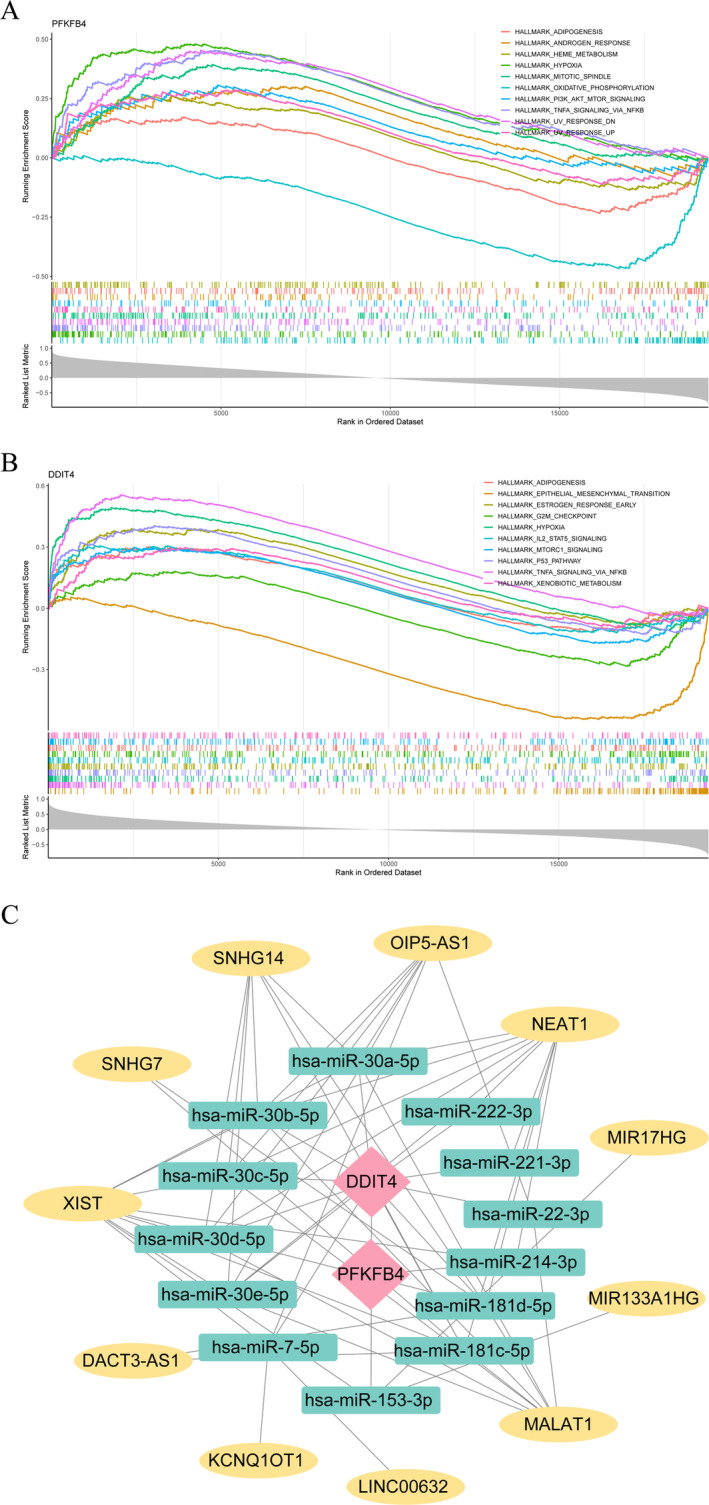
Methods: This study identified differentially expressed genes (DEGs) by comparing gene expression levels between normal and KOA samples from the GEO database. Subsequently, we intersected the DEGs with aging-related circadian rhythm genes to obtain a set of aging-associated circadian rhythm genes differentially expressed in KOA. Next, we conducted Mendelian randomization (MR) analysis, using the differentially expressed aging-related circadian rhythm genes in KOA as the exposure factors, their SNPs as instrumental variables, and KOA as the outcome event, to explore the causal relationship between these genes and KOA. We then performed Gene Set Enrichment Analysis (GSEA) to investigate the pathways associated with the selected biomarkers, conducted immune infiltration analysis, built a competing endogenous RNA (ceRNA) network, and performed molecular docking studies. Additionally, the findings and functional roles of the biomarkers were further validated through experiments on human cartilage tissue and cell models.
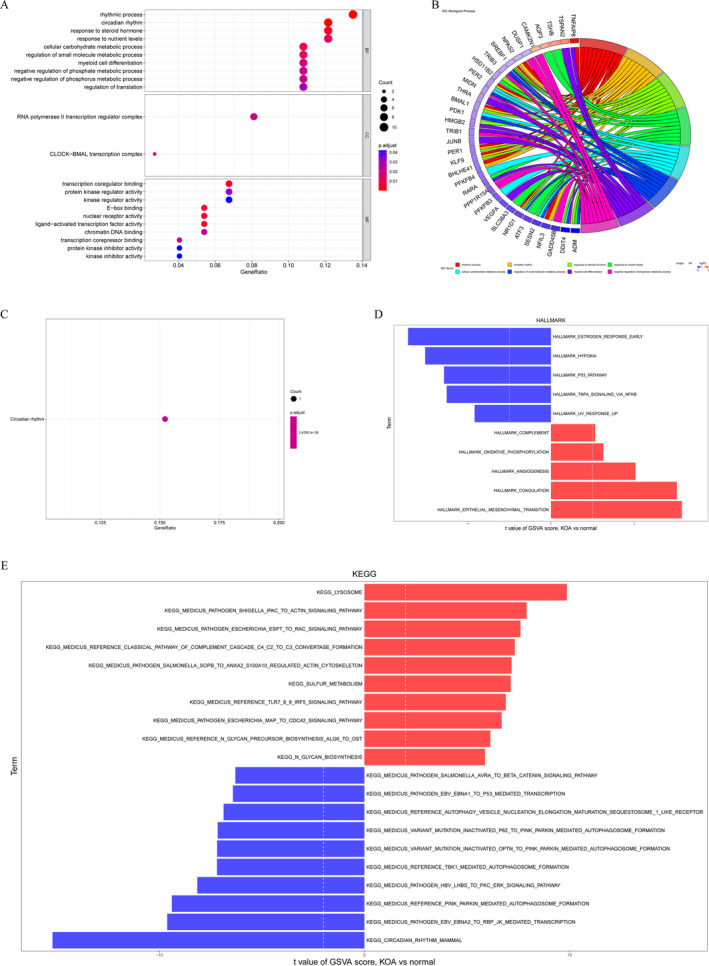
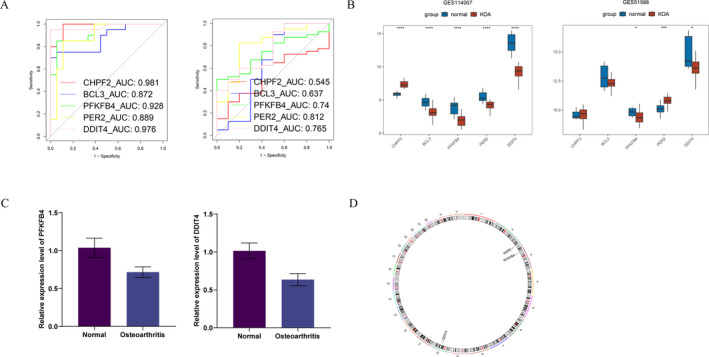
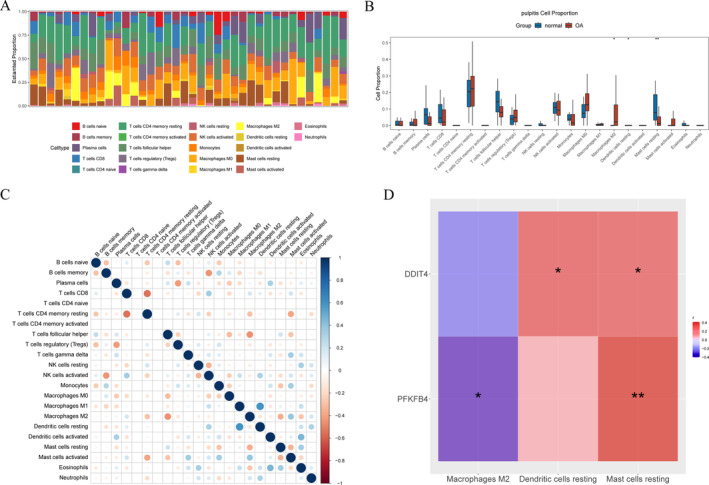
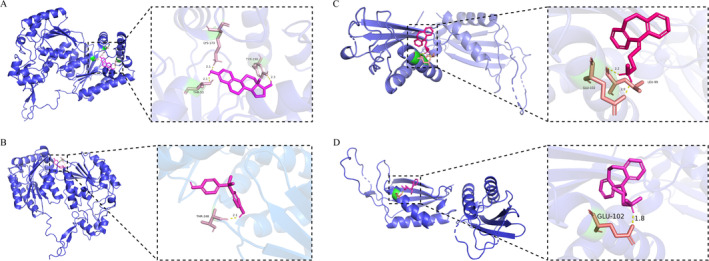
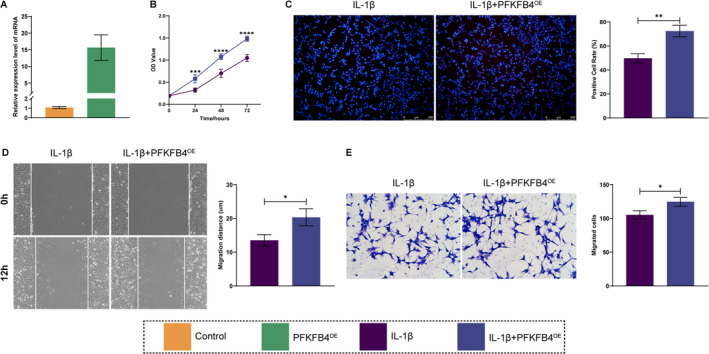
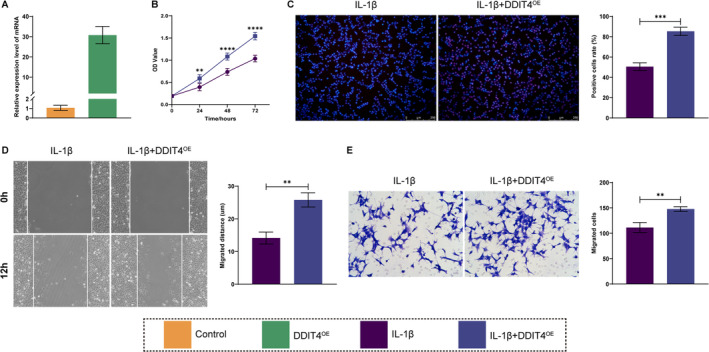
Results: A total of 75 differentially expressed aging-circadian rhythm related genes between the normal group and the KOA group were identified by difference analysis, primarily enriched in the circadian rhythm pathway. Two biomarkers (PFKFB4 and DDIT4) were screened by MR analysis. Then, immune infiltration analysis showed significant differences in three types of immune cells (resting dendritic cells, resting mast cells, and M2 macrophages), between the normal and KOA groups. Drug prediction and molecular docking results indicated stable binding of PFKFB4 to estradiol and bisphenol_A, while DDIT4 binds stably to nortriptyline and trimipramine. Finally, cell lines with stable expression of the biomarkers were established by lentiviral infection and resistance screening, Gene expression was significantly elevated in overexpressing cells of PFKFB4 and DDIT4 and reversed the proliferation and migration ability of cells after IL-1β treatment.
Conclusions: Two diagnostic and therapeutic biomarkers associated with aging-circadian rhythm in KOA were identified. Functional analysis, molecular mechanism exploration, and experimental validation further elucidated their roles in KOA, offering novel perspectives for the prevention and treatment of the disease.
Keywords: DDIT4; PFKFB4; aging; circadian rhythm; knee osteoarthritis; mendelian randomization.
© 2025 The Author(s). Orthopaedic Surgery published by Tianjin Hospital and John Wiley & Sons Australia, Ltd.
Conflict of interest statement
The authors declare no conflicts of interest.
Figures
Similar articles
-
Identification of key hub genes in knee osteoarthritis through integrated bioinformatics analysis.Sci Rep. 2024 Sep 28;14(1):22437. doi: 10.1038/s41598-024-73188-z. Sci Rep. 2024. PMID: 39341952 Free PMC article.
-
Identification of lncRNA and mRNA Biomarkers in Osteoarthritic Degenerative Meniscus by Weighted Gene Coexpression Network and Competing Endogenous RNA Network Analysis.Biomed Res Int. 2020 May 20;2020:2123787. doi: 10.1155/2020/2123787. eCollection 2020. Biomed Res Int. 2020. PMID: 32685450 Free PMC article.
-
Integrative analyses of mendelian randomization and bioinformatics reveal casual relationship and genetic links between COVID-19 and knee osteoarthritis.BMC Med Genomics. 2025 Jan 2;18(1):2. doi: 10.1186/s12920-024-02074-4. BMC Med Genomics. 2025. PMID: 39748395 Free PMC article.
-
A Bidirectional Mendelian Randomization Study of Sarcopenia-Related Traits and Knee Osteoarthritis.Clin Interv Aging. 2023 Sep 15;18:1577-1586. doi: 10.2147/CIA.S424633. eCollection 2023. Clin Interv Aging. 2023. PMID: 37731961 Free PMC article. Review.
-
Exploring causal correlations between inflammatory cytokines and knee osteoarthritis: a two-sample Mendelian randomization.Front Immunol. 2024 Apr 18;15:1362012. doi: 10.3389/fimmu.2024.1362012. eCollection 2024. Front Immunol. 2024. PMID: 38698846 Free PMC article. Review.
References
MeSH terms
Substances
Grants and funding
LinkOut - more resources
Full Text Sources
Medical
