. 2025 Jan 23;10(2):e186504.
doi: 10.1172/jci.insight.186504.

Endothelial FOXM1 and Dab2 promote diabetic wound healing

Affiliations

Endothelial FOXM1 and Dab2 promote diabetic wound healing

Sudarshan Bhattacharjee et al. JCI Insight. .

Abstract

Diabetes mellitus can cause impaired and delayed wound healing, leading to lower extremity amputations; however, the mechanisms underlying the regulation of vascular endothelial growth factor-dependent (VEGF-dependent) angiogenesis remain unclear. In our study, the molecular underpinnings of endothelial dysfunction in diabetes are investigated, focusing on the roles of disabled-2 (Dab2) and Forkhead box M1 (FOXM1) in VEGF receptor 2 (VEGFR2) signaling and endothelial cell function. Bulk RNA-sequencing analysis identified significant downregulation of Dab2 in high-glucose-treated primary mouse skin endothelial cells. In diabetic mice with endothelial deficiency of Dab2, in vivo and in vitro angiogenesis and wound healing were reduced when compared with wild-type diabetic mice. Restoration of Dab2 expression by injected mRNA-containing, LyP-1-conjugated lipid nanoparticles rescued impaired angiogenesis and wound healing in diabetic mice. Furthermore, FOXM1 was downregulated in skin endothelial cells under high-glucose conditions as determined by RNA-sequencing analysis. FOXM1 was found to bind to the Dab2 promoter, regulating its expression and influencing VEGFR2 signaling. The FOXM1 inhibitor FDI-6 reduced Dab2 expression and phosphorylation of VEGFR2. Our study provides evidence of the crucial roles of Dab2 and FOXM1 in diabetic endothelial dysfunction and establishes targeted delivery as a promising treatment for diabetic vascular complications.

Keywords: Adaptor proteins; Angiogenesis.


Figures

Figure 1
Figure 1. Diabetes and high-glucose treatment in ECs lead to the downregulation of Dab2.
(A) Volcano plot of differentially expressed genes and in skin ECs cultured in high versus normal concentration of glucose for 48 hours. The x axis shows the log2 fold-change (log2FC), and the y axis represents the negative logarithm of the false discovery rate (–log10 FDR) (n = 3 per group of mice). (B) RNA abundance of Dab2 in ECs isolated from WT or diabetic mouse skin determined by quantitative reverse transcriptase PCR (qRT-PCR or qPCR) (n = 3 cell repetitions, results are presented as mean ± SD, P value calculated by t test). (C) RNA abundance of Dab2 in skin ECs cultured in normal or high concentration of glucose determined by qRT-PCR (n = 3 cell repetitions, results are presented as mean ± SD, P value calculated by t test). (D) Representative Western blots of Dab2 in skin ECs cultured in normal (Control) or high concentration of glucose. (E) Quantitation of protein level of Dab2 relative to Actin in C (n = 3 cell repetitions, results are presented as mean ± SD, P value calculated by t test). (F) Representative Western blots of Dab2 in skin ECs isolated from WT control mice, Dab2-ECiKO control mice, and WT diabetic mice. (G) Quantitation of protein level of Dab2 relative to Actin in E (n = 3 cell repetitions, results are presented as mean ± SD, P value calculated by ANOVA). (H) Representative immunofluorescence staining of Dab2 (shown in green) in ECs treated with high or normal concentration of glucose for 48 hours. Scale bar = 50 μm. (I) Quantitation of fluorescence intensity in H (n = 3 cell repetitions, results are presented as mean ± SD, P value calculated by t test).
Figure 2
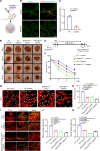
Figure 2. EC-specific Dab2 knockout causes reduced angiogenesis in vivo.
(A) Schematic diagram of the Matrigel plug assay. (B) Representative immunofluorescence staining of Dab2 (green) and CD31 (red) in blood vessels in sections of Matrigel implant from WT and diabetic mice 1 week after injection. Scale bar = 50 μm. (C) Quantitation of Dab2 fluorescence intensity in B (n = 3 per group of mice, results are presented as mean ± SD, P value calculated by t test). (D) Representative figures of wounds from wound-healing assays in WT control mice, WT diabetes mice, Dab2-ECiKO control mice, and Dab2-ECiKO diabetes mice. (E) Schematic diagram of the protocol used to induce diabetes in mice for the wound-healing assay that illustrates the step-by-step treatment process, starting with the administration of STZ followed by an HFD regimen. (F) Analysis of wound closure conducted at 1, 3, 5, and 7 days after the initial wound creation, providing a timeline view of the healing process (*P < 0.05 vs. WT mice; #P < 0.05 vs. WT mice; ¥P < 0.05 vs. WT mice. n = 6 per group of mice, results are presented as mean ± SD, P value calculated by ANOVA). (G) Representative immunofluorescence staining of cryosections of Matrigel implants. Scale bar = 50 μm. (H) Quantitation of CD31-positive tip cell percentage in F (n = 3 per group of mice, results are presented as mean ± SD, P value calculated by ANOVA). (I) Representative immunofluorescence staining of retinal micropocket assay to assess the angiogenesis. Scale bar = 500 μm. Insets were optically enlarged 4×. (J) Quantification of the density of blood vessels (n = 3 per group of mice, results are presented as mean ± SD, P value calculated by ANOVA). (K) Quantification of the density of EdU-positive proliferative skin ECs (n = 3 per group of mice, results are presented as mean ± SD, P value calculated by ANOVA).
Figure 3
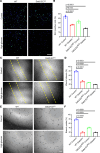
Figure 3. EC-specific Dab2 knockout causes reduced angiogenesis in vitro.
(A) Representative figures of EdU incorporation (green) in WT skin ECs cultured in normal or high concentration of glucose and skin ECs from Dab2-ECiKO mice with or without high concentration of glucose. Scale bar = 200 μm. (B) Quantitation of the proportion of EdU-positive skin ECs in A (n = 3 cell repetitions, results are presented as mean ± SD, P value calculated by ANOVA). (C) Representative figures of wound closure scratch assay of ECs monolayers as described in A. Original magnification, 10×. (D) Quantitation of wound closure results in C (n = 3 cell repetitions, results are presented as mean ± SD, P value calculated by ANOVA). (E) Representative figures of tube formation assay of cells as described in A. (F) Quantitation of branch points in results from E (n = 3 cell repetitions, results are presented as mean ± SD, P value calculated by ANOVA).
Figure 4
Figure 4. Dab2 integrin binding sites and effect of DPI on VEGFR2 signaling in skin ECs.
(A) Alignment of human and mouse Dab1 and Dab2 protein-coding sequences, identifying a consistent RGD motif and an additional KGD motif in the Dab2 PTB domain, suggesting evolutionarily conserved integrin binding capabilities. (B) The presence of an RGD peptide motif and an additional KGD motif in the Dab2 PTB domain suggests integrin binding capabilities. (C) Immunoblot of VEGFR2-proximal signaling components in skin ECs pretreated with DPI followed by VEGFA stimulation.
Figure 5
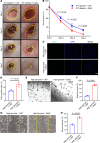
Figure 5. Restoration of Dab2 expression in ECs rescues impaired angiogenesis and wound healing in diabetic mice.
(A) Representative figures of wounds from wound-healing assays in WT diabetic mice treated with LNPs carrying mRNAs encoding GFP (WT diabetic + LNP group) or Dab2 (WT diabetic + Dab2 group). (B) Quantitation of wound closure conducted on days 1, 3, 5, and 7 after the initial wound (n = 5 per group of mice, P value calculated using t test). (C) Representative figures of EdU of skin ECs cultured in high concentration of glucose infected with empty lentivirus vector or lentivirus carrying Dab2 cDNA. Scale bar = 200 μm. (D) Quantitation of the proportion of EdU-positive cells in C (n = 3 cell repetitions, P value calculated using t test). (E) Representative figures of tube formation assay on skin ECs cultured in high concentration of glucose and infection with empty vector or lentivirus carrying Dab2 cDNA. Original magnification, 100×. (F) Quantitation of branch points in results from E (n = 3 cell repetitions, results are presented as mean ± SD, P value calculated by t test). (G) Representative figures of wound-healing assay on skin ECs cultured in high concentration of glucose and infection with empty vector or lentivirus carrying Dab2 cDNA. Original magnification, 100×. (H) Quantitation of wound closure results in G (n = 3 cell repetitions, results are presented as mean ± SD, P value calculated by t test).
Figure 6
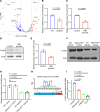
Figure 6. FOXM1 is downregulated in diabetes and regulates Dab2 transcription.
(A) Volcano plot of differentially expressed transcription factors in skin ECs cultured in high versus normal concentration of glucose for 48 hours. The x axis shows the log2FC, and the y axis represents the –log10 FDR (n = 3 per group of mice). (B) RNA abundance of Foxm1 in ECs isolated from normal or diabetic mouse skin determined by qRT-PCR (n = 3 cell repetitions, results are presented as mean ± SD, P value calculated by t test). (C) RNA abundance of Foxm1 in skin ECs cultured in normal or high concentration of glucose determined by qRT-PCR (n = 3 cell repetitions, results are presented as mean ± SD, P value calculated by t test). (D) Representative Western blots of Dab2 in skin ECs cultured in control or high concentration of glucose. (E) Quantitation of protein level of Dab2 relative to Actin in D (n = 3 cell repetitions, results are presented as mean ± SD, P value calculated by t test). (F) Representative Western blots of Dab2 in skin ECs isolated from WT control mice, Dab2-ECiKO control mice, WT diabetic mice, and Dab2-ECiKO diabetic mice. (G) Quantitation of protein level of Dab2 relative to Actin in E (n = 3 cell repetitions, results are presented as mean ± SD, P value calculated by t test). (H) JASPAR-predicted FOXM1-binding site in the Dab2 promoter. (I) FOXM1 binding to the Dab2 promoter in ECs exposed to high concentration of glucose, or FDI-6, or with a CRISPR-mediated deletion mutation in the FOXM1-binding site on the Dab2 promoter (n = 3 cell repetitions, results are presented as mean ± SD, P value calculated by ANOVA).
Figure 7
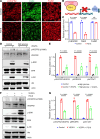
Figure 7. FOXM1 inhibitor FDI-6 downregulates Dab2 expression and the phosphorylation of VEGFA-induced VEGFR2.
(A) Representative immunofluorescence staining of skin ECs treated with or without FDI-6. Scale bars = 50 μm. (B) Schematic diagram showing inhibition of Dab2 expression by FDI-6. (C) Quantitation of the immunofluorescence intensity in A (n = 3 cell repetitions, results are presented as mean ± SD, P value calculated by t test). (D) VEGFA-induced phosphorylation of key VEGFR2-proximal signaling components in skin ECs treated in control or high-glucose concentration with or without VEGFA assessed by Western blot analysis. (E) Quantitation of results described in D (n = 3 cell repetitions, results are presented as mean ± SD, P value calculated by ANOVA). (F) Representative Western blot of VEGFA-induced key VEGFA-induced VEGFR2-proximal signaling in skin ECs treated with or without FDI-6. (G) Quantitative analysis of immunoblots in F (n = 3 cell repetitions, results are presented as mean ± SD, P value calculated by ANOVA).

Update of

References

    1. Driver VR, et al. The costs of diabetic foot: the economic case for the limb salvage team. J Am Podiatr Med Assoc. 2010;100(5):335–341. doi: 10.7547/1000335. - DOI - PubMed
    1. Boulton AJ, et al. The global burden of diabetic foot disease. Lancet. 2005;366(9498):1719–1724. doi: 10.1016/S0140-6736(05)67698-2. - DOI - PubMed
    1. Dixon D, Edmonds M. Managing diabetic foot ulcers: pharmacotherapy for wound healing. Drugs. 2021;81(1):29–56. doi: 10.1007/s40265-020-01415-8. - DOI - PubMed
    1. Veith AP, et al. Therapeutic strategies for enhancing angiogenesis in wound healing. Adv Drug Deliv Rev. 2019;146:97–125. doi: 10.1016/j.addr.2018.09.010. - DOI - PMC - PubMed
    1. Tonnesen MG, et al. Angiogenesis in wound healing. J Investig Dermatol Symp Proc. 2000;5(1):40–46. doi: 10.1046/j.1087-0024.2000.00014.x. - DOI - PubMed

MeSH terms

Substances