

Changes in the Spatial Structure of Synchronization Connections in EEG During Nocturnal Sleep Apnea
- PMID: 39846529
- PMCID: PMC11755653
- DOI: 10.3390/clockssleep7010001
Changes in the Spatial Structure of Synchronization Connections in EEG During Nocturnal Sleep Apnea
Abstract
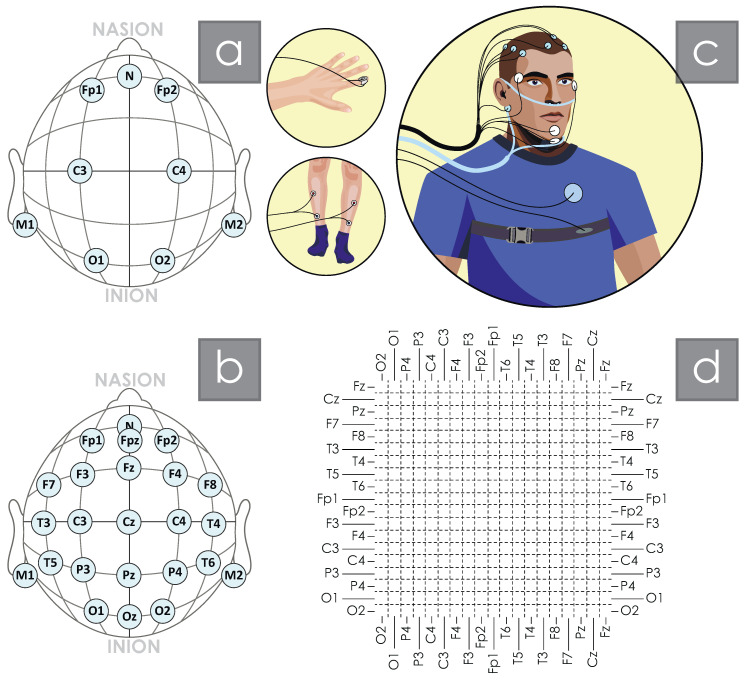
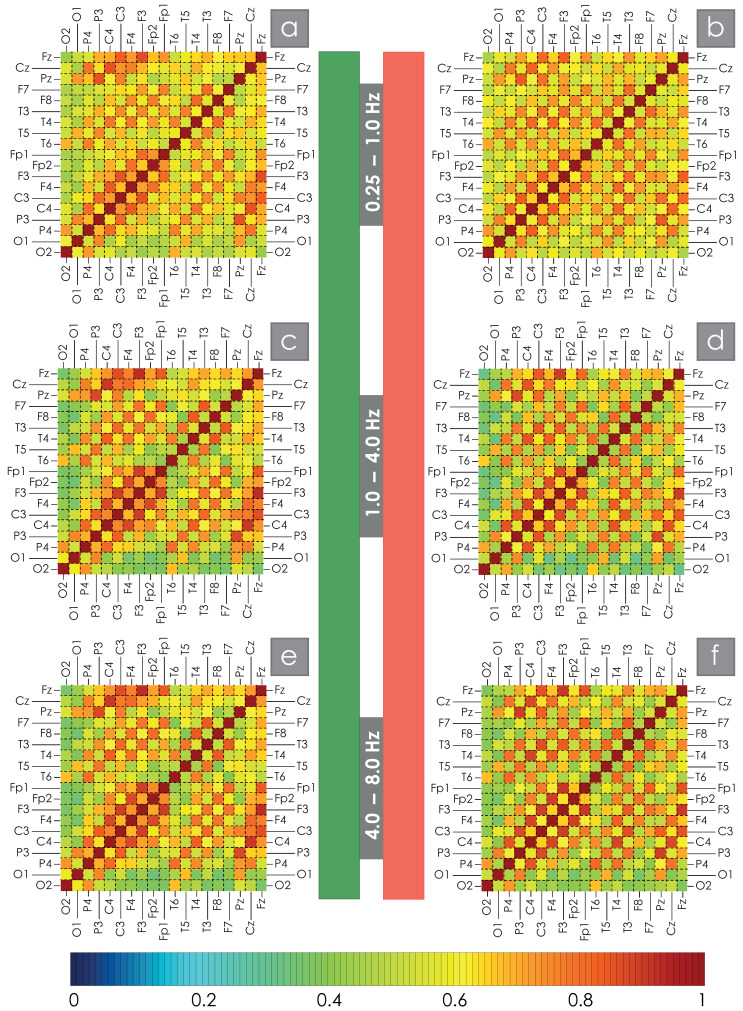
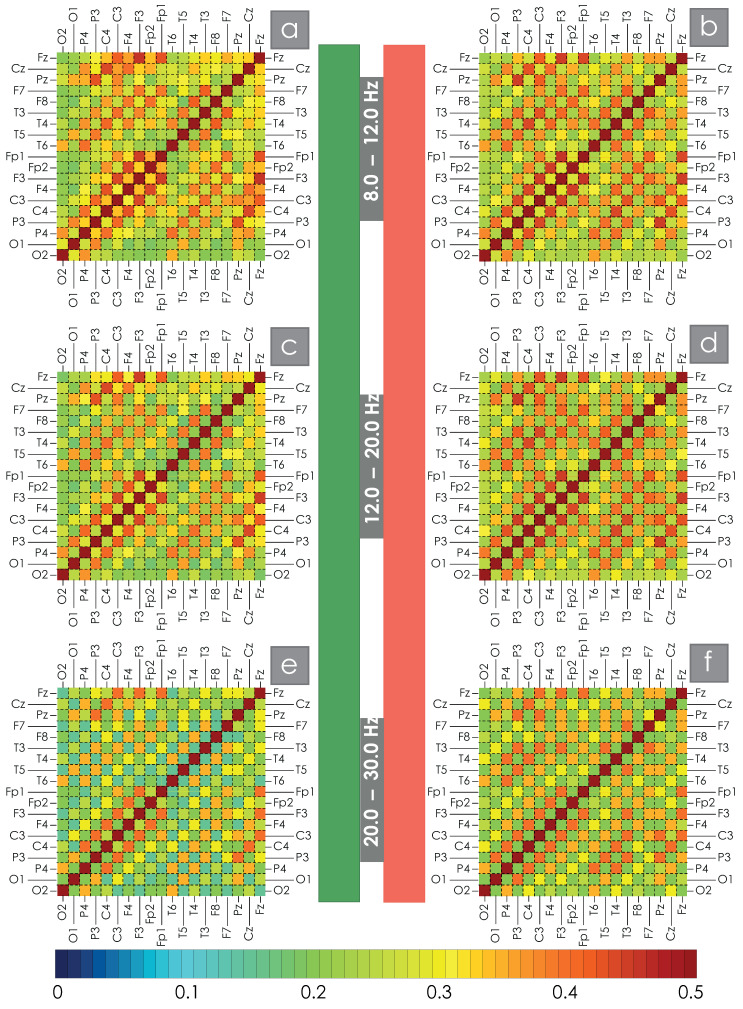
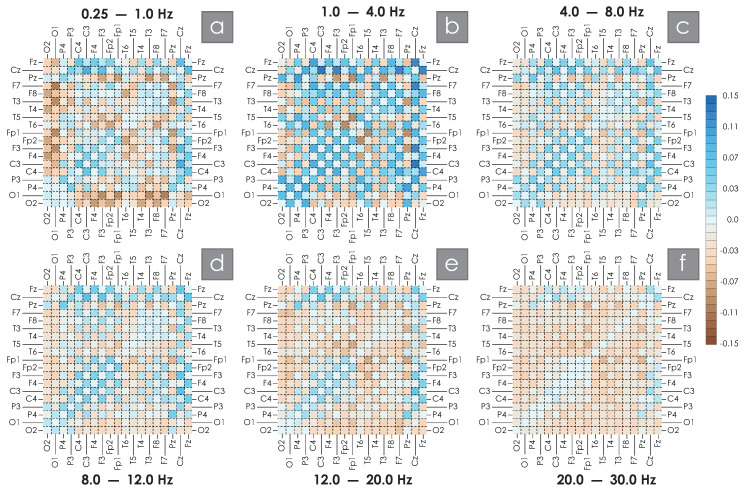
This study involved 72 volunteers divided into two groups according to the apnea-hypopnea index (AHI): AHI>15 episodes per hour (ep/h) (main group, n=39, including 28 men, median AHI 44.15, median age 47), 0≤AHI≤15ep/h (control group, n=33, including 12 men, median AHI 2, median age 28). Each participant underwent polysomnography with a recording of 19 EEG channels. Based on wavelet bicoherence (WB), the magnitude of connectivity between all pairs of EEG channels in six bands was estimated: Df1 0.25;1, Df2 1;4, Df3 4;8, Df4 8;12, Df5 12;20, Df6 20;30 Hz. In all six bands considered, we noted a significant decrease in symmetrical interhemispheric connections in OSA patients. Also, in the main group for slow oscillatory activity Df1 and Df2, we observe a decrease in connection values in the EEG channels associated with the central interhemispheric sulcus. In addition, patients with AHI>15 show an increase in intrahemispheric connectivity, in particular, forming a left hemisphere high-degree synchronization node (connections PzT3, PzF3, PzFp1) in the Df2 band. When considering high-frequency EEG oscillations, connectivity in OSA patients again shows a significant increase within the cerebral hemispheres. The revealed differences in functional connectivity in patients with different levels of AHI are quite stable, remaining when averaging the full nocturnal EEG recording, including both the entire sleep duration and night awakenings. The increase in the number of hypoxia episodes correlates with the violation of the symmetry of interhemispheric functional connections. Maximum absolute values of correlation between the apnea-hypopnea index, AHI, and the WB synchronization strength are observed for the Df2 band in symmetrical EEG channels C3C4 (-0.81) and P3P4 (-0.77). The conducted studies demonstrate the possibility of developing diagnostic systems for obstructive sleep apnea syndrome without using signals from the cardiovascular system and respiratory activity.
Keywords: connections; polysomnography; sleep apnea; spatial structure; synchronization.
Conflict of interest statement
The authors declare no conflicts of interest.
Figures
Similar articles
-
Polysomnography in patients with obstructive sleep apnea: an evidence-based analysis.Ont Health Technol Assess Ser. 2006;6(13):1-38. Epub 2006 Jun 1. Ont Health Technol Assess Ser. 2006. PMID: 23074483 Free PMC article.
-
Quantitative electroencephalography measures in rapid eye movement and nonrapid eye movement sleep are associated with apnea-hypopnea index and nocturnal hypoxemia in men.Sleep. 2019 Jul 8;42(7):zsz092. doi: 10.1093/sleep/zsz092. Sleep. 2019. PMID: 31004167
-
Compensatory mechanisms of reduced interhemispheric EEG connectivity during sleep in patients with apnea.Sci Rep. 2023 May 25;13(1):8444. doi: 10.1038/s41598-023-35376-1. Sci Rep. 2023. PMID: 37231107 Free PMC article.
-
Nocturnal blood pressure and nocturnal blood pressure fluctuations: the effect of short-term CPAP therapy and their association with the severity of obstructive sleep apnea.J Clin Sleep Med. 2022 Feb 1;18(2):361-371. doi: 10.5664/jcsm.9564. J Clin Sleep Med. 2022. PMID: 34314347 Free PMC article. Clinical Trial.
-
Sleep apnea is a common and dangerous cardiovascular risk factor.Curr Probl Cardiol. 2025 Jan;50(1):102838. doi: 10.1016/j.cpcardiol.2024.102838. Epub 2024 Sep 4. Curr Probl Cardiol. 2025. PMID: 39242062 Review.
References
-
- Benjafield A.V., Ayas N.T., Eastwood P.R., Heinzer R., Ip M.S., Morrell M.J., Nunez C.M., Patel S.R., Penzel T., Pépin J.L., et al. Estimation of the global prevalence and burden of obstructive sleep apnoea: A literature-based analysis. Lancet Respir. Med. 2019;7:687–698. doi: 10.1016/S2213-2600(19)30198-5. - DOI - PMC - PubMed
-
- Richards J.C., Crecelius A.R., Larson D.G., Luckasen G.J., Dinenno F.A. Integrative Cardiovascular Physiology and Pathophysiology: Impaired peripheral vasodilation during graded systemic hypoxia in healthy older adults: Role of the sympathoadrenal system. Am. J. Physiol.-Heart Circ. Physiol. 2017;312:H832. doi: 10.1152/ajpheart.00794.2016. - DOI - PMC - PubMed
-
- Ryskova L., Pospisilova K., Vavra J., Wolf T., Dvorak A., Vitek L., Polak J. Contribution of glucose and glutamine to hypoxia-induced lipid synthesis decreases, while contribution of acetate increases, during 3T3-L1 differentiation. Sci. Rep. 2024;14:28193. doi: 10.1038/s41598-024-79458-0. - DOI - PMC - PubMed
-
- Chen Y.C., Hsu P.Y., Su M.C., Chen Y.L., Chang Y.T., Chin C.H., Lin I.C., Chen Y.M., Wang T.Y., Lin Y.Y., et al. Long non-coding RNA FKSG29 regulates oxidative stress and endothelial dysfunction in obstructive sleep apnea. Mol. Cell. Biochem. 2024;479:2723–2740. doi: 10.1007/s11010-023-04880-3. - DOI - PubMed
Grants and funding
LinkOut - more resources
Full Text Sources
Miscellaneous
