

Impact of Ex Vivo Bisphenol A Exposure on Gut Microbiota Dysbiosis and Its Association with Childhood Obesity
- PMID: 39846546
- PMCID: PMC11755556
- DOI: 10.3390/jox15010014
Impact of Ex Vivo Bisphenol A Exposure on Gut Microbiota Dysbiosis and Its Association with Childhood Obesity
Abstract
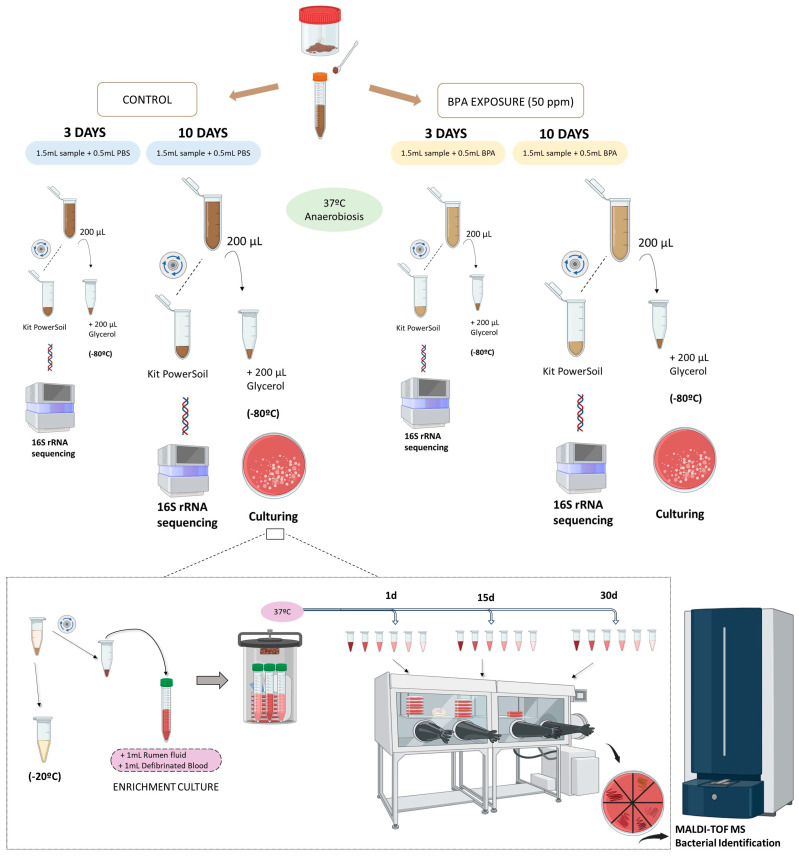
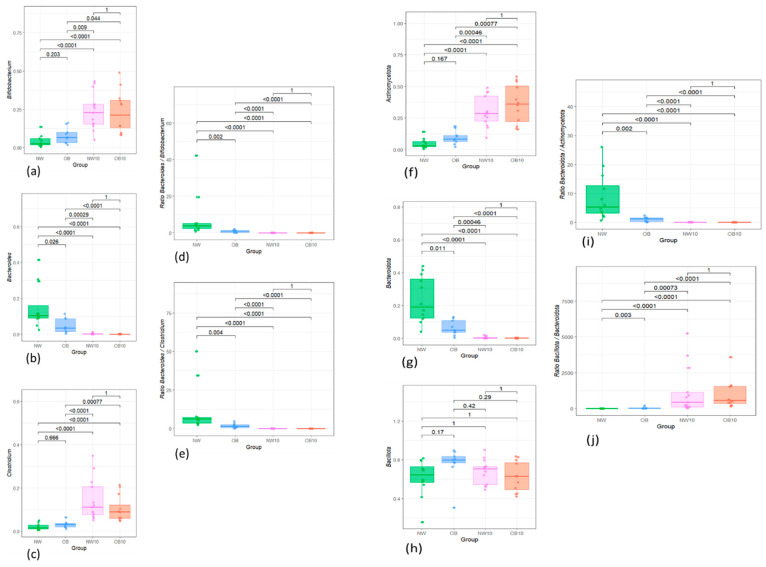
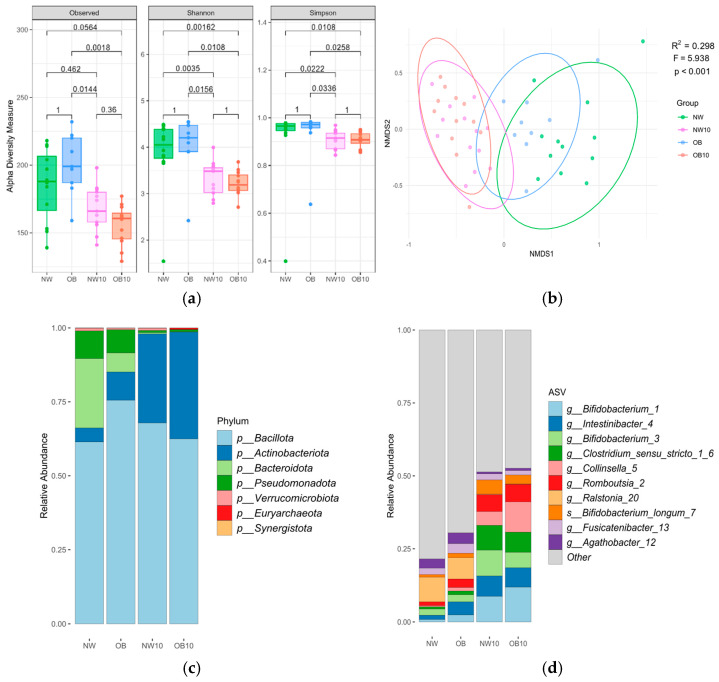
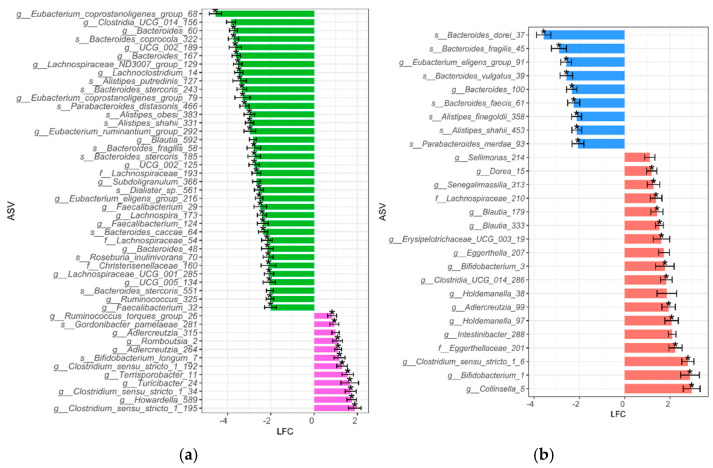
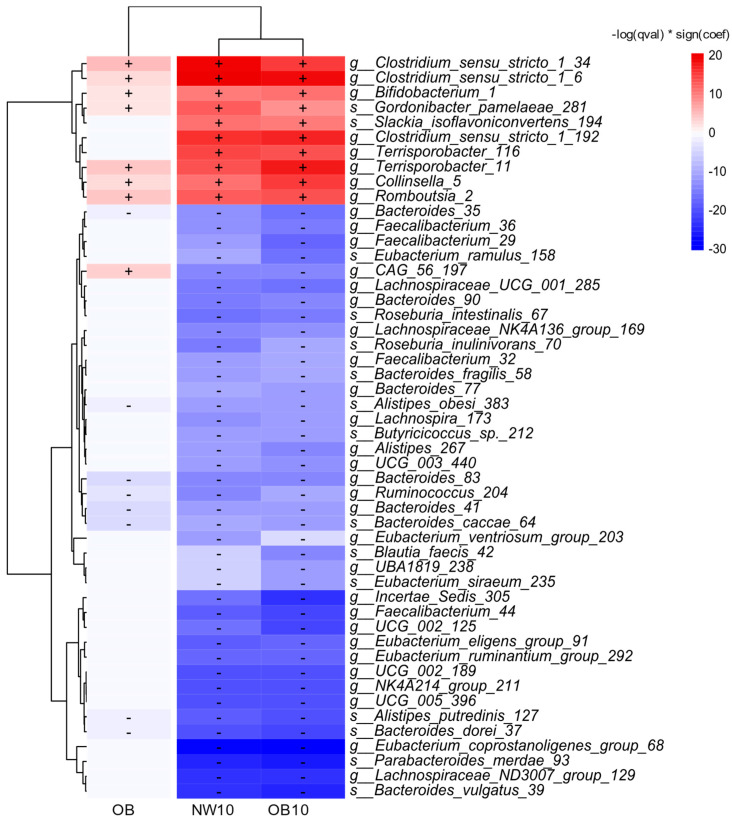
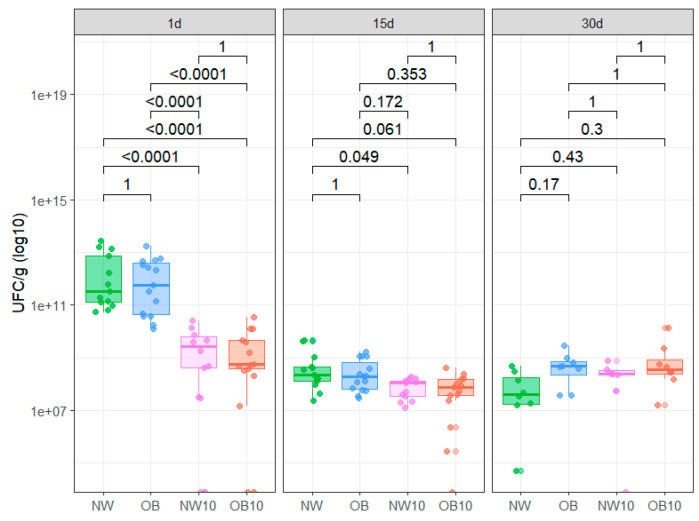
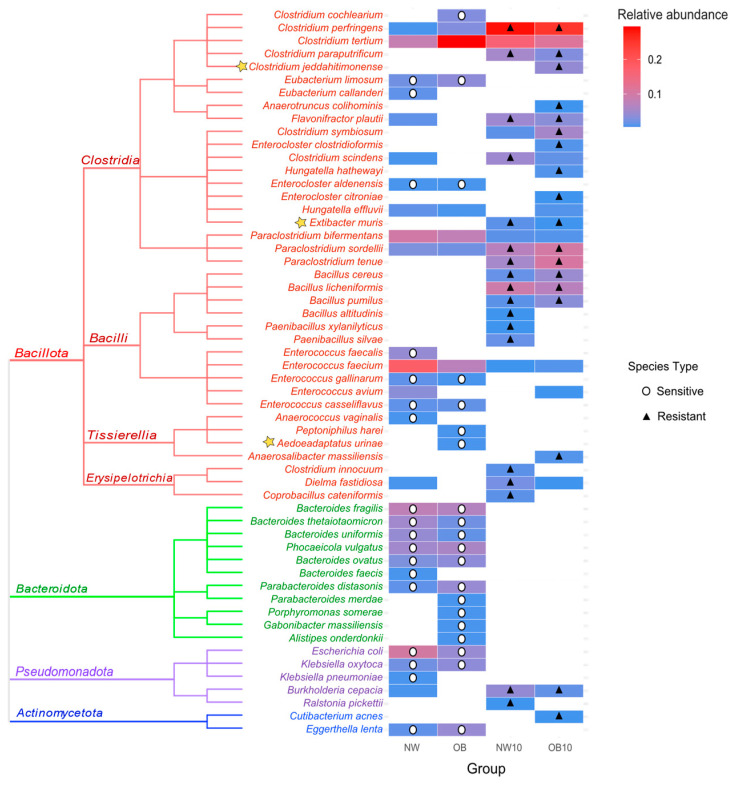
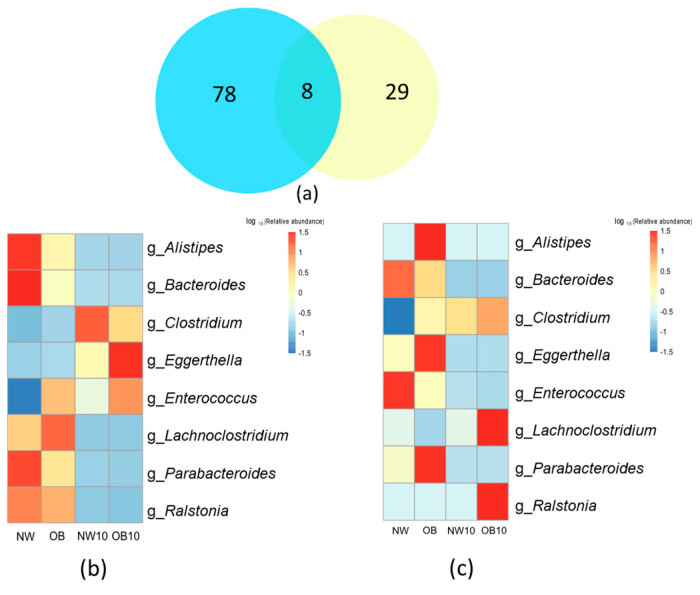
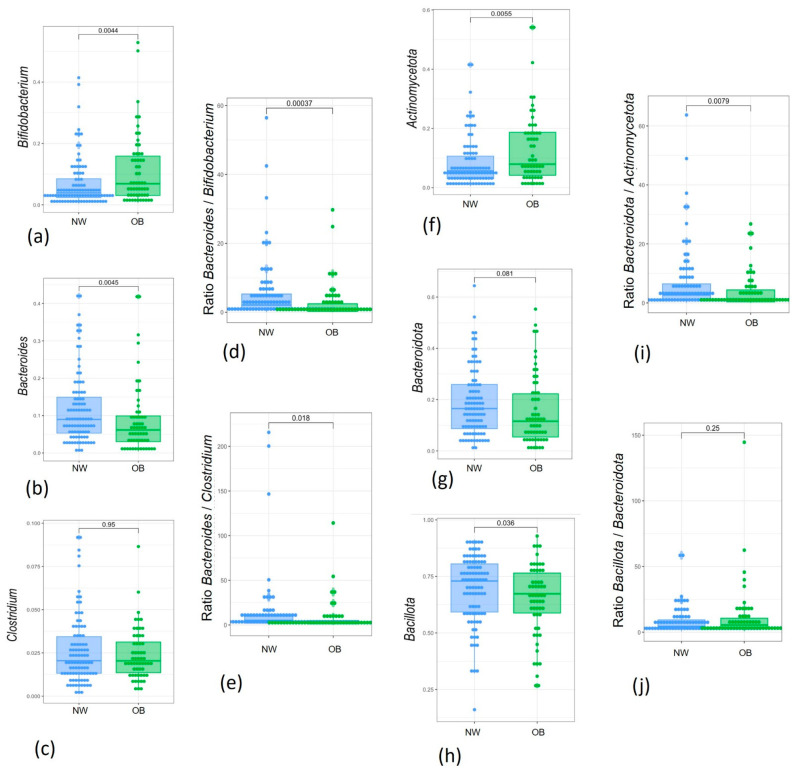
Dietary exposure to the plasticiser bisphenol A (BPA), an obesogenic and endocrine disruptor from plastic and epoxy resin industries, remains prevalent despite regulatory restriction and food safety efforts. BPA can be accumulated in humans and animals, potentially exerting differential health effects based on individual metabolic capacity. This pilot study examines the impact of direct ex vivo BPA exposure on the gut microbiota of obese and normal-weight children, using 16S rRNA amplicon sequencing and anaerobic culturing combined methods. Results showed that direct xenobiotic exposure induced modifications in microbial taxa relative abundance, community structure, and diversity. Specifically, BPA reduced the abundance of bacteria belonging to the phylum Bacteroidota, while taxa from the phylum Actinomycetota were promoted. Consistently, Bacteroides species were classified as sensitive to BPA, whereas bacteria belonging to the class Clostridia were identified as resistant to BPA in our culturomics analysis. Some of the altered bacterial abundance patterns were common for both the BPA-exposed groups and the obese non-exposed group in our pilot study. These findings were also corroborated in a larger cohort of children. Future research will be essential to evaluate these microbial taxa as potential biomarkers for biomonitoring the effect of BPA and its role as an obesogenic substance in children.
Keywords: dysbiosis; ex vivo BPA exposure; microbiota taxa; obesity.
Conflict of interest statement
The authors declare no conflicts of interest.
Figures
Similar articles
-
Bisphenol A exposure affects specific gut taxa and drives microbiota dynamics in childhood obesity.mSystems. 2024 Mar 19;9(3):e0095723. doi: 10.1128/msystems.00957-23. Epub 2024 Mar 1. mSystems. 2024. PMID: 38426791 Free PMC article.
-
Culturing and Molecular Approaches for Identifying Microbiota Taxa Impacting Children's Obesogenic Phenotypes Related to Xenobiotic Dietary Exposure.Nutrients. 2022 Jan 6;14(2):241. doi: 10.3390/nu14020241. Nutrients. 2022. PMID: 35057422 Free PMC article.
-
Perinatal Bisphenol A Exposure Induces Chronic Inflammation in Rabbit Offspring via Modulation of Gut Bacteria and Their Metabolites.mSystems. 2017 Oct 10;2(5):e00093-17. doi: 10.1128/mSystems.00093-17. eCollection 2017 Sep-Oct. mSystems. 2017. PMID: 29034330 Free PMC article.
-
Is bisphenol A an environmental obesogen?Fundam Clin Pharmacol. 2017 Dec;31(6):594-609. doi: 10.1111/fcp.12300. Epub 2017 Jul 7. Fundam Clin Pharmacol. 2017. PMID: 28622415 Review.
-
Bisphenol A (BPA) Leading to Obesity and Cardiovascular Complications: A Compilation of Current In Vivo Study.Int J Mol Sci. 2022 Mar 9;23(6):2969. doi: 10.3390/ijms23062969. Int J Mol Sci. 2022. PMID: 35328389 Free PMC article. Review.
Cited by
-
Analysis of Human Gut Microbiota Enzymes for Biotechnological and Food Industrial Applications.Foods. 2025 May 18;14(10):1794. doi: 10.3390/foods14101794. Foods. 2025. PMID: 40428573 Free PMC article.
References
-
- Della Rocca Y., Traini E.M., Diomede F., Fonticoli L., Trubiani O., Paganelli A., Pizzicannella J., Marconi G.D. Current Evidence on Bisphenol A Exposure and the Molecular Mechanism Involved in Related Pathological Conditions. Pharmaceutics. 2023;15:908. doi: 10.3390/pharmaceutics15030908. - DOI - PMC - PubMed
-
- Lee J., Choi K., Park J., Moon H.-B., Choi G., Lee J.J., Suh E., Kim H.-J., Eun S.-H., Kim G.-H., et al. Bisphenol A Distribution in Serum, Urine, Placenta, Breast Milk, and Umbilical Cord Serum in a Birth Panel of Mother–Neonate Pairs. Sci. Total Environ. 2018;626:1494–1501. doi: 10.1016/j.scitotenv.2017.10.042. - DOI - PubMed
Grants and funding
LinkOut - more resources
Full Text Sources
