Hepatic Estrogen Receptor Alpha Overexpression Protects Against Hepatic Insulin Resistance and MASLD
- PMID: 39846638
- PMCID: PMC11755535
- DOI: 10.3390/pathophysiology32010001
Hepatic Estrogen Receptor Alpha Overexpression Protects Against Hepatic Insulin Resistance and MASLD
Abstract
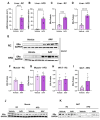
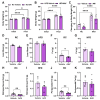
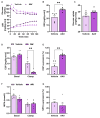
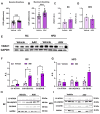
Background/Objectives: Metabolic dysfunction-associated steatotic liver disease (MASLD) is associated with cardiometabolic risk. Although studies have shown that estradiol positively contributes to energy metabolism via estrogen receptor alpha (ERα), its role specifically in the liver is not defined. Therefore, this study aimed to evaluate the effects of ERα overexpression, specifically in the liver in mice fed a high-fat diet (HFD). Methods: Male C57BL/6J mice were divided into four groups, vehicle fed with regular chow (RC) (RC-Vehicle); vehicle fed an HFD (HFD-Vehicle); AAV-treated fed with RC (RC-AAV); and AAV-treated fed an HFD (HFD-AAV), for 6 weeks (8-10 mice per group). AAV was administered intravenously to induce ERα overexpression. Results: We demonstrate that overexpression of ERα in RC-fed mice reduces body fat (28%). These mice show increased oxygen consumption in cultured primary hepatocytes, both in basal (19%) and maximal respiration (34%). In HFD-fed mice, we showed a decrease in hepatic TAG content (43%) associated with improved hepatic insulin sensitivity (145%). Conclusions: From this perspective, our results prove that hepatic ERα signaling is responsible for some of the metabolic protective effects of estrogen in mice. Overexpression of ERα improves hepatocyte mitochondrial function, consequently reducing hepatic lipid accumulation and protecting animals from hepatic steatosis and hepatic insulin resistance. Further investigations will be needed to determine the exact molecular mechanism by which ERα improves hepatic metabolic health.
Keywords: MASLD; estrogen signaling; hepatic insulin resistance; insulin action.
Conflict of interest statement
The author(s) declare no potential conflicts of interest with respect to the research, authorship, and/or publication of this article.
Figures


Similar articles
-
Membrane estrogen receptor-α contributes to female protection against high-fat diet-induced metabolic disorders.Front Endocrinol (Lausanne). 2023 Jul 17;14:1215947. doi: 10.3389/fendo.2023.1215947. eCollection 2023. Front Endocrinol (Lausanne). 2023. PMID: 37529599 Free PMC article.
-
Hormone signaling and fatty liver in females: analysis of estrogen receptor α mutant mice.Int J Obes (Lond). 2017 Jun;41(6):945-954. doi: 10.1038/ijo.2017.50. Epub 2017 Feb 21. Int J Obes (Lond). 2017. PMID: 28220039 Free PMC article.
-
Cysteine-rich 61 inhibition attenuates hepatic insulin resistance and improves lipid metabolism in high-fat diet fed mice and HepG2 cells.FASEB J. 2024 Aug 15;38(15):e23859. doi: 10.1096/fj.202400860R. FASEB J. 2024. PMID: 39082187 Free PMC article.
-
Liver-specific Prkn knockout mice are more susceptible to diet-induced hepatic steatosis and insulin resistance.Mol Metab. 2020 Nov;41:101051. doi: 10.1016/j.molmet.2020.101051. Epub 2020 Jul 10. Mol Metab. 2020. PMID: 32653576 Free PMC article.
-
Gracilaria chorda subcritical water ameliorates hepatic lipid accumulation and regulates glucose homeostasis in a hepatic steatosis cell model and obese C57BL/6J mice.J Ethnopharmacol. 2024 Feb 10;320:117395. doi: 10.1016/j.jep.2023.117395. Epub 2023 Nov 11. J Ethnopharmacol. 2024. PMID: 37952731
Cited by
-
Comparative analysis of β-Estradiol and testosterone on lipid droplet accumulation, and regulatory protein expression in palmitate/oleate-induced fatty HepG2 cells.BMC Gastroenterol. 2025 Apr 16;25(1):263. doi: 10.1186/s12876-025-03863-6. BMC Gastroenterol. 2025. PMID: 40240962 Free PMC article.
-
The Ability of the Triglyceride-Glucose (TyG) Index and Modified TyG Indexes to Predict the Presence of Metabolic-Associated Fatty Liver Disease and Metabolic Syndrome in a Pediatric Population with Obesity.J Clin Med. 2025 Mar 28;14(7):2341. doi: 10.3390/jcm14072341. J Clin Med. 2025. PMID: 40217790 Free PMC article.
-
MASLD: Prevalence, Mechanisms, and Sex-Based Therapies in Postmenopausal Women.Biomedicines. 2025 Apr 2;13(4):855. doi: 10.3390/biomedicines13040855. Biomedicines. 2025. PMID: 40299427 Free PMC article. Review.
-
Medicinal plants for the treatment and prevention of post-menopausal obesity: a review.Front Pharmacol. 2025 May 21;16:1564131. doi: 10.3389/fphar.2025.1564131. eCollection 2025. Front Pharmacol. 2025. PMID: 40469982 Free PMC article. Review.
-
Lipid Accumulation and Insulin Resistance: Bridging Metabolic Dysfunction-Associated Fatty Liver Disease and Chronic Kidney Disease.Int J Mol Sci. 2025 Jul 20;26(14):6962. doi: 10.3390/ijms26146962. Int J Mol Sci. 2025. PMID: 40725208 Free PMC article. Review.
References
Grants and funding
LinkOut - more resources
Full Text Sources
