. 2025 Jan 9;11(1):2.
doi: 10.3390/ncrna11010002.

LncRNA 3222401L13Rik Is Upregulated in Aging Astrocytes and Regulates Neuronal Support Function Through Interaction with Npas3

Affiliations

LncRNA 3222401L13Rik Is Upregulated in Aging Astrocytes and Regulates Neuronal Support Function Through Interaction with Npas3

Sophie Schröder et al. Noncoding RNA. .

Abstract

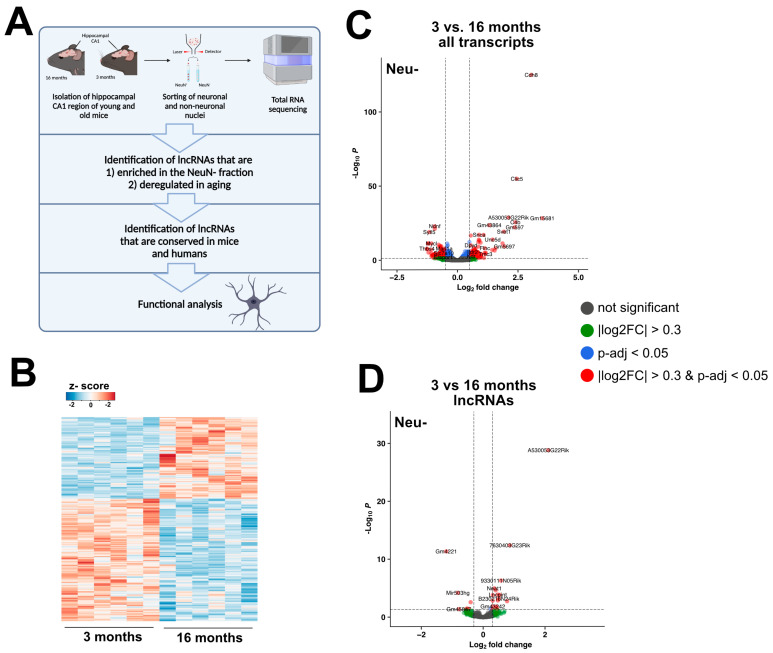
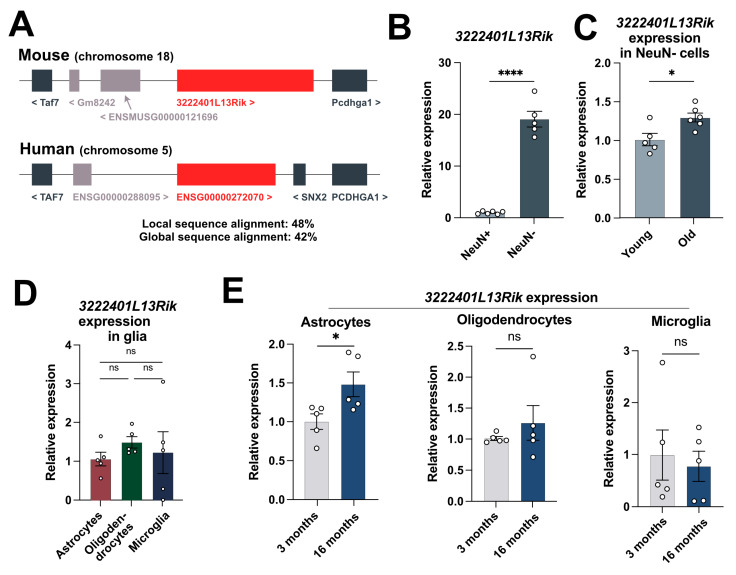
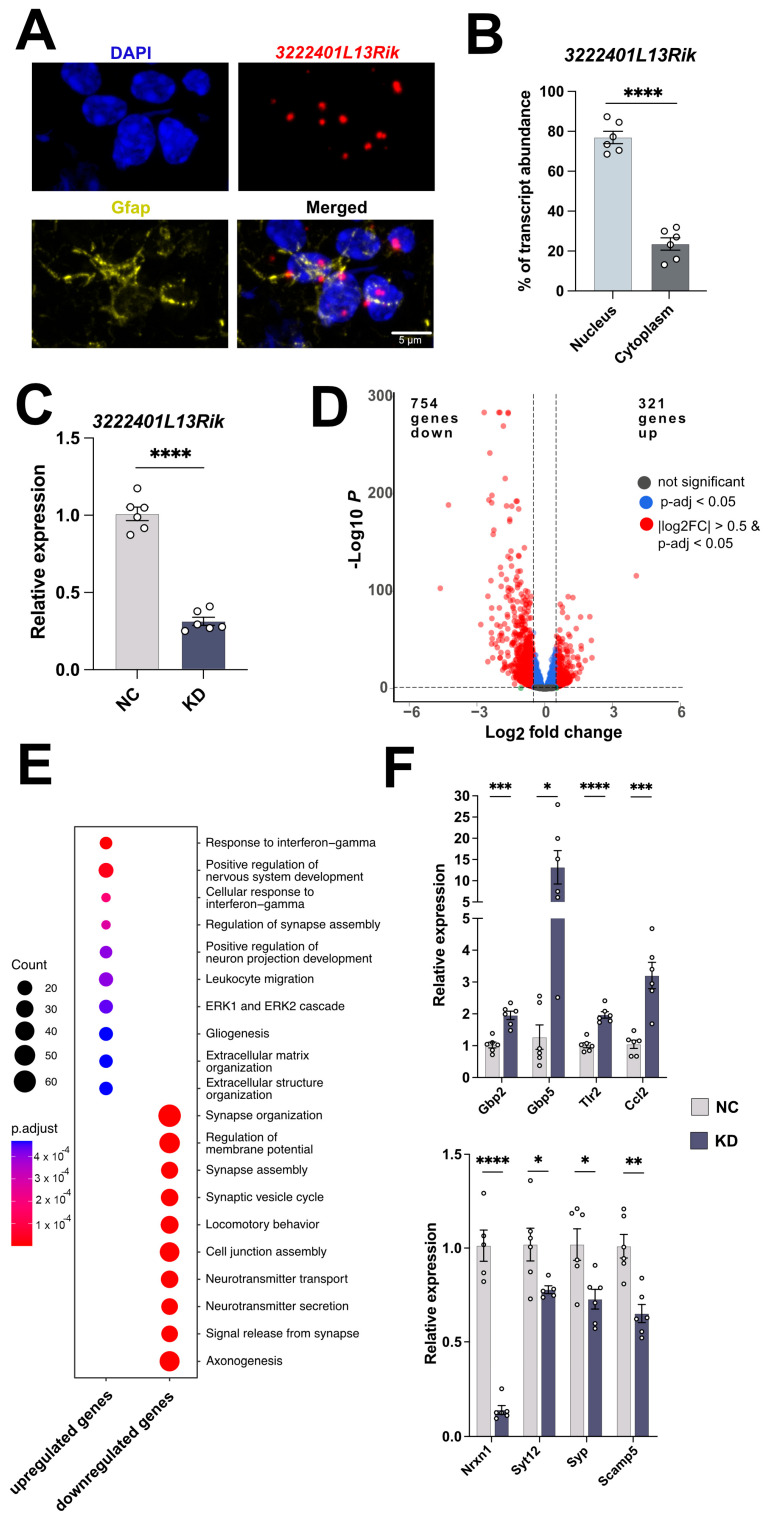
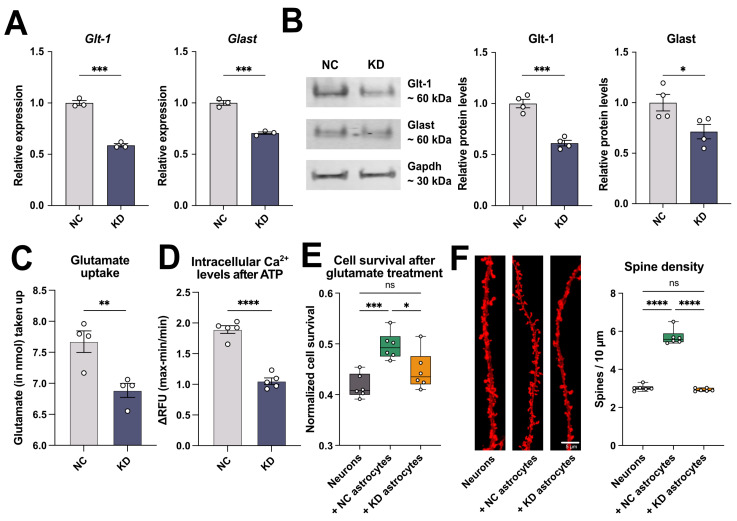
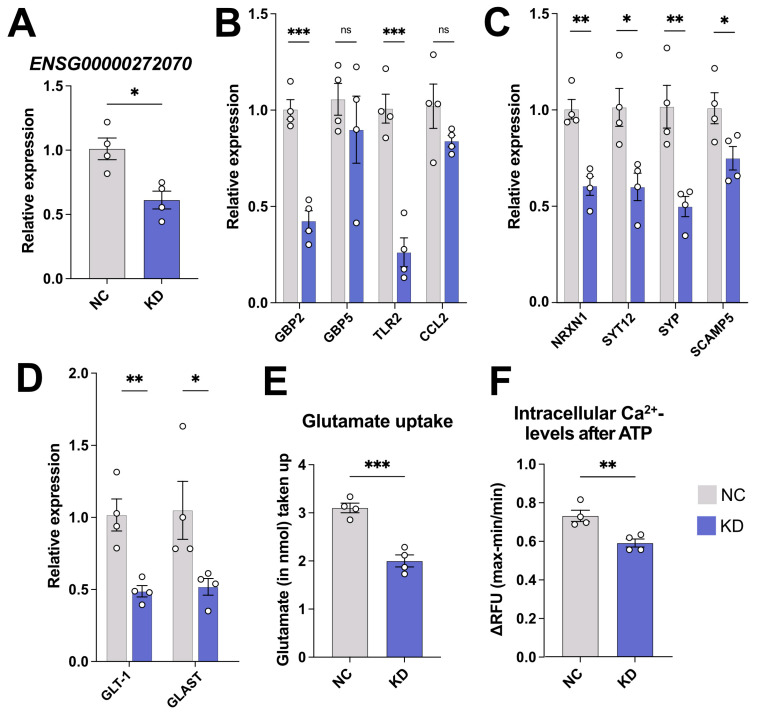
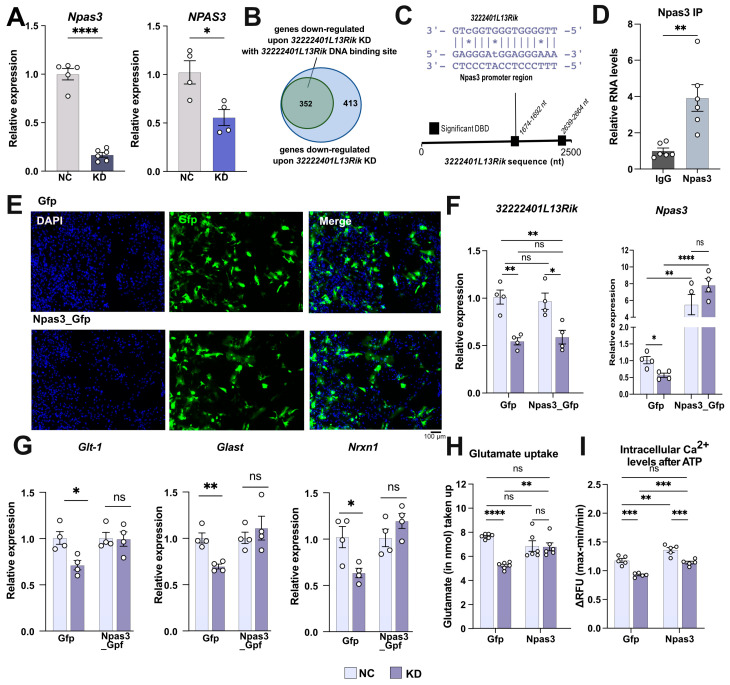
Aging leads to cognitive decline and increased risk of neurodegenerative diseases. While molecular changes in central nervous system (CNS) cells contribute to this decline, the mechanisms are not fully understood. Long non-coding RNAs (lncRNAs) are key regulators of cellular functions. Background/Objectives: The roles of lncRNAs in aging, especially in glial cells, are not well characterized. Methods: We investigated lncRNA expression in non-neuronal cells from aged mice and identified 3222401L13Rik, a previously unstudied lncRNA, as upregulated in astrocytes during aging. Results: Knockdown of 3222401L13Rik in primary astrocytes revealed its critical role in regulating genes for neuronal support and synapse organization, a function conserved in human iPSC-derived astrocytes. A 3222401L13Rik interacts with the transcription factor Neuronal PAS Domain Protein 3 (Npas3), and overexpression of Npas3 rescues deficits in astrocytes lacking 3222401L13Rik. Conclusions: These data suggest that 3222401L13Rik upregulation may help delay age-related cognitive decline.

Keywords: Alzheimer’s disease; aging; astrocytes; brain; lncRNA; neurodegenerative diseases; non-coding RNA; transcriptomics.


Conflict of interest statement

The authors declare no competing interests.

Figures

Figure 1
Figure 1
Aging induces changes in glial lncRNA expression patterns. (A) Schematic illustration of the experimental approach of this study. (B) Heatmap showing gene expression changes in Neu– nuclei isolated in 3- vs. 16-month-old mice. (C) Volcano plot showing the up- and downregulated coding transcripts when comparing Neu– nuclei from 3 vs. 16-month-old mice (log2fold changes are depicted as 16/3 months). (D) Volcano plot showing expression changes in lncRNAs in Neu– nuclei (log2fold changes are depicted as 16/3 months).
Figure 2
Figure 2
A 3222401L13Rik is a glial lncRNA that is upregulated in astrocytes during aging. (A) Schematic illustration of the genomic localization of 3222401L13Rik in the mouse and ENSG00000272070 in the human genome. (B) Expression of the lncRNA 3222401L13Rik in NeuN+ and NeuN− cells isolated from the hippocampal CA1 region of 3-month-old mice (unpaired t-test; **** p < 0.0001). (C) qPCR data showing the expression of 3222401L13Rik in NeuN− cells from 3- and 16-month-old mice (unpaired t-test; * p < 0.05). (D) Expression of 3222401L13Rik in astrocytes, oligodendrocytes, and microglia isolated from the brains of 3-month-old mice using MACS (One-way ANOVA; ns = not significant). (E) Expression of 3222401L13Rik in astrocytes, oligodendrocytes, and microglia isolated from the brains of 3- and 16-month-old mice using MACS technology (unpaired t-test; * p < 0.05, ns = not significant). Data are depicted as mean ± standard error.
Figure 3
Figure 3
3222401L13Rik controls the expression of genes linked to innate immune response and synaptic support functions. (A) Representative image showing the nuclear localization of 3222401L13Rik (RNAscope) in astrocytes (immunofluorescence for Gfap) in the adult mouse brain. Nuclei are stained using DAPI. (B) Bar chart showing the results of a qCPR that analyzes the expression of 3222401L13Rik in nuclear and cytoplasmic fractions isolated from primary astrocytes (unpaired t-test; **** p < 0.0001). (C) Bar charts showing qPCR results to measure the expression levels of 3222401L13Rik after treatment with NC or KD ASOs (**** p < 0.0001). (D) Volcano Plot showing the up- and downregulated genes 48 h after the KD of 3222401L13Rik in primary astrocytes (log2fold changes are depicted as KD/WT). (E) Gene Ontology analysis of the genes shown in (D). Analysis was performed using clusterProfiler (v4.6.0) [31]. (Two-sided hypergeometric test was used to calculate the importance of each term, and the Benjamini–Hochberg procedure was applied for p-value correction). (F) Expression levels of selected genes that were deregulated after the KD of 3222401L13Rik. Upper panel: upregulated genes. Lower panel: downregulated genes (unpaired t-test; * p < 0.05, ** p < 0.01, *** p < 0.001, **** p < 0.0001). Data are depicted as mean ± standard error. NC: negative control, KD: knockdown of 3222401L13Rik.
Figure 4
Figure 4
The KD of 3222401L13Rik affects glutamate uptake, Ca2+ signaling, and the support of neuronal function. (A) qPCR showing the expression levels of the glutamate transporters Glt-1 and Glast after the KD of 3222401L13Rik in primary astrocytes (unpaired t-test; *** p < 0.001). (B) Left panel: Representative immunoblot images of Glt-1 and Glast following the KD of 3222401L13Rik. in primary astrocytes. Right panel: Quantification of the left panel (unpaired t-test; * p < 0.05, *** p < 0.001). (C) Glutamate uptake of primary astrocytes after the KD of 3222401L13Rik (unpaired t-test; ** p < 0.01). (D) Increase in intracellular Ca2+ levels in response to ATP treatment after the KD of 3222401L13Rik (unpaired t-test; **** p < 0.0001). (E) Survival of neurons after treatment with 100 µM glutamate cultured alone or co-cultured with NC or KD astrocytes (One-way ANOVA; * p < 0.05, *** p < 0.001, ns = not significant). (F) Left panel: Representative images of dendrite and spine labeling of neurons cultured alone or co-cultured with NC or KD astrocytes. Right panel: Quantification of spines shown in the left panel (One-way ANOVA; **** p < 0.0001; ns = not significant). Data are depicted as mean ± standard error. NC: negative control. KD: knockdown.
Figure 5
Figure 5
The synaptic support functions of 3222401L13Rik are conserved in human astrocytes. (A) KD of ENSG00000272070 in human iPSC-derived astrocytes (unpaired t-test; * p < 0.05). (B) Expression levels of interferon response genes after the KD of ENSG00000272070 in human iPSC-derived astrocytes (unpaired t-test; *** p < 0.001; ns = not significant). (C) Expression levels of genes associated with synaptic support after the KD of ENSG00000272070 in human iPSC-derived astrocytes (unpaired t-test; * p < 0.05; ** p < 0.01). (D) qPCR showing the expression of the glutamate transporters GLT-1 and GLAST after the KD of ENSG00000272070 in human iPSC-derived astrocytes (unpaired t-test; * p < 0.05; ** p < 0.01). (E) Glutamate uptake after the KD of ENSG00000272070 (unpaired t-test; *** p < 0.001). (F) Increase in intracellular Ca2+ levels in response to ATP stimulation after the KD of ENSG00000272070 (unpaired t-test; ** p < 0.01). Data are depicted as mean ± standard error. NC: negative control. KD: knockdown.
Figure 6
Figure 6
The overexpression of the interaction partner Npas3 can rescue molecular and functional changes induced by the loss of 3222401L13Rik. (A) qPCR showing the expression levels of Npas3/NPAS3 in mouse (left panel) and human iPSC-derived (right panel) astrocytes after the KD of 3222401L13Rik (unpaired t-test; * p < 0.05, **** p < 0.0001). (B) Venn diagram showing the proportion of downregulated genes (352 out of 765) containing a promoter region that can bind 3222401L13Rik. The Triplex Domain Finder tool [39] was used to identify promoter regions of the downregulated genes that have a binding motif for 3222401L13Rik. (C) Scheme depicting the significant DNA binding domains (DBD) in the sequence of 3222401L13Rik determined using the Triplex Domain Finder tool and the sequence motifs where 3222401L13Rik binds to the promoter of Npas3. (D) RNA immunoprecipitation for Npas3, followed by qPCR for 3222401L13Rik in mouse primary astrocytes (unpaired t-test; ** p < 0.01). (E) Representative immunofluorescence images showing the transfection of primary astrocytes with Gfp- or Gfp-Npas3-overexpression plasmids. Scale bar: 100 µm. (F) Expression levels of 3222401L13Rik and Npas3 after the simultaneous KD of 3222401L13Rik and overexpression of Npas3 in primary astrocytes (One-way ANOVA; * p < 0.05; ** p < 0.01; **** p < 0.0001; ns = not significant). (G) Expression levels of Glt-1, Glast, and Nrxn1 after the simultaneous KD of 3222401L13Rik and overexpression of Npas3 in primary astrocytes (One-way ANOVA; * p < 0.05; ** p < 0.01; ns = not significant). (H) Glutamate uptake of primary astrocytes after the simultaneous KD of 3222401L13Rik and overexpression of Npas3 (One-way ANOVA; ** p < 0.01; **** p < 0.0001; ns = not significant). (I) Increase in intracellular Ca2+ levels in response to ATP stimulation after the simultaneous KD of 3222401L13Rik and overexpression of Npas3 (One-way ANOVA; ** p < 0.01; *** p < 0.001; ns = not significant). Data are depicted as mean ± standard error. NC: negative control. KD: knockdown.

Similar articles

Cited by

References

    1. Hou Y., Dan X., Babbar M., Wei Y., Hasselbalch S.G., Croteau D.L., Bohr V.A. Ageing as a risk factor for neurodegenerative disease. Nat. Rev. Neurol. 2019;15:565–581. doi: 10.1038/s41582-019-0244-7. - DOI - PubMed
    1. Berchtold N.C., Cribbs D.H., Coleman P.D., Rogers J., Head E., Kim R., Beach T., Miller C., Troncoso J., Trojanowski J.Q., et al. Gene expression changes in the course of normal brain aging are sexually dimorphic. Proc. Natl. Acad. Sci. USA. 2008;105:15605–15610. doi: 10.1073/pnas.0806883105. - DOI - PMC - PubMed
    1. Peleg S., Sananbenesi F., Zovoilis A., Burkhardt S., Bahari-Java S., Agis-Balboa R.C., Cota P., Wittnam J., Gogul-Doering A., Opitz L., et al. Altered histone acetylation is associated with age-dependent memory impairment in mice. Science. 2010;328:753–756. doi: 10.1126/science.1186088. - DOI - PubMed
    1. Royall D.R., Palmer R., Chiodo L.K., Polk M.J. Normal rates of cognitive change in successful aging: The freedom house study. J. Int. Neuropsychol. Soc. 2005;11:899–909. doi: 10.1017/S135561770505109X. - DOI - PubMed
    1. Murman D.L. The Impact of Age on Cognition. Semin. Hear. 2015;36:111–121. doi: 10.1055/s-0035-1555115. - DOI - PMC - PubMed

LinkOut - more resources