. 2024 Dec 16;54(1):dyae175.
doi: 10.1093/ije/dyae175.

A proteogenomic analysis of the adiposity colorectal cancer relationship identifies GREM1 as a probable mediator

Affiliations

A proteogenomic analysis of the adiposity colorectal cancer relationship identifies GREM1 as a probable mediator

Matthew A Lee et al. Int J Epidemiol. .

Abstract

Background: Adiposity is an established risk factor for colorectal cancer (CRC). The pathways underlying this relationship, and specifically the role of circulating proteins, are unclear.

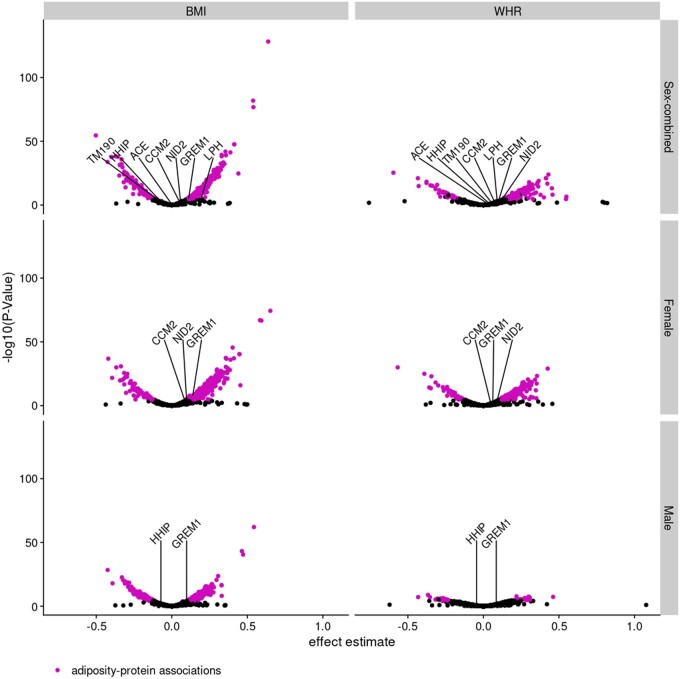
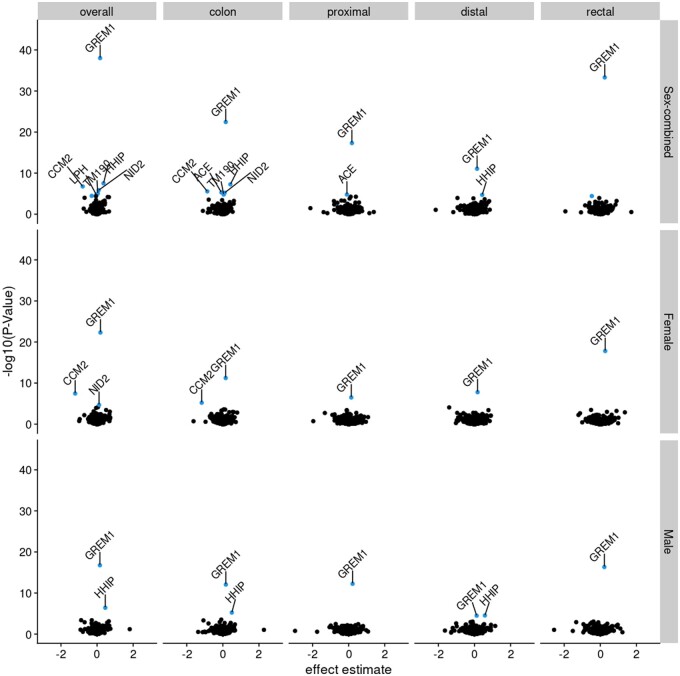
Methods: Utilizing two-sample univariable Mendelian randomization (UVMR), multivariable Mendelian randomization (MVMR), and colocalization, based on summary data from large sex-combined and sex-specific genetic studies, we estimated the univariable associations between: (i) body mass index (BMI) and waist-hip ratio (WHR) and overall and site-specific (colon, proximal colon, distal colon, and rectal) CRC risk, (ii) BMI and WHR and circulating proteins, and (iii) adiposity-associated circulating proteins and CRC risk. We used MVMR to investigate the potential mediating role of adiposity- and CRC-related circulating proteins in the adiposity-CRC association.

Results: BMI and WHR were positively associated with CRC risk, with similar associations by anatomical tumor site. In total, 6591 adiposity-protein (2628 unique circulating proteins) and 33 protein-CRC (7 unique circulating proteins) associations were identified using UVMR and colocalization. One circulating protein, GREM1, was associated with BMI (only) and CRC outcomes in a manner that was consistent with a potential mediating role in sex-combined and female-specific analyses. In MVMR, adjusting the BMI-CRC association for GREM1, effect estimates were attenuated-suggestive of a potential mediating role-most strongly for the BMI-overall CRC association in women.

Conclusion: Results highlight the impact of adiposity on the plasma proteome and of adiposity-associated circulating proteins on the risk of CRC. Supported by evidence from UVMR and colocalization analyses using cis-single-nucleotide polymorphisms, GREM1 was identified as a potential mediator of the BMI-CRC association, particularly in women.

Keywords: Mendelian randomization; adiposity; colocalization; colorectal cancer; proteome.


Conflict of interest statement

None declared.

Figures

Figure 1.
Figure 1.
Analysis overview. Directed acyclic graph overview of main analyses. i–iii: univariable Mendelian randomization (MR) analyses, iv: multivariable MR analysis. Text to the right of each analysis gives the requirements for an association. MR assumptions: (1) the instrument is associated with the exposure, (2) there are no confounders of the association between the instrument and the outcome, (3) the instrument is not related to the outcome except via its effect on the exposure; G: genetic variant(s); U: unmeasured confounders; p*: prior probability of a random single nucleotide polymorphism in the region (1) being (causally associated with Trait 1 and not Trait 2, (2) Trait 2 and not Trait 1, or (12) both traits; h4: probability that there is an association with both traits in the region (shared causal variant)
Figure 2.
Figure 2.
Association between adiposity measures and colorectal cancer outcomes. Odds ratios and 95% confidence intervals shown for the main analysis using the inverse-variance weighted multiplicative random-effects (IVW-MRE) model. BMI, body mass index; WHR, waist–hip ratio
Figure 3.
Figure 3.
Overview of associations between adiposity measures and circulating proteins (Step ii in the main analysis plan). Arrows show the direction of the univariable (UV) Mendelian randomization (MR) (UVMR) analysis. Values on the outside of the lines indicate the number of associations identified in that direction; values between the lines indicate the number of associations identified in both directions and for which there is, therefore, conflicting evidence of association. Associations were identified if all MR models had consistent directions of effect and a PhenoSpD (pheno spectral decomposition) corrected P-value (3.97 × 10⁻⁵) was met for the main MR model. N gives the number of circulating proteins available for analysis. BMI-WHR-associated gives the number of circulating proteins with unconflicted evidence of association with the adiposity measure. BMI, body mass index; WHR, waist–hip ratio
Figure 4.
Figure 4.
Association between adiposity measures and circulating proteins in Step ii of the main analysis plan. The volcano plot shows effect estimates and -log10(P-val). Adiposity–protein associations are highlighted [analyses reaching the PhenoSpD (pheno spectral decomposition) corrected P-value (0.05/1293)], consistent directions of effect across Mendelian randomization (MR) models, and no conflicting association identified in the reverse univariable (UV) MR. Proteins labeled by name were associated with both adiposity and colorectal cancer outcomes, the latter as determined in the UVMR analysis in Step iii of the main analysis plan. BMI, body mass index; WHR, waist–hip ratio
Figure 5.
Figure 5.
Overview of associations between circulating proteins and colorectal cancer outcomes (Step iii in the main analysis plan). Arrows show the direction of the univariable (UV) Mendelian randomization (MR) (UVMR) analysis (protein–CRC to the left; CRC–protein to the right). Values on the outside of the lines indicate the number of associations identified in that direction; values between the lines indicate the number of associations identified in both directions and for which there is, therefore, conflicting evidence of association. Associations were identified if the PhenoSpD (pheno spectral decomposition) P-value threshold (3.97 × 10⁻⁵) was reached for the forward and reverse MR and if all MR models had consistent directions of effect in the reverse MR. N gives the total number of circulating proteins available for analysis. MR gives the number of cis-SNP UVMR analyses that reached the PhenoSpD P-value threshold for that analysis. Colocalization gives the number of circulating proteins that colocalized with that CRC outcome. MR + colocalization gives the overlap between the cis-SNP UVMR and colocalization analyses, and indicates the circulating protein–CRC associations
Figure 6.
Figure 6.
Association between circulating proteins and colorectal cancer outcomes in Step iii of the main analysis plan. The volcano plot shows effect estimates and –log10(pval) with analyses reaching the PhenoSpD corrected P-value (0.05/1293) highlighted and analyses reaching the PhenoSpD corrected P-value and with evidence of colocalization labeled with the circulating protein name. The x-axis has been constrained to –3 to 3, excluding three analyses that did not meet any association thresholds: PTP4A2 and proximal colon cancer in males (effect estimate = 102) and NANS and distal colon cancer in males (effect estimate = 19) and females (effect estimate = 19)
Figure 7.
Figure 7.
Association between body mass index and colorectal cancer outcomes using univariable (the top estimates) and multivariable (the bottom estimates) Mendelian randomization. In these MVMR analyses (Step iv), the effect of BMI on colorectal cancer outcomes is estimated after adjusting for the effect of GREM1. Odds ratios for the inverse-variance weighted multiplicative random-effects model shown alongside 95% confidence intervals. No adiposity–protein–CRC associations were identified in the male UVMR analyses and, as such, MVMR was not performed
Figure 8.
Figure 8.
Tissue gene expression profile of GREM1. The violin plot presents expression levels as log transcripts per million (TPM). Data are from GTEx version 8. Box plots are shown with the interquartile range (25th and 75th percentiles). Different tissue types (e.g. adipose and brain) are highlighted

References

    1. Lee M, Hatcher C, McGuinness L et al. Systematic review and meta-analyses: What has the application of Mendelian randomization told us about the causal effect of adiposity on health outcomes? [version 1; peer review: awaiting peer review]. Wellcome Open Res 2022;7:308. - PMC - PubMed
    1. Bull CJ, Bell JA, Murphy N et al. Adiposity, metabolites, and colorectal cancer risk: Mendelian randomization study. BMC Med. BioMed Central 2020;18:396. - PMC - PubMed
    1. Lauby-Secretan B, Scoccianti C, Loomis D, Grosse Y, Bianchini F, Straif K, International Agency for Research on Cancer Handbook Working Group. Body fatness and cancer–viewpoint of the IARC working group. N Engl J Med 2016;375:794–98. - PMC - PubMed
    1. Goudswaard LJ, Bell JA, Hughes DA et al. Effects of adiposity on the human plasma proteome: observational and Mendelian randomisation estimates. Int J Obes (Lond) 2021;45:2221–29. - PMC - PubMed
    1. Kibble M, Khan SA, Ammad-Ud-Din M et al. An integrative machine learning approach to discovering multi-level molecular mechanisms of obesity using data from monozygotic twin pairs. R Soc Open Sci. Royal Society 2020;7:200872. - PMC - PubMed

Substances